Copyright © 2001 by Annual Reviews. All rights reserved
| Annu. Rev. Astron. Astrophys. 2001. 39:
249-307 Copyright © 2001 by Annual Reviews. All rights reserved |


5.2. The EBL Spectrum Expected from Nucleosynthesis
Numerous models have been developed for calculating the evolution of the
cosmic spectral luminosity density,

 ( ,
z), as a function of redshift, and thus for calculating the
EBL. Most of these models were originally used to predict galaxy number
counts in deep photometric surveys in order to probe galaxy
evolution. In two review papers,
Lonsdale (1995,
1996)
grouped the various models into two categories: backward evolution (BE)
and forward evolution (FE) models. We distinguish two additional
categories: semianalytical (SA) and cosmic chemical evolution (CCE)
models. The models differ in their degree of complexity, physical
realism, and ability to account for observations or to make
predictions. We give a brief description of models in each category,
with references to more detailed accounts.
( ,
z), as a function of redshift, and thus for calculating the
EBL. Most of these models were originally used to predict galaxy number
counts in deep photometric surveys in order to probe galaxy
evolution. In two review papers,
Lonsdale (1995,
1996)
grouped the various models into two categories: backward evolution (BE)
and forward evolution (FE) models. We distinguish two additional
categories: semianalytical (SA) and cosmic chemical evolution (CCE)
models. The models differ in their degree of complexity, physical
realism, and ability to account for observations or to make
predictions. We give a brief description of models in each category,
with references to more detailed accounts.
5.2.1. BACKWARD EVOLUTION MODELS
Backward evolution models extrapolate the spectral properties of local
galaxies to higher redshifts using some parametric form for their
evolution. In their simplest form, commonly referred to as no-evolution
models, these models assume that neither the SED nor the comoving number
density of galaxies evolve with time. The spectral luminosity density,
(z) =
( , 0), is therefore explicitly
independent of redshift. At a specific frequency,
0, it is simply
given by the product
L0 ×
 (L0)
dL0, where
L0 is the
galaxy spectral luminosity determined from observations of local
galaxies, and
(L0) is the local galaxy luminosity function (LF). Implicit
in the above expression is a sum over galaxy types. The EBL is then
obtained by integrating the local luminosity density up to a maximum
redshift,
zmax, the epoch when galaxies are assumed to have
first formed. Fundamental differences exist between determinations of
(0) at UV, optical, and near-infrared wavelengths,
where the emission is primarily composed of starlight, and at mid- to
far-infrared wavelengths, where the emission is dominated by thermal
emission from dust.
(L0)
dL0, where
L0 is the
galaxy spectral luminosity determined from observations of local
galaxies, and
(L0) is the local galaxy luminosity function (LF). Implicit
in the above expression is a sum over galaxy types. The EBL is then
obtained by integrating the local luminosity density up to a maximum
redshift,
zmax, the epoch when galaxies are assumed to have
first formed. Fundamental differences exist between determinations of
(0) at UV, optical, and near-infrared wavelengths,
where the emission is primarily composed of starlight, and at mid- to
far-infrared wavelengths, where the emission is dominated by thermal
emission from dust.
At optical and near-infrared wavelengths, the galaxy LF is described by the functional form given by Schechter (1976), with parameters that can vary with galaxy morphology and spectral type (Binggeli et al. 1988, Heyl et al. 1997, Marzke & Da Costa 1997, Marzke et al. 1998). Galactic SEDs are constructed by fitting population synthesis models [such as the models of Bruzual & Charlot (1993)] to observed UV-optical spectra or photometric data for each galaxy type (Pence 1976, Coleman et al. 1980, Yoshii & Takahara 1988, Kennicutt 1992, Kinney et al. 1996, Schmitt et al. 1997, Jansen et al. 2000).
The extension of this approach to

 10 µm is
complicated by the fact that, at these wavelengths, the galaxy SED is
dominated by thermal emission from dust. The LF of infrared galaxies
differs fundamentally from the Schechter LF, which drops below its
infrared counterpart at luminosities above ~ 1011
L
10 µm is
complicated by the fact that, at these wavelengths, the galaxy SED is
dominated by thermal emission from dust. The LF of infrared galaxies
differs fundamentally from the Schechter LF, which drops below its
infrared counterpart at luminosities above ~ 1011
L (Rieke & Lebofsky
1986,
Soifer et al. 1987,
Isobe & Feigelson
1992).
Functional forms and parameters for the infrared LF derived from the
IRAS survey were presented by
Fang et al. (1998), 12
µm;
Shupe et al. (1998),
25 µm;
Soifer et al. (1986,
1987),
60 µm;
Yahil et al. (1991),
60 µm;
Lawrence et
al. (1986), 60 µm;
Saunders et al. (1990),
60 µm;
Rowan-Robinson et
al. (1987),
25, 60, and 100 µm; and
Rush et al. (1993),
12 and 60 µm. LFs derived from the ISO surveys were
presented by
Xu (2000)
at 15 µm, and by
Serjeant et al. (2001)
at 90 µm. Comparison between the various LFs reveals large
differences, especially at faint luminosities
(Saunders et al. 1990,
Malkan & Stecker
2001),
which can result from bias due to large overdensities (the local Virgo
supercluster) in the sample or due to different functional forms used to
fit the data.
(Rieke & Lebofsky
1986,
Soifer et al. 1987,
Isobe & Feigelson
1992).
Functional forms and parameters for the infrared LF derived from the
IRAS survey were presented by
Fang et al. (1998), 12
µm;
Shupe et al. (1998),
25 µm;
Soifer et al. (1986,
1987),
60 µm;
Yahil et al. (1991),
60 µm;
Lawrence et
al. (1986), 60 µm;
Saunders et al. (1990),
60 µm;
Rowan-Robinson et
al. (1987),
25, 60, and 100 µm; and
Rush et al. (1993),
12 and 60 µm. LFs derived from the ISO surveys were
presented by
Xu (2000)
at 15 µm, and by
Serjeant et al. (2001)
at 90 µm. Comparison between the various LFs reveals large
differences, especially at faint luminosities
(Saunders et al. 1990,
Malkan & Stecker
2001),
which can result from bias due to large overdensities (the local Virgo
supercluster) in the sample or due to different functional forms used to
fit the data.
Using infrared observations of galaxies in the local universe, one can
construct a library of galactic spectra that is consistent with the
observational constraints. The spectra need to include the emission from
the unidentified infrared bands (UIB) at 3.3, 6.2, 7.7, 8.6, 11.3, and
12.7 µm and the 9.7 and 18 µm silicate
absorption bands ubiquitously seen in the Galactic ISM and in the
spectra of external galaxies
(Allamandola et
al. 1985,
Roche et al. 1991,
Lutz et al. 1996,
Helou et al. 2000,
Genzel & Cesarsky
2000,
Sturm et al. 2000).
They also need to be consistent with the observed trend of increasing
S(60 µm) / S(100 µm) and decreasing
S(12 µm) / S(25 µm) flux ratios with
increasing infrared luminosity
(Soifer & Neugebauer
1991). SEDs consistent with these color trends can be constructed
from a linear combination of several distinct emission components:
(a) a cirrus component, representing the emission from dust and
UIB carriers, the latter most commonly identified with polycyclic
aromatic hydrocarbon molecules residing in the diffuse atomic phase of
the ISM and heated by the general interstellar radiation field;
(b) a cold dust component representing the emission from dust
residing in molecular clouds; and (c) an H II or starburst
emission component, representing the emission from dust residing in H II
regions and heated by the ionizing radiation field. An additional AGN
component may be needed to represent the spectra of some of the most
luminous infrared galaxies. Using this simple procedure with two or more
emission components, one can reproduce the fluxes and colors of IRAS
galaxies with luminosities ranging from normal (L ~
108.5
L) to
the most luminous (L ~ 1013
L)
galaxies
(Rowan-Robinson &
Crawford 1989,
Beichman & Helou
1991,
Pearson &
Rowan-Robinson 1996,
Guiderdoni et
al. 1998,
Dwek et al. 1998,
Malkan & Stecker 1998,
2001,
Xu et al. 1998,
Rowan-Robinson 2001,
Dale et al. 2001,
Helou 2001).
Number counts predicted by no-evolution models are often used as
benchmarks with which observations are compared. In general, the
predicted counts are much lower than the observed number counts,
requiring abandonment of the simple assumptions made in these
models. For example, ISO deep surveys show strong evolution in galaxy
number counts compared with no-evolution model predictions at 12
µm
(Clements et al. 1999),
15 µm
(Oliver et al. 1997,
Elbaz et al. 1999,
Altieri et al. 1999,
Xu 2000), 90
µm
(Matsuhara et al. 2000),
and 175 µm
(Puget et al. 1999,
Matsuhara et al. 2000).
Evolution can be introduced into BE models as pure luminosity evolution,
manifested as a global scaling of galaxy spectra as a function of
redshift, or as pure density evolution, manifested as a change in the
comoving number density of galaxies with redshift. The evolution is
usually characterized by a (1 +
z) dependence of the evolving quantity, with values of
that can
vary with redshift. Models using functional forms to characterize the
luminosity or density evolution and models that combine both types of
evolution are summarized by
Lonsdale (1996).
dependence of the evolving quantity, with values of
that can
vary with redshift. Models using functional forms to characterize the
luminosity or density evolution and models that combine both types of
evolution are summarized by
Lonsdale (1996).
It is difficult to establish a unique interpretation of differences
between observed and predicted number counts in shallow surveys because
of the coupling between the effects of luminosity and density
evolution. Number counts to sufficient depth can be affected by the
presence of spectral features. The UIB features, for example, can move
in and out of the survey band with redshift
(Xu et al. 1998),
as is the case with the ISOCAM observations of the HDF
(Aussel et al. 1999).
This aspect has been used by
Xu (2000)
to discriminate between luminosity and density evolution effects in
modeling the 15 µm number counts. The ISOCAM data suggest
luminosity evolution with
= 4.5,
strongly ruling out pure density evolution. The presence of very
luminous infrared galaxies at z > 2 also cannot be reproduced
by pure density evolution models
(Blain et al. 1999a).
In the model of Xu, and luminosity evolution models in general, all galaxies are assumed to evolve. A more reasonable scenario is one in which only a fraction of the galaxies evolve or, alternatively, a fraction of the nonevolving galaxy population undergoes a short-lived starburst phase. Such a more realistic evolutionary scenario was presented by Tan et al. (1999). In the Tan et al. model, galaxies are explicitly divided into two distinct components: a disk component and a starburst component representing galaxies undergoing mergers or strong tidal interactions. Parameters of the LF differ for the two components and are evolved backward in time following distinct, observationally and physically motivated prescriptions. For example, the density of the starburst component is assumed to evolve in proportion to the collision rate between galaxies.
The model of Rowan-Robinson (2001) uses a parametric approach to characterize the CSFR. It includes four spectral components (cirrus, M 82 and Arp 220 type starbursts, and AGN dust torus) to characterize the CIB sources, and an evolving 60 µm luminosity function, to create the needed mix of sources as a function of redshift. The parameters are determined by fitting the local IRAS color-luminosity relation, the 60, 175, and 850 µm number counts and the 140 to 750 µm CIB spectrum. The model predicts source counts at optical, near- and mid-infrared wavelengths. It also predicts the EBL spectrum and the contributions of each of the four components from UV to submillimeter wavelengths.
Figure 7 compares the EBL predicted by
representative BE models with current EBL observations. The
Hacking & Soifer
(1991)
model assumes pure luminosity evolution with
= 3,
zmax = 3, and h = 0.75. The
Beichman & Helou
(1991)
model assumes pure density evolution with
= 2,
zmax = 3, and h = 0.75.
Malkan & Stecker
(1998)
assumed pure luminosity evolution up to a redshift
zflat, with no evolution thereafter up to
zmax = 4, and h = 0.50.
Figure 7 presents their model with
= 3 and
zflat = 2, which gives a background close to
the DIRBE limits.
Blain & Longair
(1993)
adopted h = 0.50 and a single temperature dust spectrum (60 K,
model BL60; or 30 K, model BL30) to characterize the SED of IRAS
galaxies. They used the 60 µm LF of
Saunders et al. (1990)
and assumed pure luminosity evolution with
= 3 up to
redshift z = 2 and a constant luminosity at earlier times.
Rowan-Robinson (2001)
examined the EBL intensity for various cosmological models with h
= 1.0. Figure 7 shows the model for
 M
= 0.3 and
M
= 0.3 and
 = 0.7, as well as the stellar contribution to the
EBL calculated by
Yoshii & Takahara
(1988)
for zmax = 5 and h = 0.50. All of the BE
models shown in Figure 7, except for that of Tan et
al., scale simply with the Hubble constant as
H0-1.
= 0.7, as well as the stellar contribution to the
EBL calculated by
Yoshii & Takahara
(1988)
for zmax = 5 and h = 0.50. All of the BE
models shown in Figure 7, except for that of Tan et
al., scale simply with the Hubble constant as
H0-1.
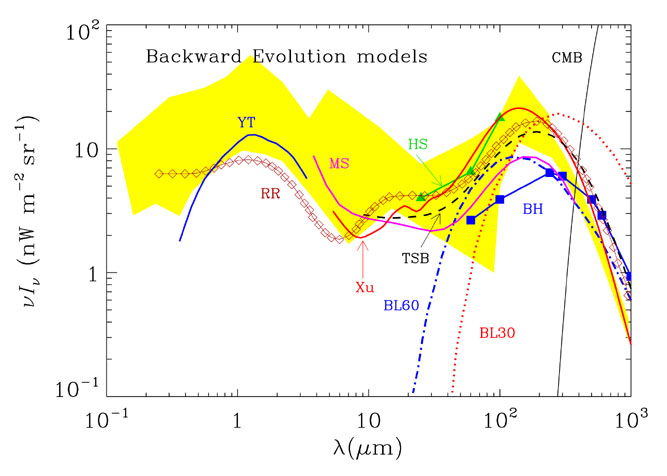 |
Figure 7. Extragalactic background light (EBL) predicted by backward evolution models. (Solid triangles) HS, Hacking & Soifer (1991); (solid squares) BH, Beichman & Helou (1991); (purple line) MS, Malkan & Stecker (1998); (red dotted line) BL30 and (blue dash-dot line) BL60, Blain & Longair (1993); (solid red line) Xu, Xu (2000); (black dashed line) TSB, Tan et al. (1999); (open diamonds) RR, Rowan-Robinson (2001); (blue solid line) YT, Yoshii & Takahara (1988). (Shaded region) The EBL limits defined by the data in Figure 5. See details in Section 5.2.1. |
The models in Figure 7 produce roughly similar values for the far-infrared background. The Blain & Longair 30 K dust model, and to a lesser extent the Beichman & Helou model, clearly overproduce the CIB at far-infrared wavelengths. The models of Blain & Longair, Hacking & Soifer, Beichman & Helou, and Malkan & Stecker were published before the COBE detections and, except for the latter model, did not attempt to predict the mid-infrared background. All models that calculate the mid-infrared spectrum of the CIB give similar results. The models of Xu and Rowan-Robinson include a broad spectral feature, representing the cumulative redshifted UIB emission features.
The main advantage of BE models is that they are simple and offer a quick comparison of observations with predicted galaxy number-magnitude, number-redshift, color-magnitude, and other relations. Their main disadvantage is that they are not constrained by the physical processes, such as star and metal formation or radiative transfer processes, that go on in the galaxies they represent.
5.2.2. FORWARD EVOLUTION MODELS
Some of the shortcomings of BE models are corrected in forward evolution
(FE) models. At the heart of these models is a spectral evolution code
that evolves stellar populations and calculates the stellar, gas, and
metallicity content and SED of a galaxy as a function of time starting
at the onset of star formation. These models were pioneered by
Tinsley (1974)
and are now widely used to model and date the SED of globular clusters
and various galaxy types
(Leitherer et
al. 1996,
and references therein;
Fioc & Rocca-Volmerange
1997,
Jimenez & Kashlinsky
1999).
Model input parameters include a prescription for the star formation
rate, the stellar IMF, and the chemical evolution. The models rely on a
wide range of computational and observational data sets, such as stellar
evolutionary tracks, libraries of observed and calculated stellar
atmospheres, stellar nucleosynthesis yields, and the observed luminosity
functions of galaxies. Models are then set in a cosmological framework
by specifying the values of H0,
M,
and . Assuming an initial formation epoch, these
parameters are used to map the temporal evolution of galaxies into
redshift space, allowing direct comparison of the model predictions with
observations. Model parameters are adjusted to match the galaxy number
counts, spectral energy distribution, colors, and metallicity as a
function of redshift. In this sense, FE models are essentially fancy BE
models that allow for a consistent "backward" evolution of galaxy
parameters with time.
To predict the CIB at wavelengths larger than a few microns with FE models, spectral and chemical evolution models must be generalized to include the effects of dust on the scattering, absorption, and thermal reradiation of starlight. They must also allow for the possible evolution of the dust abundance, composition, size distribution, and other characteristics that may affect their optical properties (Franceschini 2001, Dwek 2001). The single most important factor that determines the emerging UV to far-infrared spectrum of galaxies is their opacity, which depends on the distribution of the dust relative to the radiation sources. Models for different geometries of emitters and absorbers have been constructed by many authors. They range in complexity from simple analytical prescriptions for the evolution of dust opacity (Guiderdoni & Rocca-Volmerange 1987, Mazzei et al. 1994, Franceschini et al. 1994, Wang & Heckman 1996, Guiderdoni et al. 1998), to simple radiative transfer models consisting of a uniform distribution of emitters and absorbers in various geometric configurations (Disney et al. 1989, Calzetti et al. 1994, Dwek & Városi 1996, Devriendt et al. 1999), to more complex models consisting of a clumpy distribution of absorbers and a mix of uniformly distributed and partially embedded sources (Witt & Gordon 1996, Silva et al. 1998, Városi & Dwek 1999, Devriendt et al. 1999, Misselt et al. 2001, Efstathiou et al. 2000).
To determine the cumulative spectral contribution of galaxies to the EBL, models must be able to follow the evolution of the opacity and the reradiated infrared spectrum with redshift. Most models simply assume that the opacity is proportional to the metallicity of the gas to some power and adopt an extinction law to characterize its wavelength dependence. In general, models adopt a Galactic extinction law (Mazzei et al. 1994), or an LMC extinction law for high redshift and presumably low metallicity galaxies (Calzetti & Heckman 1999), or an interpolation between the two laws, reflecting the evolution of galaxy metallicity (Guiderdoni et al. 1998). Detailed models show that the dust composition, and hence the dust extinction law, should depend on the evolution of the dust-forming sources, such as carbon stars, OH/IR stars, and supernovae (Dwek 1998, Todini & Ferrara 2001). Evolutionary effects on dust composition are most important in pristine starburst galaxies, and less so in spiral galaxies (Dwek et al. 2000, Dwek 2001).
Figure 8 presents the CIB predictions of
selected FE models. The solid triangles represent the model of
Franceschini et
al. (1994).
The lines marked UVO, ED, and RR show the models of
Dwek et al. (1998)
for three distinct cosmic star formation histories. The UVO spectrum was
calculated for the UV-optically determined CSFR of
Madau et al. (1998)
and falls short of providing the total EBL intensity and the detected
140 and 240 µm fluxes. The spectra marked RR and ED were
calculated for a CSFR in which a significant fraction of the star
formation was assumed to take place behind a veil of dust. Both spectra
are consistent with the FIRAS CIB measurements, illustrating that the
far-infrared CIB spectrum alone does not uniquely determine the
CSFR. The curve marked CH shows the model prediction of
Calzetti & Heckman
(1999).
Realizing that the CSFR cannot be reliably deduced from UV observations
of heavily obscured galaxies, they developed a special method for
reconstructing the intrinsic star formation rate of galaxies as a
function of redshift. The procedure did not provide a unique
solution. One class of solutions required a large attenuation correction
in the UV-determined CSFR at high redshift and produced a background
intensity consistent with the current limits on the CIB.
Calzetti & Heckman
(1999)
characterized the reradiated infrared emission by a single 20 K
temperature blackbody with a
-2
emissivity law. Their model provides therefore no estimate of the CIB at
mid-infrared wavelengths.
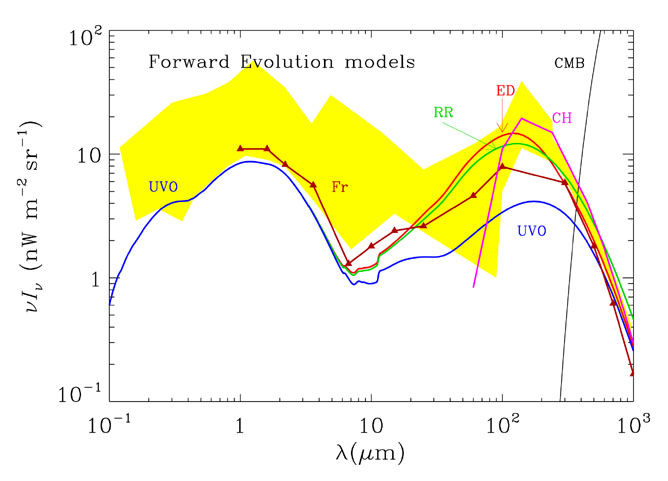 |
Figure 8. Extragalactic background light (EBL) predicted by forward evolution models: (solid triangles) Fr, Franceschini et al. (1994); (solid violet line) CH, Calzetti & Heckman (1999); (red, green, blue solid lines), ED, RR, UVO, respectively, Dwek et al. (1998). (Shaded region) The EBL limits defined by the data in Figure 5. See details in Section 5.2.2. |
Forward evolution models are successful in fitting the SEDs of individual galaxies, galaxy number counts in select bands, and, as shown in Figure 8, the general characteristics of the EBL. However, a serious disadvantage of FE models is the assumption of monolithic star formation. In these models, galaxies form at the same time and evolve quiescently. The models do not provide for galaxy interactions, stochastic changes in the star formation rate, or morphological evolution of galaxies. In particular, these models fail to match the 850 µm galaxy number counts without including a new population of ultraluminous infrared galaxies. Such galaxies must be introduced in an ad hoc fashion in these models.
Some shortcomings of the FE models can be addressed in part by using semianalytical (SA) models for structure formation to predict the observable characteristics of galaxies and the intensity and spectrum of the EBL. SA models provide a useful formalism for studying the development of galaxies and clusters of galaxies in a hierarchical scenario for galaxy formation (for a review, see Cole et al. 2000).
Semianalytical models must consider numerous physical processes in order to reproduce observable galaxy properties. These include the cooling of the gas that falls into the halos, a prescription for the formation of stars, a feedback mechanism that modulates the star formation efficiency, a stellar IMF, and a star formation efficiency during merger events. In addition, SA models require the standard stellar spectral evolution and chemical evolution models that are used in FE models. The models contain numerous adjustable parameters to match the observed properties of galaxies in the local universe (White & Frenk 1991, Kauffmann et al. 1993, Cole et al. 1994, Somerville & Primack 1999).
The use of SA models does not solve any of the fundamental problems associated with calculating the extinction and SED of galaxies. These quantities depend on dust parameters, on the geometry of emitters and absorbers, and on the evolution of these properties, none of which are provided by the models. The main advantage of SA models is that, in spite of the many adjustable parameters, they provide a physical approach to the formation and evolution of galaxies. In particular, SA models decompose the overall cosmic star formation rate into two distinct components, a quiescent one representing the formation of stars in galactic disks, and a stochastic one representing the contribution from bursts of star formation during major galaxy interaction or merging events. Because such interactions are expected to be more common at high redshift, SA models should naturally be able to reproduce the SCUBA source counts, while maintaining the fits to the optical and near-infrared number counts. The SCUBA sources are presumably the high-redshift counterparts of local ultraluminous infrared galaxies, most of which are mergers. In practice, most SA models need to introduce an additional starburst component, or push model parameters to their limit, in order to fit the ISO 175 and SCUBA 850 µm number counts (Guiderdoni et al. 1998, Devriendt & Guiderdoni 2000). Blain et al. (1999a) found that to fit these number counts, starburst and AGN activity generated by mergers must proceed more efficiently and rapidly as redshift increases.
Figure 9 shows several models that use the SA approach to calculate the EBL spectrum. The models of Devriendt & Guiderdoni (2000), Primack et al. (1999) use a three-component dust model (Section 5.2.1) to characterize the dust emission, although the EBL spectrum of the latter authors shows no evidence of the spectral discontinuities expected from the presence of UIB features. The Blain et al. (1999a) model in Figure 9 was calculated for a single-temperature dust spectrum of 35 K, which provided the best fit to the far-infrared number counts. It is, therefore, not expected to provide a realistic EBL spectrum at mid-infrared wavelengths.
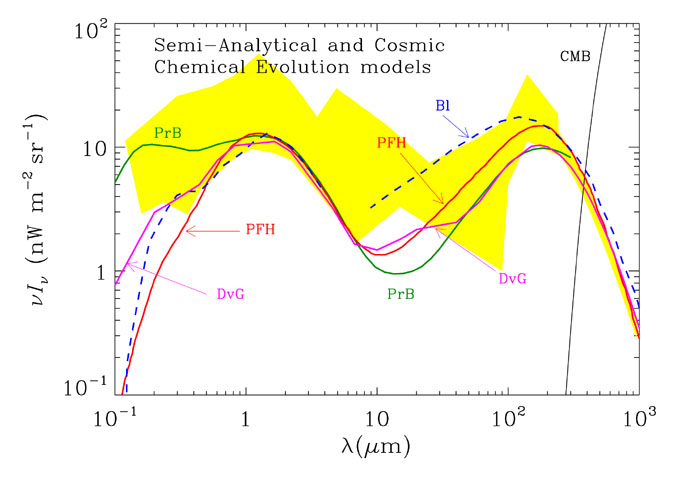 |
Figure 9. Extragalactic background light (EBL) predicted by models. Semi-analytical: (green line) PrB, Primack et al. (1999); (violet line) DvG, Devriendt & Guiderdoni (2000); (dashed blue line) Bl, Blain et al. (1999a). Cosmic chemical evolution: PFH, Pei et al. (1999). (Shaded region) The EBL limits defined by the data in Figure 5. See details in Section 5.2.3 and Section 5.2.4. |
Semianalytical models incoporate a wide variety of physical processes to predict observed galaxy properties. In spite of their successes, there remain some discrepancies between model predictions and observations. The origins of these discrepancies are often difficult to trace because of the inherent complexity of the models. Approximations used in describing the physical processes, uncertainties in the input data, and fundamental shortcomings of the approach could all contribute to the discrepancies.
5.2.4. COSMIC CHEMICAL EVOLUTION MODELS
Because the EBL is an integrated measure of cosmic activity, summed over time and over the wide variety of processes and systems that have populated the universe, it can only inform us about global characteristics of cosmic history. A modeling approach that deals with average properties of the universe rather than the many complex details involved would most naturally, and perhaps most informatively, relate to the background radiation. Cosmic chemical evolution (CCE) models use just such an approach, relating in a self-consistent way the time history of a few globally averaged properties of the universe. The great advantages of the CCE approach are its global nature and intrinsic simplicity. CCE models provide a picture of the evolution of the mean density of stars, interstellar gas, metals, and radiation averaged over the entire population of galaxies in a large comoving volume element. Inputs to the models are tracers of stellar activity (emitted light) and tracers of the ISM in galaxies (absorbed light). Cosmic chemical evolution equations, analogous to Galactic chemical evolution models (Tinsley 1980, Pagel 1997), are solved to guarantee consistency between the global rates of interstellar gas depletion, star formation, and chemical enrichment. The models do not require detailed knowledge of the complex processes by which galaxies actually form, assemble, and evolve. In particular, CCE models do not need to address explicitly the merger history of galaxies, the central theme in SA models. Because of the global approach, CCE models do not predict galaxy number counts. An informative review of CCE models has recently been presented by Fall (2001).
The CCE models themselves have evolved as available input data have
improved
(Fall & Pei 1993,
Pei & Fall 1995,
Fall et al. 1996,
Pei et al. 1999).
In the most recent version
(Pei et al. 1999),
primary inputs were the mean rest-frame UV emissivity as a function of
redshift, as determined in recent deep optical surveys, and the ISM
content of galaxies, as traced by H I column density determined from
quasar absorption line studies through damped
Ly systems (absorbers
with H I column density NHI > 1020
cm-2). Spectral synthesis models were used to calculate the
spectral energy density of starlight at each redshift, as done in FE
models. The LMC extinction law was adopted to calculate the
opacity of
grains and, hence, determine the fraction of absorbed starlight at each
redshift. One important property not provided by the quasar absorption
line observations is the distribution of dust temperatures along the
line of sight. A power law distribution of grain temperatures, which
fits the local infrared luminosity density, was adopted to approximate
the infrared emission spectrum of real galaxies. The DIRBE and FIRAS CIB
measurements from 140-1000 µm were used as an input to
determine a dust clumping parameter in the model. This established the
relative amount of background light a short wavelengths (optical-near
infrared) and long wavelengths (far-infrared). The model then yielded
the detailed shape of the EBL spectrum. The model determined a
self-consistent solution for the extinction corrected comoving rate of
star formation as a function of redshift, which is consistent with that
inferred from recent
H, SCUBA, and ISO 15
µm observations. The model successfully reproduced numerous
observations not used as input, including (a) the comoving
rest-frame optical (0.44 µm) and near-infrared (1.0 and 2.2
µm) spectral luminosity densities in the z
systems (absorbers
with H I column density NHI > 1020
cm-2). Spectral synthesis models were used to calculate the
spectral energy density of starlight at each redshift, as done in FE
models. The LMC extinction law was adopted to calculate the
opacity of
grains and, hence, determine the fraction of absorbed starlight at each
redshift. One important property not provided by the quasar absorption
line observations is the distribution of dust temperatures along the
line of sight. A power law distribution of grain temperatures, which
fits the local infrared luminosity density, was adopted to approximate
the infrared emission spectrum of real galaxies. The DIRBE and FIRAS CIB
measurements from 140-1000 µm were used as an input to
determine a dust clumping parameter in the model. This established the
relative amount of background light a short wavelengths (optical-near
infrared) and long wavelengths (far-infrared). The model then yielded
the detailed shape of the EBL spectrum. The model determined a
self-consistent solution for the extinction corrected comoving rate of
star formation as a function of redshift, which is consistent with that
inferred from recent
H, SCUBA, and ISO 15
µm observations. The model successfully reproduced numerous
observations not used as input, including (a) the comoving
rest-frame optical (0.44 µm) and near-infrared (1.0 and 2.2
µm) spectral luminosity densities in the z
 0-2 redshift
interval; (b) the 12, 25, 60, and 100 µm luminosity
densities in the local universe; and (c) the mean abundance of
heavy elements in damped
Ly systems for z
0.4 - 3.5.
0-2 redshift
interval; (b) the 12, 25, 60, and 100 µm luminosity
densities in the local universe; and (c) the mean abundance of
heavy elements in damped
Ly systems for z
0.4 - 3.5.
Figure 9 compares the EBL spectrum predicted by the Pei et al. (1999) model with current measurements. The model clearly yields a double-peaked spectral energy distribution, with nearly equal energy in the short- and long-wavelength peaks. This is consistent with the far-infrared and UV-optical emissivity data used as input to the model, although it clearly falls short of the recently reported UV-optical and near-infrared measurements. The very low levels predicted in the mid-infrared are still consistent with observations.
We have described a broad range of models, developed with different objectives and levels of detail. The value of the different approaches cannot be judged solely by their ability to reproduce the EBL measurements, since many were not primarily designed for that purpose. The astrophysical input data evolve rapidly, causing even models that use the same approach to differ simply because they were produced at different times. Nevertheless, most models described above yield roughly similar CIB spectra from ~ 5-1000 µm [Figures 7, 8 and 9]. The fundamental reason for this similarity is that most models incorporate similar cosmic star formation histories. BE models implicitly assume a rising CSFR up to z ~ 1-1.5, with a nearly constant rate at earlier times. FE and SA models attempt to reproduce the same characteristic CSFR in order to fit number counts or comoving spectral luminosity densities at different redshifts. Galaxy SEDs, another important ingredient in modeling the CIB, are based on locally observed galaxy spectra. Simple models, even single temperature dust emission models, can reproduce the far-infrared and submillimeter background but are less realistic in the mid-infrared and at shorter wavelengths. More complex models differ in the mix of galaxy types used at a given redshift and in their treatment of the mid-infrared emission.
Large differences between models occur in the UV-optical spectral range. In general, BE models do not include the physical processes that link the CIB and the UV-optical spectrum. Those BE models that do include the UV-optical range accomplish this by incorporating template spectra. Other models arrive at a double-peaked EBL spectrum because they explicitly include the absorption of starlight and reemission by dust.
What is apparent in all of these modeling efforts is that background measurements provide important constraints, highlighting deficiencies or weaknesses in some, requiring tuning in others. As the background measurements continue to improve, they will move us further along toward a consistent picture of the formation of structure, metals, and background light.