


I begin with a short review of the basic observed properties of GRBs. This review is brief as a complete review requires a whole paper by itself. I refer the reader to several review papers for a detailed summary of the observations [98, 119, 177, 416]. I divide this section to three parts. I begin with the prompt emission - the GRB itself. I continue with properties of the afterglow. I conclude with a discussion of the rates of GRBs, the location of the bursts within their host galaxies and the properties of the host galaxies.
I begin with a discussion of the GRB itself, namely the
 -rays and
any lower-energy emission that occurs simultaneously with them.
This includes X-ray emission that generally accompanies the
-ray
emission as a low energy tail. In some cases, called
X-ray flashes (XRFs), the
-rays
signal is weak and all that we have is
this X-ray signal. Prompt (operationally defined as the time period
when the -ray
detector detects a signal above background)
longer-wavelength emission may also occur at the optical and radio
but it is harder to detect. However, so far optical flashes was
observed In three cases
[2,
101,
216]
simultaneously with the
-ray emission.
-rays and
any lower-energy emission that occurs simultaneously with them.
This includes X-ray emission that generally accompanies the
-ray
emission as a low energy tail. In some cases, called
X-ray flashes (XRFs), the
-rays
signal is weak and all that we have is
this X-ray signal. Prompt (operationally defined as the time period
when the -ray
detector detects a signal above background)
longer-wavelength emission may also occur at the optical and radio
but it is harder to detect. However, so far optical flashes was
observed In three cases
[2,
101,
216]
simultaneously with the
-ray emission.
The spectrum is non thermal. The energy flux peaks at a few
hundred keV and in many bursts there is a long high energy tail
extending in cases up to GeV. The spectrum varies strongly from
one burst to another. An excellent phenomenological fit for the
spectrum was introduced by Band et al.
[14]
using two power laws joined smoothly at a break energy
( -
-
 )
E0:
)
E0:
 |
(1) |
I denote the spectral indices here as
and
to
distinguish them from the afterglow parameters
( and
and
 ) discussed
later. There is no particular theoretical
model that predicts this spectral shape. Still, this function
provides an excellent fit to most of the observed spectra. For
most observed values of
and
,
) discussed
later. There is no particular theoretical
model that predicts this spectral shape. Still, this function
provides an excellent fit to most of the observed spectra. For
most observed values of
and
,
 F
F
 2
N() peaks at
Ep =
( +
2)E0.
For about 10% of the bursts the upper slope is larger than -2 and
there is no peak for
F within the
observed spectrum. Another group of bursts, NHE bursts, (no high energy)
[296]
does not have a hard component (which is
reflected by a very negative value of
).
The "typical" energy of the observed radiation is Ep.
Ep
defined in this way should not be confused with the commonly used
hardness ratio which is the ratio of photons observed in two BATSE
1 channels: Channel 3
(100-300 keV) counts divided by Channel 2
(50-100 keV) counts. The break frequency and the peak flux
frequencies are lower on average for bursts with lower observed
flux [246,
247].
2
N() peaks at
Ep =
( +
2)E0.
For about 10% of the bursts the upper slope is larger than -2 and
there is no peak for
F within the
observed spectrum. Another group of bursts, NHE bursts, (no high energy)
[296]
does not have a hard component (which is
reflected by a very negative value of
).
The "typical" energy of the observed radiation is Ep.
Ep
defined in this way should not be confused with the commonly used
hardness ratio which is the ratio of photons observed in two BATSE
1 channels: Channel 3
(100-300 keV) counts divided by Channel 2
(50-100 keV) counts. The break frequency and the peak flux
frequencies are lower on average for bursts with lower observed
flux [246,
247].
Band et al. [14] present a small catalogue of the spectra of 52 bright bursts which they analyze in terms of the Band function. Preece et al. [323] present a larger catalogue with 156 bursts selected for either high flux or fluence. They consider several spectral shape including the Band function.
Fig. 1 shows the distribution of
observed values of the break energy,
( -
)
E0, in a sample of bright bursts
[323].
Most of the bursts are the range 100 keV <
( -
)
E0 < 400 keV, with a clear
maximum in the distribution around
( -
)
E0 ~ 250 keV. There are not many
soft GRBs - that is, GRBs with peak energy in the tens of keV
range. However, the discovery
[164]
of XRFs - X-ray flashes
with similar temporal structure to GRBs but lower typical energies
- shows that the low peak energy cutoff is not real and it
reflects the lower sensitivity of BATSE in this range
[189].
 |
Figure 1. Distribution of
the observed values of the break energy
( |
Similarly, it is debatable whether there is a real paucity in hard GRBs and there is an upper cutoff to the GRB hardness or it just happens that the detection is optimal in this (a few hundred keV) band. BATSE triggers, for example, are based mostly on the count rate between 50 keV and 300 keV. BATSE is, therefore, less sensitive to harder bursts that emit most of their energy in the MeV range. Using BATSE's observation alone one cannot rule out the possibility that there is a population of harder GRBs that emit equal power in total energy which are not observed because of this selection effect [55, 166, 221, 313]. More generally, a harder burst with the same energy as a soft one emits fewer photons. Furthermore, the spectrum is generally flat in the high energy range and it decays quickly at low energies. Therefore it is intrinsically more difficult to detect a harder burst. A study of the SMM (Solar Maximum Mission) data [158] suggests that there is a deficiency (by at least a factor of 5) of GRBs with hardness above 3 MeV, relative to GRBs peaking at ~ 0.5 MeV, but this data is consistent with a population of hardness that extends up to 2 MeV.
Overall the narrowness of the hardness distribution is very puzzling. First, as I stressed earlier it is not clear whether it is real and not a result of an observational artifact. If it is real then on one hand there is no clear explanation to what is the physical process that controls the narrowness of the distribution (see however Guetta et al. [154]). On the other hand cosmological redshift effects must broaden this distribution and it seem likely (but not demonstrated yet) that if the GRB distribution extends to z = 10 as some suggest [43, 52, 208, 223] then such a narrow distribution requires an intrinsic correlation between the intrinsic hardness of the burst and its redshift, namely that the intrinsic hardness increases with the redshift. There is some evidence for such a correlation between Ep and the observed peak flux [246, 247]. More recently Amati et al. [15] reported on a correlation between Ep and the isotropic equivalent energy seen in 12 BeppoSAX bursts that they have analyzed. They also report on a correlation between Ep and the redshift as, the bursts with higher isotropic equivalent energy are typically more distant. These three different correlations are consistent with each other if the observed peak flux of bursts is determined by their intrinsic luminosity more than by the distance of the bursts. In such a case (because of the larger volume at larger distances) the observed more distant bursts are on average brighter than nearer ones (see also Section IIC).
Even though the burst hardness distribution shows a single population a
plot of the
hardness vs temporal duration shows that short bursts (see
Fig. 4) are typically harder
[79,
97].
The correlation is significant.
Another interesting sub-group of bursts is the NHE (no high
energy) bursts - bursts with no hard component that is no emission
above 300 keV
[296].
This group is characterized by a large negative value of
, the high
energy spectral
slope. The NHE bursts have luminosities about an order of
magnitude lower than regular bursts and they exhibit an
effectively homogeneous intensity distribution with
<V / Vmax> = 0.53 ± 0.029. As I
discuss later in
Section IIA2 most GRB light curves are
composed of many individual pulses. It is interesting that in many
bursts there are NHE pulses combined with regular pulses.
EGRET (The Energetic Gamma Ray Experiment Telescope) the high
energy -rays
detector on Compton - GRO detected seven GRBs with
photon energies ranging from 100 MeV to 18 GeV
[80].
In some cases this very high energy emission is delayed more than
an hour after the burst
[172,
392].
No high-energy cutoff above a few MeV has been observed in any GRB spectrum.
Recently, [130]
have combined the BATSE (30 keV - 2 Mev)
data with the EGRET data for 26 bursts. In one of these bursts,
GRB 941017 (according to the common notation GRBs
are numbered by
the date), they have discovered a high energy tail that extended
up to 200 MeV and looked like a different component. This high
energy component appeared 10-20 sec after the beginning of the
burst and displayed a roughly constant flux with a relatively hard
spectral slope
(F
0) up to 200
sec. At late time
(150 after the trigger) the very high energy (10-200 MeV) tail
contained 50 times more energy than the "main"
-rays energy
(30 keV - 2 MeV) band. The TeV detector, Milagrito, discovered (at a
statistical significance of 1.5e-3 or so, namely at
3 ) a
TeV signal coincident with GRB 970417
[9,
10].
If true this would correspond to a TeV fluence that exceeds the low energy
-rays
fluence. However no further TeV signals were discovered from other 53
bursts observed by Milagrito
[9]
or from several bursts observed by the more sensitive Milagro
[252]. One
should recall however, that due to the attenuation of the IR
background TeV photons could not be detected from z > 0.1. Thus
even if most GRBs emit TeV photons those photons won't be detected
on Earth.
) a
TeV signal coincident with GRB 970417
[9,
10].
If true this would correspond to a TeV fluence that exceeds the low energy
-rays
fluence. However no further TeV signals were discovered from other 53
bursts observed by Milagrito
[9]
or from several bursts observed by the more sensitive Milagro
[252]. One
should recall however, that due to the attenuation of the IR
background TeV photons could not be detected from z > 0.1. Thus
even if most GRBs emit TeV photons those photons won't be detected
on Earth.
Another puzzle is the low energy tail. Cohen et al.
[55]
analyze several strong bursts and find that their low energy slope
is around 1/3 to -1/2. However, Preece et al.
[321,
322]
suggest that about 1/5 of the bursts have a the low energy power
spectrum, , steeper than
1/3 (the synchrotron slow
cooling low energy slope). A larger fraction is steeper than -1/2
(the fast cooling synchrotron low energy slope). However, this is
not seen in any of the HETE spectrum whose low energy resolution
is somewhat better. All HETE bursts have a low energy spectrum
that is within the range 1/3 and -1/2
[16].
As both BATSE and HETE use NaI detectors that have a poor low energy
resolution [55],
this problem might be resolved only when a better low energy
spectrometer will be flown.
The duration of the bursts spans five orders, ranging from less
than 0.01 sec to more than 100 sec. Common measures for the duration
are T90 (T50) which correspond to
the time in which 90%
(50%) of the counts of the GRB arrives. As I discuss below (see
Section IIA3) the bursts are divided to long and
short bursts
according to their T90. Most GRBs are highly variable,
showing 100% variations in the flux on a time scale much shorter
than the overall duration of the burst. Fig 2
depicts the light curve of a typical variable GRB (GRB 920627).
The variability time scale,
 t, is determined
by the width of the peaks.
t is much shorter
(in some cases by a more
than a factor of 104) than T, the duration of the burst.
Variability on a time scale of milliseconds has been observed in
some long bursts
[251,
270].
However, only ~ 80% of the bursts show substantial substructure in
their light curves. The rest are rather smooth, typically with a
FRED (Fast Rise Exponential Decay) structure.
t, is determined
by the width of the peaks.
t is much shorter
(in some cases by a more
than a factor of 104) than T, the duration of the burst.
Variability on a time scale of milliseconds has been observed in
some long bursts
[251,
270].
However, only ~ 80% of the bursts show substantial substructure in
their light curves. The rest are rather smooth, typically with a
FRED (Fast Rise Exponential Decay) structure.
Fenimore and Ramirez-Ruiz [95] (see also Reichart et al. [341]) discovered a correlation between the variability and the luminosity of the bursts. This correlation (as well as the lag-luminosity relation discussed later) allow us to estimate the luminosity of bursts that do not have a known redshift.
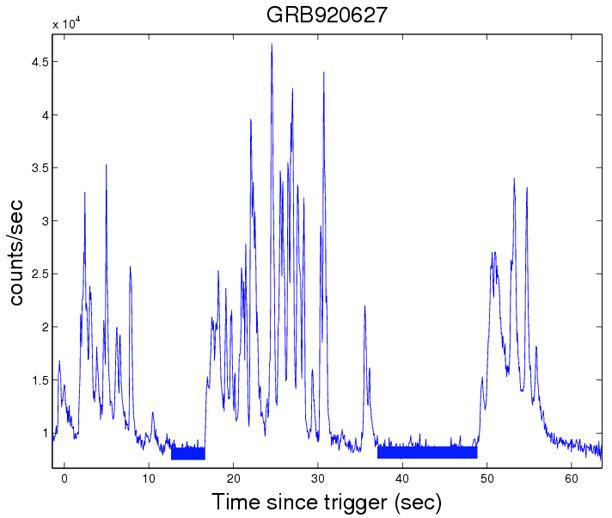 |
Figure 2. The light curve of GRB 920627. The total duration of the burst is 52 sec, while typical pulses are 0.8 sec wide. Two quiescent periods lasting ~ 10 seconds are marked by horizontal solid bold lines. |
The bursts seem to be composed of individual pulses, with a pulse being the "building blocks" of the overall light curve. Individual pulses display a hard to soft evolution with the peak energy decreasing exponentially with the photon fluence [99, 218, 281]. The pulses have the following temporal and spectral features. (i) The light curve of an individual pulse is a FRED - fast rise exponential decay - with an average rise to decay ratio of 1:3 [281]. (ii) The low energy emission is delayed compared to the high energy emission 2 [281]. Norris et al. [280] have found that these spectral lags are anti-correlated with the luminosity of the bursts: Luminous bursts have long lags. This lag luminosity relation provides another way to estimate the luminosity of a burst from its (multi-spectra) light curve. (iii) The pulses' low energy light curves are wider compared to the high energy light curves. The width goes as ~ E-0.4 [92]. (iv) There is a Width-Symmetry-Intensity correlation. High intensity pulses are (statistically) more symmetric (lower decay to rise ratio) and with shorter spectral lags [281]. (v) There is a Hardness-Intensity correlation. The instantaneous spectral hardness of a pulse is correlated to the instantaneous intensity (the pulse become softer during the pulse decay) [40].
Both the pulse widths,
t, and the pulse
separation,  t,
have a rather similar log-normal
distributions. However, the pulse separation, distribution,
reveals has an excess of long intervals
[270].
These long intervals can be classified as quiescent periods
[330],
relatively long periods of several
dozen seconds with no activity. When excluding these quiescent
periods both distributions are log-normal with a comparable parameters
[270,
327].
The average pulse interval,
t,
have a rather similar log-normal
distributions. However, the pulse separation, distribution,
reveals has an excess of long intervals
[270].
These long intervals can be classified as quiescent periods
[330],
relatively long periods of several
dozen seconds with no activity. When excluding these quiescent
periods both distributions are log-normal with a comparable parameters
[270,
327].
The average pulse interval,
 t =
1.3 sec is larger by a factor 1.3 then the average pulse width
t =
1.3 sec is larger by a factor 1.3 then the average pulse width
 t = 1
sec. One also finds that
the pulse widths are correlated with the preceding interval
[270].
Ramirez-Ruiz and Fenimore
[328]
found that the pulses' width does not vary along the bursts.
t = 1
sec. One also finds that
the pulse widths are correlated with the preceding interval
[270].
Ramirez-Ruiz and Fenimore
[328]
found that the pulses' width does not vary along the bursts.
One can also analyze the temporal behavior using the traditional Fourier transform method to analyze. The power density spectra (PDS) of light curves shows a power law slope of ~ - 5/3 and a sharp break at 1 Hz [23].
 |
Figure 3. The pulse width distribution (right) and the distribution of intervals between pulses (left) (from [270]). |
The results described so far are for long bursts. the
variability of short (T < 2 sec) bursts is more difficult to
analyze. The duration of these bursts is closer to the limiting
resolution of the detectors. Still most (~ 66%) short
bursts are variable with
t / T <
0.1 [269].
These variable bursts are composed of multiple subpulses.
Long and Short Bursts The clearest classification of bursts is based on their duration. Kouveliotou et al. [198] have shown that GRB can be divided to two distinct groups: long burst with T90 > 2 sec and short bursts with T90 < 2 sec. Note that it was suggested [170, 265] that there is a third intermediate class with 2.5 sec < T90 < 7 sec. However, it is not clear if this division to three classes is statistically significant [156].
An interesting question is whether short bursts could arise from single peaks of long bursts in which the rest of the long burst is hidden by noise. Nakar and Piran [269] have shown that in practically all long bursts the second highest peak is comparable in height to the first one. Thus, if the highest peak is above the noise so should be the second one. Short bursts are a different entity. This is supported by the observation that short bursts are typically harder [79, 197]. The duration-hardness distribution (see Fig. 4) shows clearly that there are not soft short bursts.
 |
Figure 4. The hardness-duration correlation for BATSE bursts. HR is the ratio of fluence between BATSE channels 3 and 2. Squares represent short burst and circle long bursts. The solid line is a regression line for the whole sample. The two dotted lines are the regresions lines for the short and long samples respectively (from [326].) |
The spatial distribution of the observed short bursts is
clearly different from the distribution of the observed long
one. A measure of the spatial distribution is the average ratio
<V / Vmax>
 <(C /
Cmin)-3/2>, where C is the count
rate and Cmin is the
minimal rate required for triggering. In a uniform Eucleadian
sample this ratio equals 0.5 regardless of the luminosity
function. One of the first signs of a cosmological origin of GRBs
was the deviation of this value from 0.5 for the BATSE sample
[256].
The <V / Vmax> of
the BATSE short bursts sample
[186,
248,
307]
is significantly higher than
<V / Vmax> of the long bursts
sample. Note that more recently
[380]
suggested that the two values are similar and the distribution of long
and short bursts is similar. However, Guetta and Piran
[152]
finds <V / Vmax>long = 0.282 and
<V / Vmax>long = 0.390 (I
discuss this point further in
Section IIC3). This implies that the
population
of observed short bursts is nearer on average than the population
of the observed long ones. This is not necessarily a statement on the
location of short vs. the location of long bursts. Instead it
simply reflects the fact that it is more difficult to detect a
short burst. For a short burst one has to trigger on a shorter
(and hence noisier) window the detector (specifically BATSE that
triggers on 64 ms for short bursts and on 1 sec for long ones) is
less sensitive to short bursts. I discuss later, in
Section IIC3, the question of rates of long
vs. short bursts.
<(C /
Cmin)-3/2>, where C is the count
rate and Cmin is the
minimal rate required for triggering. In a uniform Eucleadian
sample this ratio equals 0.5 regardless of the luminosity
function. One of the first signs of a cosmological origin of GRBs
was the deviation of this value from 0.5 for the BATSE sample
[256].
The <V / Vmax> of
the BATSE short bursts sample
[186,
248,
307]
is significantly higher than
<V / Vmax> of the long bursts
sample. Note that more recently
[380]
suggested that the two values are similar and the distribution of long
and short bursts is similar. However, Guetta and Piran
[152]
finds <V / Vmax>long = 0.282 and
<V / Vmax>long = 0.390 (I
discuss this point further in
Section IIC3). This implies that the
population
of observed short bursts is nearer on average than the population
of the observed long ones. This is not necessarily a statement on the
location of short vs. the location of long bursts. Instead it
simply reflects the fact that it is more difficult to detect a
short burst. For a short burst one has to trigger on a shorter
(and hence noisier) window the detector (specifically BATSE that
triggers on 64 ms for short bursts and on 1 sec for long ones) is
less sensitive to short bursts. I discuss later, in
Section IIC3, the question of rates of long
vs. short bursts.
So far afterglow was detected only from long bursts. It is not clear whether this is an observational artifact or a real feature. However, there was no X-ray afterglow observed for the only well localized short hard burst: GRB 020531 [174]. Chandra observations show an intensity weaker by at least a factor of 100-300 than the intensity of the X-ray afterglow from long bursts at a similar time [46]. Afterglow was not observed in other wavelength as well [191]
As identification of hosts and redshifts depend on the detection of afterglow this implies that nothing is known about the distribution, progenitors, environment etc.. of short burst. These bursts are still waiting for their afterglow revolution.
X-ray Flashes (XRFs) are X-ray bursts with a similar temporal structure to GRBs but lower typical energies. XRF discovered these flushes by comparing GRBM (GRB Monitor) with sensitivity above 40 keV and WFC (Wide Field Camera) triggering on BeppoSAX 3. In 39 cases the WFCs were triggered without GRBM triggering implying that these flashed do not have any hard component and most of their flux is in X-ray. The duration of 17 of these transients (out of the 39 transients), denoted X-ray flashes (XRFs), is comparable to the duration of the X-ray emission accompanying GRBs. The peak fluxes of the XRFs are similar to the X-ray fluxes observed during GRBs in the WFCs (~ 10-8 ergs/sec/cm2) but their peak energy is clearly below 40 keV. These finding confirmed the detection of Strohmayer et al. [398] of 7 GRBs with Ep < 10 keV and 5 additional GRBs with Ep < 50 keV in the GINGA data.
Barraud et al. [16] analyze 35 bursts detected on HETE II 4. They find that XRFs lie on the extension of all the relevant GRB distributions. Namely there is a continuity from GRBs to XRFs. Detailed searches in the BATSE data revealed that some of these bursts have also been detected by BATSE [189]. Using the complete search in 90% of the WFC data available, Heise [163] find that the observed frequency of XRFs is approximately half of the GRB-frequency: In 6 years of BeppoSAX observations they have observed 32 XRFs above a threshold peak-luminosity of 5 × 10⁻⁹ erg/s/cm2 in the 2-25 keV range compared with 54 GRBs (all GRBs above BATSE thresholds are observed if in the field of view).
By now Soderberg et al. [389] discovered optical afterglow from XRF 020903 and they suggest that the burst was at z = 0.25. They also suggest a hint of an underlying SN signal (see Section IIC4) peaking between 7-24 days after the initial XRF trigger. Afterglow was discovered from XRF 030723as well [100].
Recently, Coburn and Boggs
[54]
reported on a detection of a very high (
80% ± 20%) linear polarization during the prompt
-ray
emission of GRB 021206. This burst was extremely
powerful. The observed fluence of GRB 021206 was
1.6 . 10-4 ergs / cm2 at the energy
range of 25-100 Kev
[175,
176].
This puts GRB 021206 as
one of the most powerful bursts, and the most powerful one (a
factor of 2-3 above GRB 990123) after correcting for the fact that
it was observed only in a narrow band (compared to the wide BATSE
band of 20-2000 keV). Coburn and Boggs
[54]
analyzed the data
recorded by the Reuven Ramaty High Energy Solar Spectroscopic
Imager (RHESSI). The polarization is measured in this detector by
the angular dependence of the number detection of simultaneous
pairs of events that are most likely caused by a scattering of the
detected
-rays
within the detector. The data data analysis is based
on 12 data points which are collected over 5 sec. Each of these
points is a sum of several independent observations taken at
different times. Thus the data is some kind of convolution of the
polarization over the whole duration of the burst.
Coburn and Boggs
[54]
test two hypothesis. First they test the
null hypothesis of no polarization. This hypothesis is rejected at
a confidence level of 5.7.
Second they estimate the modulation factor assuming a constant
polarization during the
whole burst. The best fit to the data is achieved with
 = (80 ±
20)%. However, Coburn and Boggs
[54]
find that the probability that
= (80 ±
20)%. However, Coburn and Boggs
[54]
find that the probability that
 2 is greater than
the value obtained with
this fit is 5%, namely the model of constant polarization is
consistent with the analysis and observations only at the 5% level.
2 is greater than
the value obtained with
this fit is 5%, namely the model of constant polarization is
consistent with the analysis and observations only at the 5% level.
Rutledge and Fox [359] reanalyzed this data and pointed out several inconsistencies within the methodology of Coburn and Boggs [54]. Their upper limit on the polarization (based on the same data) is ~ 4%. In their rebuttle Boggs and Coburn [39] point out that the strong upper limit (obtained by Rutledge and Fox [359] is inconsistent with the low S/N estimated by these authors. However, they do not provide a clear answer to the criticism of the methodology raised by Rutledge and Fox [359]. This leaves the situation, concerning the prompt polarization from this burst highly uncertain.
The Robotic telescope ROTSE (Robotic Optical Transient Search
Experiment) detected a 9th magnitude optical flash that was
concurrent with the GRB emission from GRB 990123
[2].
The six snapshots begun 40sec after the trigger and lasted until
three minutes after the burst. The second snapshot that took place
60 sec after the trigger recorded a 9th magnitude flash. While the
six snapshots do not provide a "light curve" it is clear that the
peak optical flux does not coincide with the peak
-rays emission
that takes place around the first ROTSE snapshot. This suggests
that the optical flux is not the "low energy tail" of the
-rays
emission. Recently, Fox et al.
[101]
reported on a detection of 15.45 magnitude optical signal from GRB 021004 193 sec after
the trigger. This is just 93 seconds after the 100 sec long burst
stopped being active. Shortly afterwards Li et al.
[216]
reported on a detection of 14.67 magnitude optical signal from
GRB 021211 105 sec after the trigger. Finally, Price
et al.
[324]
detected a 12th magnitude prompt flash, albeit this is more than
1.5 hours after the trigger. Similar prompt signal was not
observed from any other burst in spite of extensive searches that
provided upper limits. Kehoe et al.
[188]
searched 5 bright bursts
and found single-image upper limits ranging from 13th to 14th
magnitude around 10 sec after the initial burst detection and from
14 to 15.8 magnitudes one hour later. These upper limits are
consistent with the two recent detections which are around 15th
mag. The recent events of rapid detection suggest that we should
expect many more such discoveries in the near future.
6. The GRB-Afterglow Transition - Observations
There is no direct correlation between the
-ray fluxes and
the X-ray (or optical) afterglow fluxes. The extrapolation of the
X-ray afterglow fluxes backwards generally does not fit the
-ray
fluxes. Instead they fit the late prompt X-ray signal.
These results are in nice agreement with the predictions of the
Internal - External shocks scenario in which the two phenomena are
produced by different effects and one should not expect a simple
extrapolation to work.
The expected GRB afterglow transition have been observed in several cases. The first observation took place (but was not reported until much latter) already in 1992 [45]. BeppoSAX data shows a rather sharp transition in the hardness that takes place several dozen seconds after the beginning of the bursts. This transition is seen clearly in the different energy bands light curves of GRB 990123 and in GRB 980923 [129]. Connaughton [59] have averaged the light curves of many GRBs and discovered long and soft tails: the early X-ray afterglow. Additional evidence for the transition from the GRB to the afterglow can be observed in the observations of the different spectrum within the GRB [321].
1 BATSE is the Burst and Transient Source Experiment on the CGRO (Compton Gamma-Ray Observatory), see e.g. http://cossc.gsfc.nasa.gov/batse/. It operated for almost a decade detecting several thousand bursts, more than any satellite before or after it. The BATSE data was published in several catalogues see Paciesas et al. [284, 285] for the most recent one Back.
2 Low/high energy implies the low vs. the high BATSE channels. The four BATSE channels at 20-50 keV, 50-100 keV, 100-300 keV and > 300 keV. Back.
3 see http://www.asdc.asi.it/bepposax/ for information on BeppoSAX and its the different instruments. Back.
4 HETE II is a dedicated GRB satellite that aims at locating quickly bursts with high positional accuracy. See http://space.mit.edu/HETE/ for a description of HETE II and its instruments Back.