


B. The Afterglow
Until 1997 there were no known counterparts to GRBs in other wavelengths. On Feb 28 1997 the Italian-Dutch satellite BeppoSAX detected X-ray afterglow from GRB 970228 [60]. The exact position given by BeppoSAX led to the discovery of optical afterglow [415]. Radio afterglow was detected in GRB 970508 [104]. By now more than forty X-ray afterglows have been observed (see http://www.mpe.mpg.de/~jcg/grb.html for a complete up to date tables of well localized GRBs with or without afterglow. Another useful page is: http://grad40.as.utexas.edu/grblog.php). About half of these have optical and radio afterglow (see Fig 8). The accurate positions given by the afterglow enabled the identification of the host galaxies of many bursts. In twenty or so cases the redshift has been measured. The observed redshifts range from 0.16 for GRB 030329 (or 0.0085 for GRB 980425) to a record of 4.5 (GRB 000131). Even though the afterglow is a single entity I will follow the astronomical wavelength division and I will review here the observational properties of X-ray, optical and radio afterglows.
The X-ray afterglow is the first and strongest, but shortest signal. In fact it seems to begin already while the GRB is going on (see Section IIA6 for a discussion of the GRB-afterglow transition). The light curve observed several hours after the burst can usually be extrapolated to the late parts of the prompt emission.
The X-ray afterglow fluxes from GRBs have a power law dependence on
 and on the observed time
t [316]:
f(t)
and on the observed time
t [316]:
f(t)
 -
- t-
t- ~
1.4 and ~
0.9. The flux distribution, when normalized to a
fixed hour after the burst has a rather narrow distribution. A
cancellation of the k corrections and the temporal decay makes
this flux, which is proportional to
(1 + z)-
insensitive to the redshift. Using 21 BeppoSAX bursts
[316]
Piran et al.
[310]
find that the 1-10 keV flux, 11 hours after the burst is
5 × 10-13 ergs/cm-2 sec.
The distribution is log-normal with
~
1.4 and ~
0.9. The flux distribution, when normalized to a
fixed hour after the burst has a rather narrow distribution. A
cancellation of the k corrections and the temporal decay makes
this flux, which is proportional to
(1 + z)-
insensitive to the redshift. Using 21 BeppoSAX bursts
[316]
Piran et al.
[310]
find that the 1-10 keV flux, 11 hours after the burst is
5 × 10-13 ergs/cm-2 sec.
The distribution is log-normal with
 fx
fx
 0.43 ± 0.1 (see
fig. 5). De Pasquale et al.
[310]
find a similar result for a larger sample. However, they find that the
X-ray afterglow of GRBs with optical counterparts is on average 5
times brighter than the X-ray afterglow of dark GRBs (GRBs with no
detected optical afterglow). The overall energy emitted in the
X-ray afterglow is generally a few percent of the GRB energy.
Berger et al.
[26]
find that the X-ray luminosity is
indeed correlated with the opening angle and when taking the
beaming correction into account they find that
LX = fb LX, iso,
is approximately constant, with a dispersion of only a factor of 2.
0.43 ± 0.1 (see
fig. 5). De Pasquale et al.
[310]
find a similar result for a larger sample. However, they find that the
X-ray afterglow of GRBs with optical counterparts is on average 5
times brighter than the X-ray afterglow of dark GRBs (GRBs with no
detected optical afterglow). The overall energy emitted in the
X-ray afterglow is generally a few percent of the GRB energy.
Berger et al.
[26]
find that the X-ray luminosity is
indeed correlated with the opening angle and when taking the
beaming correction into account they find that
LX = fb LX, iso,
is approximately constant, with a dispersion of only a factor of 2.
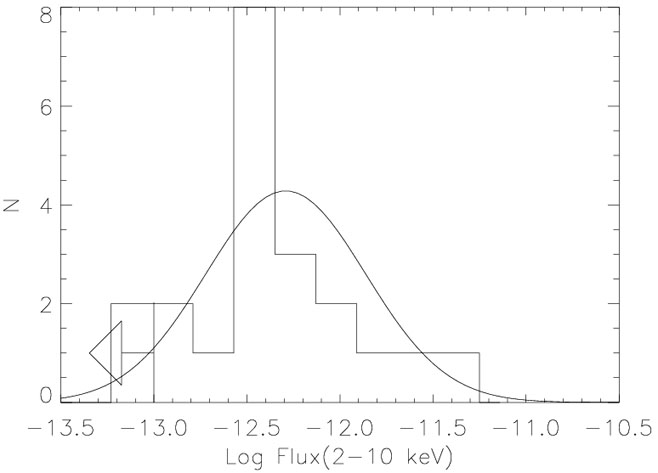 |
Figure 5. The distribution of X-ray fluxes (2-10 keV) at t=11 hours after the GRB in 21 afterglows observed by BeppoSAX (from Piran et al. [310]). The sample includes all the fast observations performed by BeppoSAX on GRB from January 1997 to October 1999. No X-ray afterglow was detected in GB990217 to the limiting instrumental sensitivity of 10-13 erg cm-2 s-1, 6 hours after the burst. In the case of GB970111 a candidate was detected, but evidence of fading behaviour is marginal, so both cases are considered as upper limits (indicated by the arrow). |
X-ray lines were seen in 7 GRBs: GRB 970508
[317],
GRB 970828
[444],
GRB 990705
[6],
GRB 991216
[319],
GRB 001025a
[428],
GRB 000214
[7]
and GRB 011211
[337].
The lines were detected using different instruments: BeppoSAX,
ASCA (Advanced Satellite for Cosmology and Astrophysics) , Chandra
and XMM-Newton. The lines were detected around 10 hours after the
burst. The typical luminosity in the lines is around
1044 - 1045 ergs/sec, corresponding to a total
fluence of
about 1049 ergs. Most of the lines are interpreted as emission
lines of Fe K. However,
there are also a radiative-recombination-continuum line edge and
K lines of
lighter elements like Si, S, Ar and Ca (all seen in the afterglow
of GRB 011211
[337]).
In one case (GRB 990705, Amati et al.
[6])
there is a transient absorption feature
within the prompt X-ray emission, corresponding also to Fe
K. The statistical
significance of the detection of these lines is of some concern (2-5
), and even thought the
late instruments are much more sensitive than the early ones all
detections remain at this low significance level. Rutledge and Sako
[360]
and Sako et al.
[362]
expressed concern
about the statistical analysis of the data showing these lines and
claim that none of the observed lines is statistically
significant. The theoretical implications are far reaching. Not
only the lines require, in most models, a very large amount of
Iron at rest (the lines are quite narrow), they most likely
require [128]
a huge energy supply (> 1052ergs), twenty time larger than
the typical estimated
 -rays
energy (~ 5 . 1050 ergs).
-rays
energy (~ 5 . 1050 ergs).
About 50% of well localized GRBs show optical
and IR afterglow. The observed optical afterglow is typically
around 19-20 mag one day after the burst (See
fig 6). The signal decays, initially, as a
power law in time,
t-
with a typical value of
1.2 and large
variations around this value. In all cases
the observed optical spectrum is also a power law
-.
Generally absorption lines are superimposed on this power law. The
absorption lines correspond to absorption on the way from the
source to earth. Typically the highest redshift lines are
associated with the host galaxy, providing a measurement of the
redshift of the GRB. In a few cases emission lines, presumably
from excited gas along the line of site were also observed.
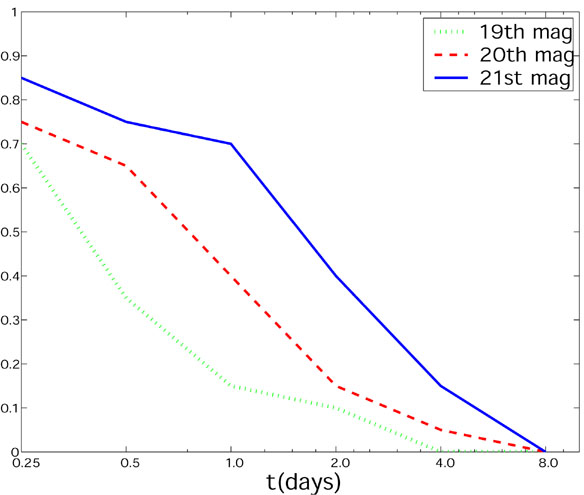 |
Figure 6. The fraction of bursts with optical afterglow above three limiting magnitudes as a function of time (compared to the total number of bursts with optical afterglow). |
Technical difficulties led a gap of several hours between the
burst and the detection of the optical afterglow, which could be
found only after an accurate position was available. The rapid
localization provided by HETE II helped to close this gap and an
almost complete light curve from 193 sec after the trigger
( 93 sec after the end
of the burst) is available now for GRB 021004
[101].
Many afterglow light curves show an achromatic break to a steeper
decline with
2. The classical
example of such a break was seen in GRB 990510
[159,
394]
and it is shown here in Fig. 7. It is common to fit
the break with the phenomenological formula:
F(t)
= f*(t /
t*)-1{1 - exp[- (t /
t*)(1-2](t /
t*)(1-2}. This break is commonly interpreted as a
jet break that allows us to estimate the opening angle of the jet
[344,
374]
or the viewing angle within the standard jet model
[347]
(see Section IID below).
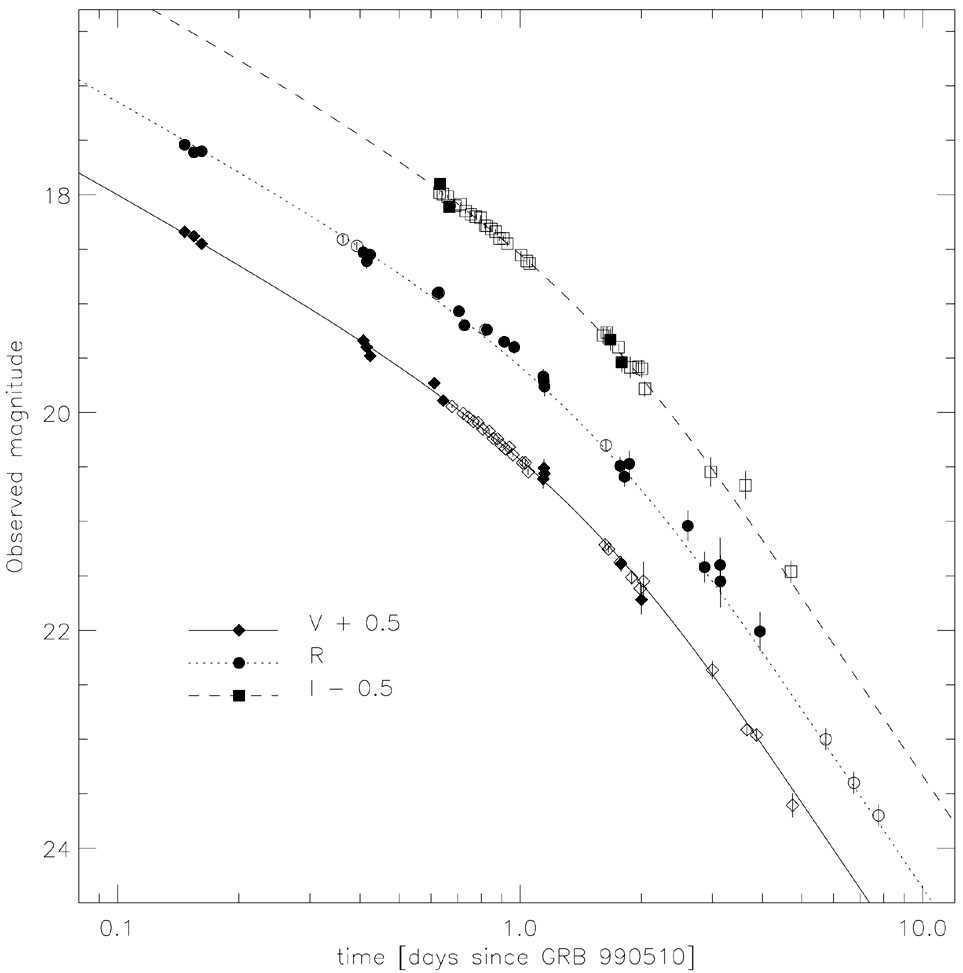 |
Figure 7. The optical light curves of GRB 990510. A fit for the observed optical light
curves is obtained with
|
The optical light curve of the first detected afterglow (from GRB 970228) could be seen for more than half a year [111]. In most cases the afterglow fades faster and cannot be followed for more than several weeks. At this stage the afterglow becomes significantly dimer than its host galaxy and the light curve reaches a plateau corresponding to the emission of the host.
In a several cases: e.g. GRB 980326 [37], GRB 970228 [339] GRB 011121 [38, 123] red bumps are seen at late times (several weeks to a month). These bumps are usually interpreted as evidence for an underlying SN. A most remarkable Supernova signature was seen recently in GRB 030329 [167, 395]. This supernova had the same signature as SN98bw that was associated with GRB 990425 (see Section IIC4).
Finally, I note that varying polarization at optical wavelengths has been observed in GRB afterglows at the level of a few to ten percent [27, 61, 62, 145, 346, 441]. These observations are in agreement with rough predictions ([126, 365]) of the synchrotron emission model provided that there is a deviation from spherical symmetry (see Section VF below).
Only ~ 50% of well-localized GRBs show optical transients (OTs) successive to the prompt gamma-ray emission, whereas an X-ray counterpart is present in 90% of cases (see Fig. 8). Several possible explanations have been suggested for this situation. It is possible that late and shallow observations could not detect the OTs in some cases; several authors argue that dim and/or rapid decaying transients could bias the determination of the fraction of truly obscure GRBs [24, 116]. However, recent reanalysis of optical observations [127, 210, 338] has shown that GRBs without OT detection (called dark GRBs, FOAs Failed Optical Afterglows, or GHOSTs, Gamma ray burst Hiding an Optical Source Transient) have had on average weaker optical counterparts, at least 2 magnitudes in the R band, than GRBs with OTs. Therefore, they appear to constitute a different class of objects, albeit there could be a fraction undetected for bad imaging.
The nature of dark GRBs is not clear. So far three hypothesis have
been put forward to explain the behavior of dark GRBs. First, they
are similar to the other bright GRBs, except for the fact that
their lines of sight pass through large and dusty molecular
clouds, that cause high absorption
[342].
Second, they are more distant than GRBs with OT, at z
 5
[110,
208],
so that the Lyman break is
redshifted into the optical band. Nevertheless, the distances of a
few dark GRBs have been determined and they do not imply high redshifts
[8,
81,
318].
A third possibility is that the optical afterglow of dark GRBs is
intrinsically much fainter (2-3 mag below) than that of other GRBs.
5
[110,
208],
so that the Lyman break is
redshifted into the optical band. Nevertheless, the distances of a
few dark GRBs have been determined and they do not imply high redshifts
[8,
81,
318].
A third possibility is that the optical afterglow of dark GRBs is
intrinsically much fainter (2-3 mag below) than that of other GRBs.
De Pasquale et al. [74] find that GRBs with optical transients show a remarkably narrow distribution of flux ratios, which corresponds to an average optical-to-x spectral index 0.794 ± 0.054. They find that, while 75% of dark GRBs have flux ratio upper limits still consistent with those of GRBs with optical transients, the remaining 25% are 4 - 10 times weaker in optical than in X-rays. This result suggests that the afterglows of most dark GRBs are intrinsically fainter in all wavelength relative to the afterglows of GRBs with observed optical transients. As for the remaining 25% here the spectrum (optical to X-ray ratio) must be different than the spectrum of other afterglows with a suppression of the optical band.
Radio afterglow was detected in ~ 50 % of the well localized bursts. Most observations are done at about 8 GHz since the detection falls off drastically at higher and lower frequencies. The observed peak fluxes are at the level of 2 mJy. A turnover is seen around 0.2 mJy and the undetected bursts have upper limits of the order of 0.1 mJy. As the localization is based on the X-ray afterglow (and as practically all bursts have X-ray afterglow) almost all these bursts were detected in X-ray. ~ 80 % of the radio-afterglow bursts have also optical afterglow. The rest are optically dark. Similarly ~ 80% of the optically observed afterglow have also a radio component (see fig 8).
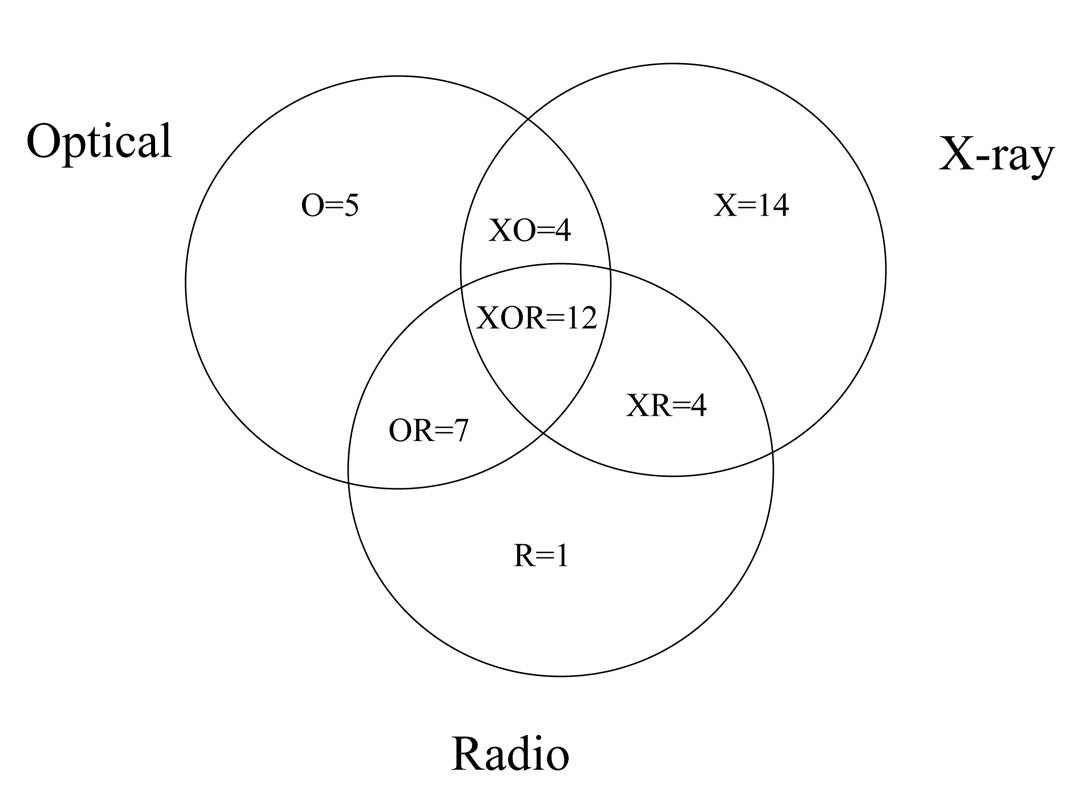 |
Figure 8. Venn diagram of the distribution of 47 Afterglows observed in different wavelength between 1997-2001 (from a talk given by D. Frail at the Sackler GRB workshop, Harvard, May 2001. |
Several bursts (GRBs 980329, 990123, 91216, 000926, 001018, 010222, 011030, 011121) were detected at around one day. Recent radio observations begin well before that but do not get a detection until about 24 hrs after a burst. The earliest radio detection took place in GRB 011030 at about 0.8 days after the burst [404]. In several cases (GRBs 990123, 990506, 991216, 980329 and 020405) the afterglow was detected early enough to indicate emission from the reverse shock and a transition from the reverse shock to the forward shock.
The radio light curve of GRB 970508 (see fig 9) depicts early strong fluctuations (of order unity) in the flux [104]. Goodman [131] suggested that these fluctuations arise due to scintillations and the decrease (with time) in the amplitude of the fluctuations arises from a transition from strong to weak scintillations. Frail et al. [104] used this to infer the size of the emitting region of GRB 970508 at ~ 4 weeks after the burst as ~ 1017 cm. This observations provided the first direct proof of relativistic expansion in GRBs.
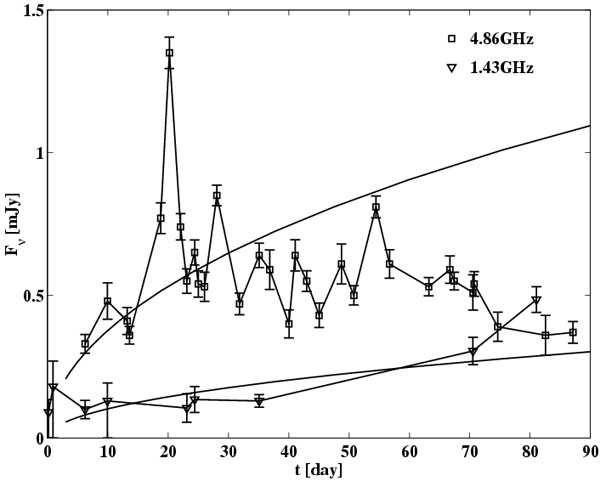 |
Figure 9. Light curves of the radio afterglow of GRB 970508 at 4.86 GHz and 1.43 GHz, compared with the predictions of the adiabatic fireball model (from Frail et al. [104]). |
The self-absorbed frequencies fall in the centimeter to meter wave
radio regime and hence the lower radio emission is within the
self-absorption part of the spectrum (see
Section VC3
later). In this case the spectrum rises as
2
[187].
The spectral shape that arises from a the fact that the system is
optically thick enables us (using similar arguments to those of a
simple black body emission) to determine the size of the emitting
region. In GRB 990508 this has lead to ~ 1017 cm. A
comparable estimate to the one derived from scintillations.
The long-lived nature of the radio afterglow allows for unambiguous calorimetry of the blast wave to be made when its expansion has become sub-relativistic and quasi-spherical. The light curves evolves on a longer time scale in the radio. Some GRB afterglows have been detected years after the burst even after the relativistic-Newtonian transition (see Section VIID). At this stage the expansion is essentially spherical and this enables a direct "calorimetric" estimate of the total energy within the ejecta [436].