


C. Hosts and Distribution
By now (early 2004) host galaxies have been observed for all but 1 or 2 bursts with optical, radio or X-ray afterglow localization with arcsec precision [177]. The no-host problem which made a lot of noise in the nineties has disappeared. GRBs are located within host galaxies (see Djorgovski et al. [82, 84] and Hurley et al. [177] for detailed reviews). While many researchers believe that the GRB host population seem to be representative of the normal star-forming field galaxy population at a comparable redshifts, others argue that GRB host galaxies are significantly bluer than average and their star formation rate is much higher than average.
The host galaxies are faint with median apparent magnitude
R  25. Some
faint hosts are at
R 29. Down to
R 25 the
observed distribution is consistent with deep
field galaxy counts. Jimenez et al.
[182]
find that the likelihood of finding a GRB in a galaxy is proportional to
the galaxy's luminosity.
25. Some
faint hosts are at
R 29. Down to
R 25 the
observed distribution is consistent with deep
field galaxy counts. Jimenez et al.
[182]
find that the likelihood of finding a GRB in a galaxy is proportional to
the galaxy's luminosity.
The magnitude and redshift distribution of GRB host galaxies are typical for normal, faint field galaxies, as are their morphologies [36, 84, 168, 177, 282]. While some researchers argue that the broad band optical colors of GRB hosts are not distinguishable from those of normal field galaxies at comparable magnitudes and redshifts [36, 391], others [110] asserts that the host galaxies are unusually blue and that they are strongly star forming. Le Floc'h et al. argues that R-K colors of GRB hosts are unusually blue and the hosts may be of low metallicity and luminosity. This suggests [212] that the hosts of GRBs might be different from the cites of the majority of star forming galaxies that are luminous, reddened and dust-enshrouded infrared starbursts (Elbaz and Cesarsky [87] and references therein). Le Floc'h [212] also suggests that this difference might rise due to an observational bias and that GRBs that arise in dust-enshrouded infrared starbursts are dark GRBs whose afterglow is not detectable due to obscuration. Whether this is tru or not is very relevant to the interesting question to which extend GRBs follow the SFR and to which extend they can be used to determine the SFR at high redshifts.
Totani
[408],
Wijers et al.
[438] and
Paczynski
[287]
suggested that GRBs follow the star formation rate. As early as 1998
Fruchter et al.
[110]
noted that all
four early GRBs with spectroscopic identification or deep
multicolor broadband imaging of the host (GRB 970228, GRB 970508,
GRB 971214, and GRB 980703) lie in rapidly star-forming galaxies.
Within the host galaxies the distribution of GRB-host offset
follows the light distribution of the hosts
[36].
The light is roughly proportional to the density of star formation.
Spectroscopic measurements suggest that GRBs are within Galaxies
with a higher SFR. However, this is typical for normal field
galaxy population at comparable redshifts
[173].
There are some intriguing hints, in particular the flux ratios of
[Ne III] 3859 to [OII] 3727 are on average a factor of 4 to 5
higher in GRB hosts than in star forming galaxies at low redshifts
[84].
This may represent an indirect evidence
linking GRBs with massive star formation. The link between GRBs
and massive stars has been strengthened with the centimeter and
submillimeter discoveries of GRB host galaxies
[25,
103]
undergoing prodigious star formation (SFR ~ 103
M yr-1), which remains obscured at optical wavelengths.
Evidence for a different characteristics of GRB host galaxies arise from the work of Fynbo et al. [114, 115] who find that GRB host galaxies "always" show Lyman alpha emission in cases where a suitable search has been conducted. This back up the claim for active star formation and at most moderate metallicity in GRB hosts. It clearly distinguishes GRB hosts from the Lyman break galaxy population, in which only about 1/4 of galaxies show strong Lyman alpha.
BATSE's discovery that the bursts are distributed uniformly on the sky [256] was among the first indication of the cosmological nature of GRBs. The uniform distribution indicated that GRBs are not associated with the Galaxy or with "local" structure in the near Universe.
Recently there have been several claims that sub-groups of the
whole GRB population shows a deviation from a uniform
distribution. Mészáros et al.
[229,
230],
for example, find that the angular distribution of the intermediate
sub-group of bursts (more specifically of the weak intermediate sub-group)
is not random. Magliocchetti et al.
[245]
reported that the
two-point angular correlation function of 407 short BATSE GRBs
reveal a ~ 2 deviation
from isotropy on angular scales
2° - 4°. This results is consistent with the possibility that
observed short GRBs are nearer and the angular correlation is
induced by the large scale structure correlations on this scale.
These claims are important as they could arise only if these
bursts are relatively nearby. Alternatively this indicates
repetition of these sources
[245].
Any such deviation would imply that these sub-groups are associated with
different objects than the main GRB population at least that these
subgroup are associated with a specific feature, such as a
different viewing angle.
deviation
from isotropy on angular scales
2° - 4°. This results is consistent with the possibility that
observed short GRBs are nearer and the angular correlation is
induced by the large scale structure correlations on this scale.
These claims are important as they could arise only if these
bursts are relatively nearby. Alternatively this indicates
repetition of these sources
[245].
Any such deviation would imply that these sub-groups are associated with
different objects than the main GRB population at least that these
subgroup are associated with a specific feature, such as a
different viewing angle.
Cline et al. [53] studied the shortest GRB population, burst with a typical durations several dozen ms. They find that there is a significant angular asymmetry and the <V / Vmax> distribution provides evidence for a homogeneous sources distribution. They suggest that these features are best interpreted as sources of a galactic origin. However, one has to realize that there are strong selection effects that are involved in the detection of this particular subgroup.
3. GRB rates and the isotropic luminosity function
There have been many attempts to determine the GRB luminosity function and rate from the BATSE peak flux distribution. This was done by numerous using different levels of statistical sophistication and different physical assumptions on the evolution of the rate of GRBs with time and on the shape of the luminosity function.
Roughly speaking the situation is the following. There are now
more than 30 redshift measured. The median redshift is
z 1 and the
redshift range is from 0.16 (or even 0.0085 if the
association of GRB 980425 with SN 98bw should be also considered)
to 4.5 (for GRB 000131). Direct estimates from the sample of GRBs
with determined redshifts are contaminated by observational biases
and are insufficient to determine the rate and luminosity
function. An alternative approach is to estimates these quantities
from the BATSE peak flux distribution. However, the observed
sample with a known redshifts clearly shows that the luminosity
function is wide. With a wide luminosity function, the rate of GRB
is only weakly constraint by the peak flux distribution. The
analysis is further complicated by the fact that the observed peak
luminosity, at a given detector with a given observation energy
band depends also on the intrinsic spectrum. Hence different
assumptions on the spectrum yield different results. This
situation suggest that there is no point in employing
sophisticated statistical tools (see however,
[224,
308]
for a discussion of these methods) and a simple analysis is sufficient
to obtain an idea on the relevant parameters.
I will not attempt to review the various approaches here. A
partial list of calculations includes
[56,
90,
169,
224,
304,
308,
379,
380,
381,
382].
Instead I will just quote results of some estimates of the rates and
luminosities of GRBs. The simplest approach is to fit
<V / Vmax>, which
is the first moment of the peak flux distribution. Schmidt
[379,
380,
381]
finds using
<V / Vmax> of the long burst distribution
and assuming that the bursts follow the
[320]
SFR2, that the present local rate of long observed GRBs is
0.15 Gpc-3
yr-1
[380].
Note that this rate from
[380]
is smaller by a factor of ten than the earlier rate of
[379]!
This estimate corresponds to a typical (isotropic) peak luminosity of
~ 1051 ergs/sec.
These are the observed rate and the isotropic peak luminosity.
Recently Guetta et al. [153] have repeated these calculations. They use both the [352] SFR formation rate:
 |
(2) |
and SFR2 from [320]. Their best fit luminosity function (per logarithmic luminosity interval, d log L) is:
 |
(3) |
and 0 otherwise with a typical luminosity,
L* = 1.1 × 1051 ergs/sec,
 = -0.6 and
 = -2, and
co is
a normalization constant so that the integral over the luminosity
function equals unity. The corresponding local GRB rate is
= -2, and
co is
a normalization constant so that the integral over the luminosity
function equals unity. The corresponding local GRB rate is
 0 =
0.44 Gpc-1 yr-1. There is an uncertainty of a
factor of ~ 2 in the typical energy, L*, and
in the local rate. I will use these numbers as the "canonical" values in
the rest of this review.
0 =
0.44 Gpc-1 yr-1. There is an uncertainty of a
factor of ~ 2 in the typical energy, L*, and
in the local rate. I will use these numbers as the "canonical" values in
the rest of this review.
The observed (BATSE) rate of short GRBs is smaller by a factor of three than the rate of long ones. However, this is not the ratio of the real rates as: (i) The BATSE detector is less sensitive to short bursts than to long ones; (ii) The true rate depends on the spatial distribution of the short bursts. So far no redshift was detected for any short bursts and hence this distribution is uncertain. For short bursts we can resort only to estimates based on the peak flux distribution. There are indications that <V / Vmax> of short burst is larger (and close to the Eucleadian value of 0.5) than the <V / Vmax> value of long ones (which is around 0.32). This implies that the observed short bursts are nearer to us that the long ones [186, 248, 403] possible with all observed short bursts are at z < 0.5. However, Schmidt [380] finds for short bursts <V / Vmax> = 0.354, which is rather close to the value of long bursts. Assuming that short GRBs also follow the SFR he obtains a local rate of 0.075 Gpc-3 yr-1 - a factor of two below the rate of long GRBs! The (isotropic) peak luminosities are comparable. This results differs from a recent calculation of Guetta and Piran [152] who find for short bursts <V / Vmax> = 0.390 and determine from this a local rate of 1.7 Gpc -3 yr-1 which is about four times the rate of long bursts. This reflects the fact that the observed short GRBs are significantly nearer than the observed long ones.
These rates and luminosities are assuming that the bursts are
isotropic. Beaming reduces the actual peak luminosity increases
the implied rate by a factor fb-1 = 2 /
 2. By now
there is evidence that GRBs are beamed and moreover the total
energy in narrowly distributed
[105,
291].
There is also a good evidence that the corrected peak luminosity
is much more narrowly distributed than the isotropic peak
luminosity [153,
419].
The corrected peak luminosity is
Lpeak(2 / 2) ~ const.
Frail et al.
[105]
suggest that the true rate is larger by a
factor of 500 than the observed isotropic estimated rate. However,
Guetta et al.
[153]
repeated this calculation
performing a careful average over the luminosity function and find
that that true rate is only a factor of ~ 75 ± 25 times the
isotropically estimate one. Over all the true rate is:
33 ± 11 h653 Gpc-3
yr-1.
2. By now
there is evidence that GRBs are beamed and moreover the total
energy in narrowly distributed
[105,
291].
There is also a good evidence that the corrected peak luminosity
is much more narrowly distributed than the isotropic peak
luminosity [153,
419].
The corrected peak luminosity is
Lpeak(2 / 2) ~ const.
Frail et al.
[105]
suggest that the true rate is larger by a
factor of 500 than the observed isotropic estimated rate. However,
Guetta et al.
[153]
repeated this calculation
performing a careful average over the luminosity function and find
that that true rate is only a factor of ~ 75 ± 25 times the
isotropically estimate one. Over all the true rate is:
33 ± 11 h653 Gpc-3
yr-1.
With increasing number of GRBs with redshifts it may be possible soon to determine the GRB redshift distribution directly from this data. However, it is not clear what are the observational biases that influence this data set and one needs a homogenous data set in order to perform this calculation. Alternatively one can try to determine luminosity estimators [95, 280, 377, 378] from the subset with known redshifts and to obtain, using them a redshift distribution for the whole GRB sample. Lloyd-Ronning et al. [223] find using the Fenimore and Ramirez-Ruiz [95] sample that this method implies that (i) The rate of GRBs increases backwards with time even for z > 10, (ii) The Luminosity of GRBs increases with redshift as (1 + z)1.4±0.5; (iii) Hardness and luminosity are strongly correlated. It is not clear how these features, which clearly depend on the inner engine could depend strongly on the redshift. Note that in view of the luminosity-angle relation (see Section IID below) the luminosity depends mostly on the opening angle. An increase of the luminosity with redshift would imply that GRBs were more narrowly collimated at earlier times.
4. Association with Supernovae
The association of GRBs with star forming regions and the indications that GRBs follow the star formation rate suggest that GRBs are related to stellar death, namely to Supernovae [287]. Additionally there is some direct evidence of association of GRBs with Supernovae.
GRB 980425 and SN98bw: The first indication of an association between GRBs and SNes was found when SN 98bw was discovered within the error box of GRB 980425 [120]. This was an usual type Ic SN which was much brighter than most SNs. Typical ejection velocities in the SN were larger than usual (~ 2 . 104 km / sec) corresponding to a kinetic energy of 2 - 5 × 1052 ergs, more than ten times than previously known energy of SNes, [179]. Additionally radio observations suggested a component expanding sub relativistically with v ~ 0.3c [200]. Thus, 1998bw was an unusual type Ic supernovae, significantly more powerful than comparable SNes. This may imply that SNs are associated with more powerful SNes. Indeed all other observations of SN signature in GRB afterglow light curves use a SN 98bw templates. The accompanying GRB 980425 was also unusual. GRB 980425 had a smooth FRED light curve and no high energy component in its spectrum. Other bursts like this exist but they are rare. The redshift of SN98bw was 0.0085 implying an isotropic equivalent energy of ~ 1048 ergs. Weaker by several orders of magnitude than a typical GRB.
The BeppoSAX Wide Field Cameras had localized GRB 980425 with a 8 arcmin radius accuracy. In this circle, the BeppoSAX NFI (Narrow Field Instrument) had detected two sources, S1 and S2. The NFI could associate with each of these 2 sources an error circle of 1.5 arcmin radius. The radio and optical position of SN1998bw were consistent only with the NFI error circle of S1, and was out of the NFI error circle of S2. Therefore, Pian et al. [301] identified S1 with X-ray emission from SN1998bw, although this was of course no proof of association between SN and GRB. It was difficult, based only on the BeppoSAX NFI data, to characterize the behavior and variability of S2 and it could not be excluded that S2 was the afterglow of GRB 980425. The XMM observations of March 2002 [302] seem to have brought us closer to the solution. XMM detects well S1, and its flux is lower than in 1998: the SN emission has evidently decreased. Concerning the crucial issue, S2: XMM, having a better angular resolution than BeppoSAX NFIs, seems to resolve S2 in a number of sources. In other words, S2 seems to be not a single source, but a group of small faint sources. Their random variability (typical fluctuations of X-ray sources close to the level of the background) may have caused the flickering detected for S2. This demolishes the case for the afterglow nature of S2, and strengthens in turn the case for association between GRB 980425 and SN1998bw.
Red Bumps: The late red bumps (see Section IIB2) have been discovered in several GRB light curves [37, 38, 123, 339]. These bumps involve both a brightening (or a flattening) of the afterglow as well as a transition to a much redder spectrum. These bumps have been generally interpreted as due to an underlining SN [37]. In all cases the bumps have been fit with a template of SN 1998bw, which was associated with GRB 980425. Esin and Blandford [88] proposed that these bumps are produced by light echoes on surrounding dust (but see [340]). Waxman and Draine [435] purposed another alternative explanation based on dust sublimation.
For most GRBs there is only an upper limit to the magnitude of the bump in the light curve. A comparison of these upper limits (see Fig. 10) with the maximal magnitudes of type Ibc SNe shows that the faintest GRB-SN non-detection (GRB 010921) only probes the top ~ 40th-percentile of local Type Ib/Ic SNe. It is clear that the current GRB-SNe population may have only revealed the tip of the iceberg; plausibly, then, SNe could accompany all long-duration GRBs.
 |
Figure 10. Comparison of the peak magnitudes of GRB-SNe with those of local Type Ib/Ic SNe. The solid cumulative histogram to the left is for those GRBs with a believable detection of a SN bump; the brightness of all other claimed GRB-SN peaks or reported upper-limits are shown as a dotted histogram. The solid histogram to the right is for those local Ibc SNe for which the SN was observed before peak; all others were discovered after peak. The faintest GRB-SN non-detection (010921) only probes the top ~ 40th-percentile of local Type Ib/Ic SNe. It is clear that the current GRB-SNe population may have only revealed the tip of the iceberg; plausibly, then, SNe could accompany all long-duration GRBs, from [33] |
GRB 030329 and CN 2003dh: The confirmation of SN 98bw like bump and the confirmation of the GRB-SN association was dramatically seen recently [167, 396] in the very bright GRB 030329 that is associated with SN 2003dh [51]. The bump begun to be noticed six days after the bursts and the SN 1999bw like spectrum dominated the optical light curve at later times (see Fig. 11. The spectral shapes of 2003dh and 1998bw were quite similar, although there are also differences. For example IID estimated a somewhat larger expansion velocity for 2003dh. Additionally the X-ray signal was much brighter (but this could be purely afterglow).
For most researchers in the field this discovery provided the
final conclusive link between SNe and GRBs (at least with long
GRBs). As the SN signature coincides with the GRB this
observations also provides evidence against a Supranova
interpretation, in which the GRB arises from a collapse of a
Neutron star that takes place sometime after the Supernova in
which the Neutron star was born - see IXE .
(unless there is a variety of Supranova types, some with long
delay and others with short delay between the first and the second
collapses) the spectral shapes of 2003dh and 1998bw were quite
similar, although there are also differences. For example there is
a slightly larger expansion velocity for 2003dh. It is interesting
that while not as week as GRB 990425, the accompanying
GRB 99030329 was significantly weaker than average. The implied
opening angle reveals that the prompt
 -ray energy
output, E, and the X-ray luminosity at 10 hr,
LX, are a
factor of ~ 20 and ~ 30, respectively, below the average
value around which most GRBs are narrowly clustered (see
IID below).
-ray energy
output, E, and the X-ray luminosity at 10 hr,
LX, are a
factor of ~ 20 and ~ 30, respectively, below the average
value around which most GRBs are narrowly clustered (see
IID below).
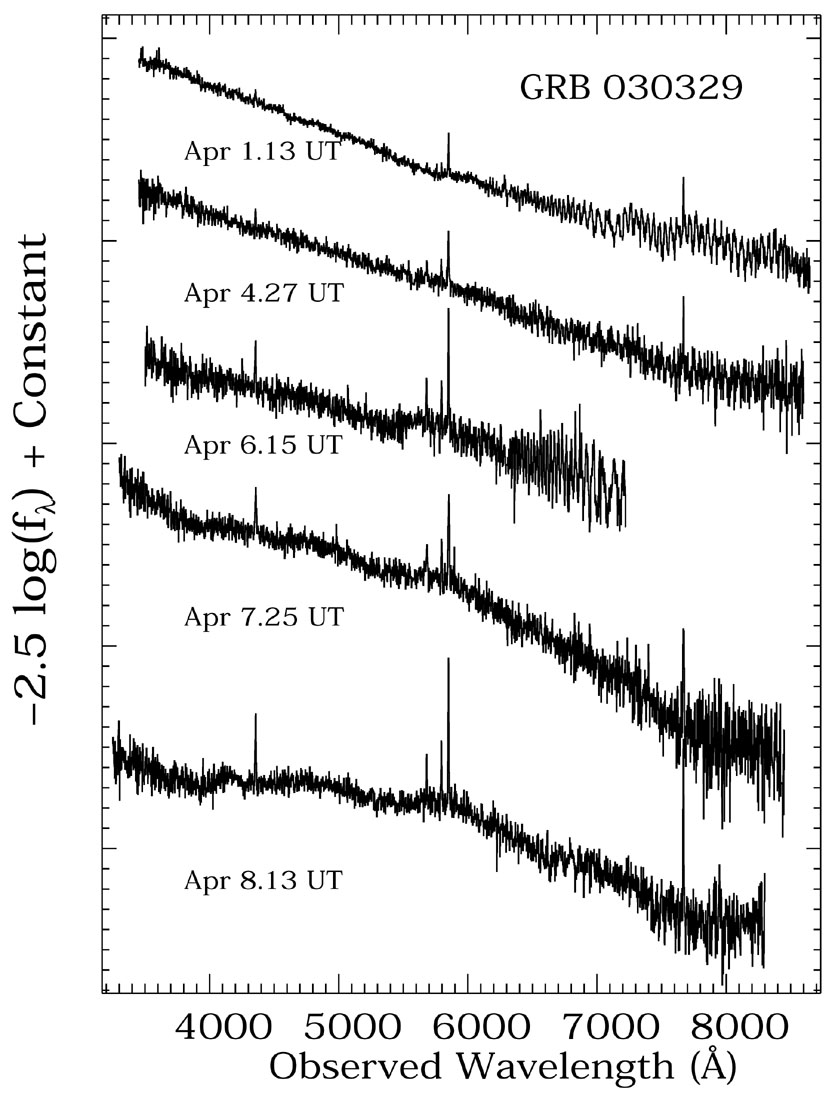 |
Figure 11. Evolution of the
GRB 030329 / SN2004dh spectrum, from April 1.13 UT (2.64 days after
the burst), to April 8.13 UT (6.94 days after the burst). The
early spectra consist of a power law continuum
(F |
It is interesting to compare SN 1999bw and SN 2003dh. Basically, at all epochs Matheson et al. [249] find that the best fit to spectra of 2003dh is given by 1998bw at about the same age. The light curve is harder, as the afterglow contribution is significant, but using spectral information they find that 2003dh had basically the same light curve as 1998bw. Mazzali et al. [250] model the spectra and find again that it was very similar to 1998bw. They find some differences, but some of that might be due to a somewhat different approach to spectral decomposition, which gives somewhat fainter supernova.
X-ray lines: The appearance of iron X-ray lines (see Section IIB1) has been interpreted as additional evidence for SN. One has to be careful with this interpretation as the iron X-ray lines are seen as if emitted by matter at very low velocities and at rather large distances. This is difficult to achieve if the supernova is simultaneous with the GRB, as the SN bumps imply. This X-ray lines might be consistent with the Supranova model [426] in which the SN takes place month before the GRB. However, in this case there won't be a SN bump in the light curve! Mészáros and Rees [239], Rees and Mészáros [336] and Kumar and Narayan [203] suggest alternative interpretations which do not require a Supranova.

