


2.1. Introduction: Changing Paradigms of Galaxy Formation
We now turn to the interesting history of how our views of galaxy formation have changed over the past 20-30 years. It is convenient to break this into 3 eras
 (t).
Ellipticals suffered a prompt conversion of gas into stars, whereas spirals
were permitted a more gradual consumption rate leading
to a near-constant star formation rate with time.
(t).
Ellipticals suffered a prompt conversion of gas into stars, whereas spirals
were permitted a more gradual consumption rate leading
to a near-constant star formation rate with time.
2.2. Galaxy Morphology - Valuable Tool or Not?
In the early years, astronomers placed great stock on understanding the origin of the morphological distribution of galaxies, sometimes referred to as the Hubble sequence (Hubble 1936). Despite this simple categorization 70 years ago, the scheme is evidently still in common use. In its support, Sandage (e.g. 2005) has commented on this classification scheme as describing `a true order among the galaxies, not one imposed by the classifier'. However, many contemporary modelers and observers have paid scant attention to morphology and placed more emphasis on understanding stellar population differences. What value should we place on accurately measuring and reproducing the morphological distribution?
The utility of Hubble's scheme, at least for local galaxies, lies in its ability to distinguish dynamically distinct structures - spirals and S0s are rotating stellar disks, whereas luminous spheroids are pressure-supported ellipsoidal or triaxial systems with anisotropic velocity fields. This contains key information on the degree of dissipation in their formation (Fall & Efstathiou 1980).
There are also physical variables that seem to underpin the sequence,
including (i) gas content and color which relate to the ratio of the
current to past average star formation ratio
(t0) /
 (Figure 8)
and (ii) inner structures including the bulge-to-disk ratio. Various
modelers
(Baugh et al 1996)
have argued that the bulge-to-disk
ratio is closely linked to the merger history and attempted to
reproduce the present distribution as a key test of hierarchical
assembly.
(Figure 8)
and (ii) inner structures including the bulge-to-disk ratio. Various
modelers
(Baugh et al 1996)
have argued that the bulge-to-disk
ratio is closely linked to the merger history and attempted to
reproduce the present distribution as a key test of hierarchical
assembly.
 |
 |
Figure 8. A succinct summary of the classical view of galaxy formation (pre-1985): (Left) The monotonic distribution of Hubble sequence galaxies in the U - V vs V-K color plane (Aaaronson 1978). (Right) A simple model which reproduces this trend by changing only the ratio of the current to past average star formation rate (Struck-Marcell & Tinsley 1978). Galaxies with constant star formation permanently occupy the top left (blue) corner; galaxies with an initial burst rapidly evolve to the bottom right (red) corner. |
|
Much effort has been invested in attempting to classify galaxies
at high redshift, both visually and with automated algorithms. This
is a challenging task because the precise
appearance of diagnostic features such as spiral arms and
the bulge/disk ratio depends on the rest-wavelength of the
observations. An effect termed the `morphological k-correction'
can thus shift galaxies to apparently later types as the redshift
increases for observations conducted in a fixed band. A further
limitation, which works in the opposite sense, is surface brightness
dimming, which proceeds as
 (1 +
z)4, rendering disks less prominent
at high redshift and shifting some galaxies to apparent earlier
types.
(1 +
z)4, rendering disks less prominent
at high redshift and shifting some galaxies to apparent earlier
types.
The most significant achievements from this effort has been the realization that, despite the above quantitative uncertainties, faint star-forming galaxies are generally more irregular in their appearance than in local samples (Glazebrook et al 1995, Driver et al 1995). Moreover, HST images suggest on-going mergers with an increasing frequency at high redshift (Le Fevre et al 2000) although quantitative estimates of the merging fraction as a function of redshift remain uncertain (see Bundy et al 2004).
The idea that morphology is driven by mergers took some time for the observational community to accept. Numerical simulations by Toomre & Toomre (1972) provided the initial theoretical inspiration, but the observational evidence supporting the notion that spheroidal galaxies were simple collapsed systems containing old stars was strong (Bower et al 1992). Tell-tale signs of mergers in local ellipticals include the discovery of orbital shells (Malin & Carter 1980) and multiple cores revealed only with 2-D dynamical studies (Davies et al 2001).
As discussed by the other course lecturers and briefly in Section 1, our ability to follow the distribution of dark matter and its growth in numerical simulations is well-advanced (e.g. Springel et al 2005). The same cannot be said of understanding how the baryons destined, in part, to become stars are allocated to each DM halo. This remains the key issue in interfacing theory to observations.
Progress has occurred in two stages - according to the eras
discussed in Section 2.1. Semi analytic
codes were first developed in the 1990's to introduce baryons into
DM n-body simulations using prescriptive methods for
star formation, feedback and morphological assembly
(Figure 9). These codes were initially motivated
to demonstrate that the emerging DM paradigm was consistent with the
abundance of observational data
(Kauffmann et al 1993,
Somerville & Primack
1999,
Cole et al 2000).
Prior to development of these codes, evolutionary
predictions were based almost entirely on the `classical'
viewpoint with stellar population modeling based on variations
in the star formation history
(t)
for galaxies evolving in isolation e.g.
Bruzual (1980).
 |
Figure 9. Schematic of the ingredients
inserted into a semi-analytical model (from
Cole et al 2000).
Solid lines refer to mass transfer, dashed lines to the
transfer of metals according to different compositions
Z. Gas cooling (M) and star formation
( |
Initially these feedback prescriptions were adjusted to match observables such as the luminosity function (whose specific details we will address below), as well as specific attributes of various surveys (counts, redshift distributions, colors and morphologies). In the recent versions, more elaborate physically-based models for feedback processes are being considered (e.g. Croton et al 2006)
The observational community was fairly skeptical of the predictions from the first semi-analytical models since it was argued that the parameter space implied by Figure 9 enabled considerable freedom even for a fixed primordial fluctuation spectrum and cosmological model. Moreover, where different codes could be compared, considerably different predictions emerged (Benson et al 2002). Only as the observational data has moved from colors and star formation rates to physical variables more closely related to galaxy assembly (such as stellar masses) have the limitations of the early semi-analytical models been exposed.
2.4. A Test Case: The Galaxy Luminosity Function
One of the most straightforward and fundamental predictions
a theory of galaxy formation can make is the present
distribution of galaxy luminosities - the luminosity function (LF)
 (L) whose units
are normally per comoving Mpc3
2.
(L) whose units
are normally per comoving Mpc3
2.
As the contribution of a given luminosity bin dL to the integrated
luminosity density per unit volume is
(L) L
dL, an elementary calculation shows that all luminosity functions
(be they for stars, galaxies or QSOs) must have a bend at some
characteristic luminosity, otherwise they would yield an
infinite total luminosity (see
Felton 1977
for a cogent early discussion
of the significance and intricacies of the LF). Recognizing this,
Schechter (1976)
proposed the product of a power law and an exponential as an appropriate
analytic representation of the LF, viz:
 |
where *
is the overall normalization corresponding to the
volume density at the turn-over (or characteristic) luminosity
L*,
and  is the faint end
slope which governs the relative abundance of faint and luminous galaxies.
is the faint end
slope which governs the relative abundance of faint and luminous galaxies.
The total abundance of galaxies per unit volume is then:
 |
and the total luminosity density is:
 |
where  is the
incomplete gamma function which can be
found tabulated in most books with integral tables (e.g.
Gradshteyn & Ryzhik
2000).
Note that NTOT diverges if
< -1, whereas
is the
incomplete gamma function which can be
found tabulated in most books with integral tables (e.g.
Gradshteyn & Ryzhik
2000).
Note that NTOT diverges if
< -1, whereas
 L
diverges only if < -2.
L
diverges only if < -2.
Recent comprehensive surveys by the 2dF team (Norberg et al 2002) and by the Sloan Digital Sky Survey (Blanton et al 2001) have provided definitive values for the LF in various bands. Encouragingly, when allowance is made for the various photometric techniques, the two surveys are in excellent agreement. Figure 10 shows the Schechter function is a reasonably good (but not perfect) fit to the 2dF data limited at apparent magnitude bJ < 19.7. Moreover there is no significant difference between the LF derived independently for the two Galactic hemispheres. The slight excess of intrinsically faint galaxies in the northern cap is attributable to a local inhomogeneity in the nearby Virgo supercluster.
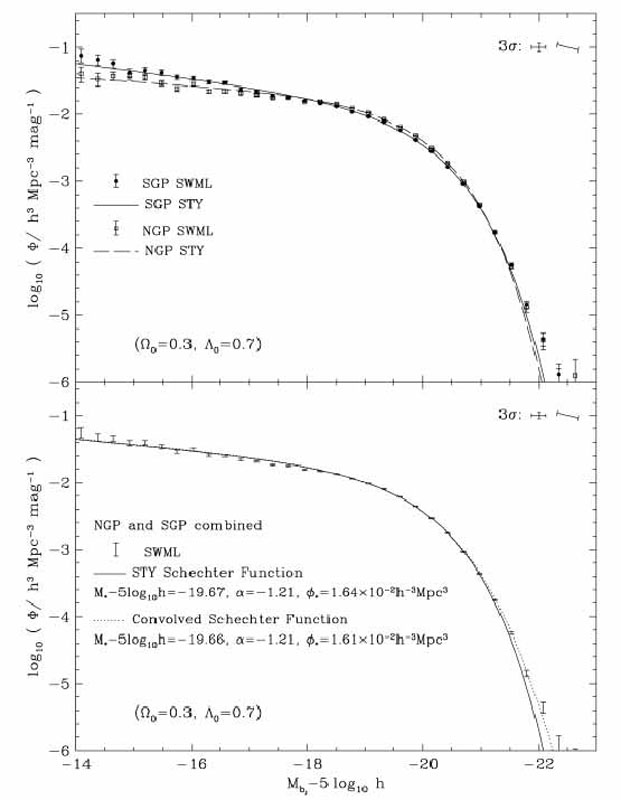 |
Figure 10. Rest-frame bJ luminosity function from the 2dF galaxy redshift survey (Norberg et al 2002). (Top) a comparison of results across the northern and southern Galactic caps; there is only a marginal difference in the abundance of intrinsically faint galaxies. (Bottom) combined from both hemispheres indicating the Schechter function is a remarkably good fit except at the extreme ends of the luminosity distribution. |
Fundamental though this function is, despite ten years of semi-analytical modeling, reproducing its form has proved a formidable challenge (as discussed by Benson et al 2003, Croton et al 2006 and de Lucia et al 2006). Early predictions also failed to reproduce the color distribution along the LF. The halo mass distribution does not share the sharp bend at * and too much star formation activity is retained in massive galaxies. These early predictions produced too many luminous blue galaxies and too many faint red galaxies (Bower et al 2006).
As a result, more specific feedback recipes have been created to resolve this discrepancy. Several physical processes have been invoked to regulate star formation as a function of mass, viz:
Benson et al (2003) and Croton et al (2006) illustrate the effects of these more detailed prescriptions for these feedback modes on the predicted LF and find that supernova and reionization feedback largely reduce the excess of intrinsically faint galaxies but, on grounds of energetics, only AGN can inhibit star formation and continued growth in massive galaxies. There remains an excess at the very faint end (Fig. 11).
 |
 |
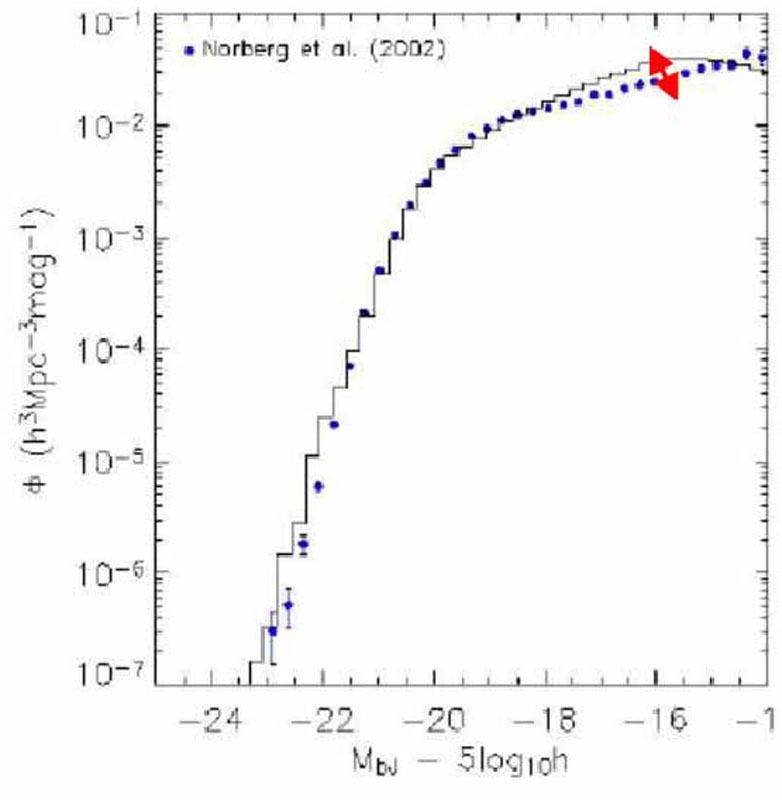 |
Figure 11. The effect of various forms of feedback (dots) on the resultant shape of the blue 2dF galaxy luminosity function (Norberg et al 2002). From left to right: no feedback, supernova feedback only, supernova, reionization & AGN feedback (Courtesy: Darren Croton). |
||
2.5. The Role of the Environment
In addition to recognizing that more elaborate modes of feedback need to be incorporated in theoretical models, the key role of the environment has also emerged as an additional feature which can truncate star formation and alter galaxy morphologies.
The preponderance of elliptical and S0 galaxies in rich clusters
was noticed in the 1930's but the first quantitative study of this
effect was that of
Dressler (1980)
who correlated the fraction of galaxies
of a given morphology T above some fixed luminosity with the
projected galaxy density,
 , measured in
galaxies Mpc-2.
, measured in
galaxies Mpc-2.
The local T -
relation was used to justify two
rather different possibilities. In the first, the nature
hypothesis, those galaxies which formed in high density peaks at
early times were presumed to have consumed their gas
efficiently, perhaps in a single burst of star formation. Galaxies in lower
density environments continued to accrete gas and thus
show later star formation and disk-like morphologies.
In short, segregation was established at birth and the present relation
simply represents different ways in which galaxies formed
according to the density of the environment at the time of
formation. In the second, the nurture hypothesis,
galaxies are transformed at later times from spirals into spheroidals by
environmentally-induced processes.
Work in the late 1990's, using morphologies determined using Hubble Space
Telescope, confirmed a surprisingly rapid evolution in the
T - relation
over 0 < z < 0.5
(Couch et al 1998,
Dressler et al 1997)
strongly supporting environmentally-driven evolution along the
lines of the nurture hypothesis. Impressive Hubble images
of dense clusters at quite modest redshifts (z
 0.3-0.4)
showed an abundance of spirals in their cores whereas few or
none exist in similar environs today.
0.3-0.4)
showed an abundance of spirals in their cores whereas few or
none exist in similar environs today.
What physical processes drive this relation and how has
the T -
relation evolved in quantitative detail? Recent work
(Smith et al 2005,
Postman et al 2005,
Figure 12) has
revealed that the basic relation was in place at z
1, but
that the fraction fE+S0 of Es and S0s has doubled
in dense environments since that time. Smith et al suggest
that a continuous, density-dependent, transformation of spirals
into S0s would explain the overall trend.
Treu et al (2003)
likewise see a strong dependence of the fraction as a function
of (and to a lesser
extent with cluster-centric radius) within
a well-studied cluster at z
0.4; they review the
various physical mechanisms that may produce such a transformation.
 |
Figure 12. The fraction of observed E and
S0 galaxies down to a
fixed rest-frame luminosity as a function of lookback time and projected
density |
Figure 12 encapsulates much of what we now know
about the role of the environment on galaxy formation. The early
development of the T -
relation implies
dense peaks in
the dark matter distribution led to accelerated evolution in gas
consumption and stellar evolution and this is not dissimilar to
the nature hypothesis. However, the subsequent
development of this relation since z
1 reveals the
importance of environmentally-driven morphological transformations.
2.6. The Importance of High Redshift Data
This glimpse of evolving galaxy populations to z
1 has
emphasized the important role of high redshift data. In the
case of the local morphology-density relation,
Hubble morphologies of galaxies in distant clusters have given
us a clear view of an evolving relationship, partly driven by
environmental processes. Indeed, the data seems to confirm
the nurture hypothesis for the origin of the morphology-density
relation.
Although we can place important constraints on the past star formation history from detailed studies of nearby galaxies, as the standard model now needs several additional ingredients (e.g. feedback) to reproduce even the most basic local properties such as the luminosity function (Figure 11), data at significant look-back times becomes an essential way to test the validity of these more elaborate models.
Starting in the mid-1990's, largely by virtue of the arrival of the Keck telescopes - the first of the new generation of 8-10m class optical/infrared telescopes - and the refurbishment of the Hubble Space Telescope, there has been an explosion of new data on high redshift galaxies.
It is helpful at this stage to introduce three broad classes of distant objects which will feature significantly in the next few lectures. Each gives a complementary view of the galaxy population at high redshift and illustrates the challenge of developing a unified vision of galaxy evolution.
 = 912 Å)
arising from the combined effect
of neutral hydrogen in hot stellar atmospheres, the interstellar
gas and the intergalactic medium. When redshifted beyond
z 2, the characteristic
`drop out' in the Lyman continuum moves into the optical
(Figure 13). We will review
the detailed properties of this, the most well-studied, distant
galaxy population over 2 < z < 5 in subsequent lectures.
= 912 Å)
arising from the combined effect
of neutral hydrogen in hot stellar atmospheres, the interstellar
gas and the intergalactic medium. When redshifted beyond
z 2, the characteristic
`drop out' in the Lyman continuum moves into the optical
(Figure 13). We will review
the detailed properties of this, the most well-studied, distant
galaxy population over 2 < z < 5 in subsequent lectures.
 |
Figure 13. Location and verification of the
Lyman break population in the redshift range 2.7 < z < 3.4
(Steidel et al 2003).
(Left) UGR color-color plane for a single field;
green and yellow shading refers to variants on the color
selection of high redshift candidates. Contaminating Galactic
stars cut across the lower right corner of this selection; those
confirmed spectroscopically are marked in red. (Right) Coadded
rest-frame Keck spectra for samples of typically 200 Lyman break
galaxies binned according to the strength of Lyman
|
Progress in understanding the role and nature of this population has been slower because sub-mm sources are often not visible at optical and near-infrared wavelengths (due to obscuration) and the positional accuracy of the sub-mm arrays is too coarse for follow-up spectroscopy. The importance of sub-mm sources lies in the fact that they contribute significantly to the star formation rate at high redshift. Regardless of their redshift, the source density at faint limits is 1000 times higher than a no-evolution prediction based on the local abundance of dusty IRAS sources. For several years the key issue was to nail the redshift distribution.
Progress has been made by securing accurate positions using radio interferometers such as the VLA (Frayer et al 2000). About 70% of those brighter than 5 mJy have VLA detections and spectroscopic redshift have now been determined for a significant fraction of this population (Chapman et al 2003, 2005, Figure 14).
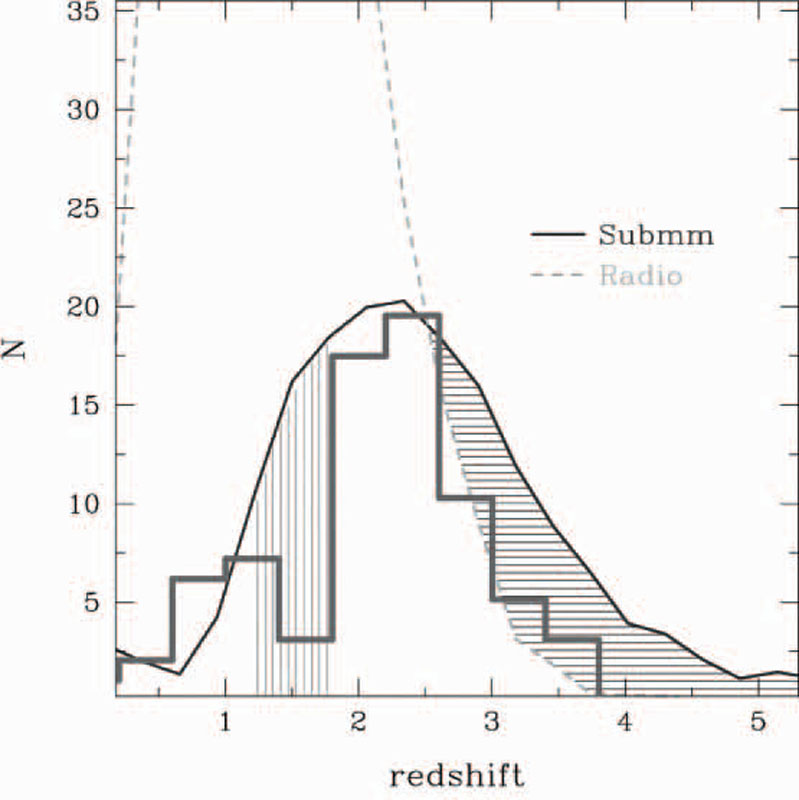 |
Figure 14. Redshift distribution of 73
radio-identified SCUBA sources from
Chapman et al (2005).
To illustrate the possible bias arising from the necessary condition of
a radio position for a Keck redshift, the solid curve represents
a model prediction for the entire >5mJy sub-mm population.
The sub-mm population does not seem to extend significantly
beyond z |
2, is very important.
The nomenclature here is confusing with intrinsically red sources being termed `extremely red objects (EROs)' or `distant red galaxies (DRGs)' with no agreed selection criteria (see McCarthy 2004 for a review). When star formation is complete, stellar evolution continues in a passive sense with main sequence dimming; the galaxy fades and becomes redder.
Of particular interest are the most distant examples which co-exist alongside the sub-mm and Lyman-break galaxies, i.e. at z > 2 selected according to their infrared J - K color (van Dokkum et al 2003, Figure 15).
 |
Figure 15. Observed spectral energy
distribution of distant red sources selected with a red
J - K color superimposed on model spectra
(Franx et al 2003).
Although some sources reveal modest
star formation and can be spectroscopically confirmed to
lie above z |
We have seen in this brief tour that galaxy formation is a process involving gravitational instability driven by the hierarchical assembly of dark matter halos; this component we understand well. However, additional complexities arise from star formation, dynamical interactions and mergers, environmental processes and various forms of feedback which serve to regulate how star formation continues as galaxies grow in mass.
Theorists have attempted to deal with this complexity by augmenting the highly-successful numerical (DM-only) simulations with semi-analytic tools for incorporating these complexities. As the datasets have improved so it is now possible to consider `fine-tuning' these semi-analytical ingredients. Ab initio modeling is never likely to be practical.
I think it fair to say that many observers have philosophical reservations about this `fine-tuning' process in the sense that although it may be possible to reach closure on models and data, we seek a deeper understanding of the physical reality of many of the ingredients. This is particularly the case for feedback processes. Fortunately, high redshift data forces this reality check as it gives us a direct measure of the galaxy assembly history which will be the next topics we discuss.
As a way of illustrating the importance of high redshift data, I have introduced three very different populations of galaxies each largely lying in the redshift range 2 < z < 4. When these were independently discovered, it was (quite reasonably) claimed by their discoverers that their category represented a major, if not the most significant, component of the distant galaxy population. We now realize that UV-selected, sub-mm selected and non-star forming galaxies each provide a complementary view of the complex history of galaxy assembly and the challenge is to complete the `jig-saw' from these populations.
2 If Hubble's constant is not assumed, it is quoted in units of h-3 Mpc-3. Back
 ). Stars
return some fraction of their mass to the interstellar
medium (R) and to the hot gas phase (e) according
to a metal yield p.
). Stars
return some fraction of their mass to the interstellar
medium (R) and to the hot gas phase (e) according
to a metal yield p.