


Although we may be able to account for the present stellar mass density by
integrating the comoving star formation history
(Section 3), this represents only
a small step towards understanding the history of galaxy assembly.
A major limitation is the fact that the star formation density
averages over a range of physical situations and luminosities; we are
missing a whole load of important physics. As we have seen, a single
value for the stellar mass density, e.g.
 *(z = 2), is useful when
considered as a global quantity (e.g. compared to an equivalent estimate
at z = 0), but it does not describe whether the observed star
formation is steady or
burst-like in nature, or even whether the bulk of activity within a given
volume arises from a large number of feeble sources or a small
number of intense objects. Such details matter if we are trying to
construct a clear picture of how galaxies assemble.
*(z = 2), is useful when
considered as a global quantity (e.g. compared to an equivalent estimate
at z = 0), but it does not describe whether the observed star
formation is steady or
burst-like in nature, or even whether the bulk of activity within a given
volume arises from a large number of feeble sources or a small
number of intense objects. Such details matter if we are trying to
construct a clear picture of how galaxies assemble.
Of course we could extend our study of time-dependent star formation
to determine the distribution functions of star formation at various
epochs (e.g. the UV continuum,
H or sub-mm
luminosity functions), but making the integration check only at
z = 0 is second-best to measuring the assembled mass and
its distribution function at various redshifts.
This would allow us to directly witness the growth rate of galaxies of
various masses at various times and, in some sense, is a more profound
measurement, closer to theoretical predictions.
or sub-mm
luminosity functions), but making the integration check only at
z = 0 is second-best to measuring the assembled mass and
its distribution function at various redshifts.
This would allow us to directly witness the growth rate of galaxies of
various masses at various times and, in some sense, is a more profound
measurement, closer to theoretical predictions.
Ideally we would like to measure both baryonic and non-baryonic masses for large numbers of galaxies but, at present at least, we can only make dynamical or lensing-based total mass estimates for specific types of distant galaxy and crude estimates for the gaseous component. The bulk of the progress made in the last few years has followed attempts to measure stellar masses for large populations of galaxies. We will review their achievements in this lecture.
4.2. Methods for Estimating Galaxy Masses
What are the options available for estimating galaxy masses of any kind at intermediate to high redshift? Basically, we can think of three useful methods.
 1.3. Key issues relate
to biases associated with preferential selection of systems with
`regular' appearance and how to interpret mass dynamically-derived over
a limited physical scale (c.f.
Conselice et al 2005).
In the absence of resolved rotation
curves, sometimes emission linewidths are considered a satisfactory proxy
(Newman & Davis 2000).
1.3. Key issues relate
to biases associated with preferential selection of systems with
`regular' appearance and how to interpret mass dynamically-derived over
a limited physical scale (c.f.
Conselice et al 2005).
In the absence of resolved rotation
curves, sometimes emission linewidths are considered a satisfactory proxy
(Newman & Davis 2000).
For many galaxies, an important and usually neglected component is the mass locked up in both ionized and cool gas. In nearby systems amenable to study of hot ionized gas (from nebular emission lines) and its usually dominant cooler neutral component (probed by 21cm studies), as much as 20% of the baryonic mass of a luminous star-forming galaxy can be found in this form (Zwaan et al 2003). At present, it is not possible to routinely use radio techniques to reliably estimate gaseous masses of distant galaxies although approximate gas masses have been derived assuming the projected surface density of nebular emission correlates with the gas mass within some measured physical scale (Erb et al 2006).
4.3. Results: Regular Galaxies 0 < z < 1.5
Because of the simplicity of their stellar populations, velocity fields and the lack of confusing gaseous components, rather more is known about the mass assembly history of ellipticals than for spirals. Concerning ellipticals, one of the key challenges is separating the age of the stars from the age of the assembled mass.
The Fundamental Plane (FP,
Dressler et al 1987,
Djorgovski & Davis
1987,
Bender, Burstein & Faber
1992,
Jorgensen et al 1996)
represents an
empirical correlation between the dynamical mass (via the central
stellar velocity dispersion
 0), the
effective radius (RE) and
light distribution (via the enclosed surface brightness
µE) for ellipticals, viz:
0), the
effective radius (RE) and
light distribution (via the enclosed surface brightness
µE) for ellipticals, viz:
 |
For example, with in km
sec-1, RE in kpc and
µE in
mags arcsec-2 in the B band, a = 1.25, b
= 0.32, c = -8.970 for h = 0.65.
These observables define an effective dynamical mass
ME  2
RE / G
which correlates closely with that deduced from lensing
(Treu et al 2006).
Deviations from the local FP at a given redshift z can be used to
deduce the change in mass/light ratio
2
RE / G
which correlates closely with that deduced from lensing
(Treu et al 2006).
Deviations from the local FP at a given redshift z can be used to
deduce the change in mass/light ratio
 log(M
/ L).
log(M
/ L).
The most comprehensive studies of the evolving FP come from two
independent and consistent studies of field spheroidals to z
1
(Treu et al 2005,
van der Wel et al 2005).
The evolution in mass/light ratio
log(M
/ L) deduced from the GOODS-N survey of
Treu et al (2005)
is shown in Figure 24. These authors find as
little as 1-3% by stellar mass of the present-day population in massive
(> 1011.5
M )
galaxies formed since z = 1.2, whereas for low mass systems
(< 1011
M) the
growth fraction is 20-40%. This result, confirmed independently by
van der Wel et al (2005),
is an important illustration of the mass-dependent growth in galaxies
with the most massive systems shutting off earliest.
)
galaxies formed since z = 1.2, whereas for low mass systems
(< 1011
M) the
growth fraction is 20-40%. This result, confirmed independently by
van der Wel et al (2005),
is an important illustration of the mass-dependent growth in galaxies
with the most massive systems shutting off earliest.
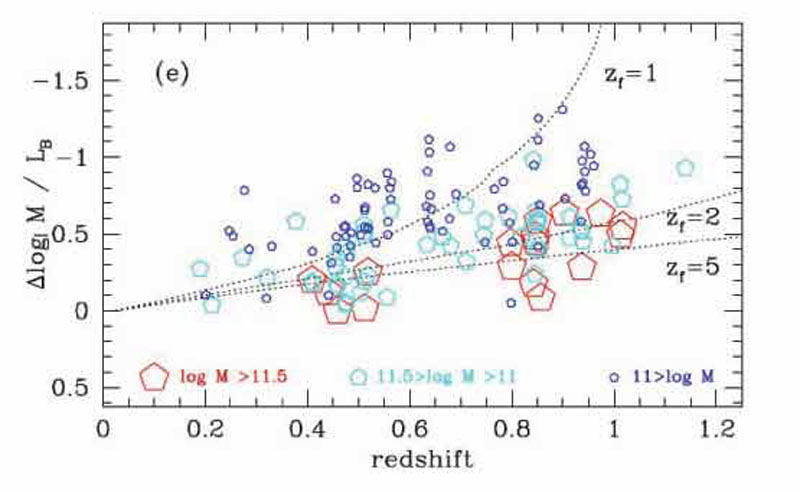 |
Figure 24. Change in B-band mass/light ratio with redshift deduced from the Keck dynamical survey of over 150 field spheroidals in GOODS-N (Treu et al 2005). The plot shows the change in mass/light ratio for galaxies of different effective dynamical masses (red: massive, cyan: intermediate, blue: low mass). Curves illustrate the change in mass/light ratio expected as a function of redshift for galaxies assembled monolithically with simply evolving stellar populations since a redshift of formation zf. Clearly the stars in the most massive galaxies largely formed at high redshift whereas assembly continued apace in lower mass systems. |
Of course, one should not confuse the age of stars, as probed by the FP, with the age of the assembled mass. van Dokkum (2005) has argued that if spheroidals preferentially merge with similar gas-poor systems (a process called `dry mergers') the FP analyses could well indicate early eras of major star formation even though the bulk of the assembled mass in individual systems occurred at z < 1 4. Bell et al (2006) and Tran et al (2005) have cataloged individual cases of dry mergers in both field and cluster samples, respectively. Their occurrence is not in dispute; however, only via morphological or other measures of the global mass assembly can the role of dry mergers as a major feature of galaxy assembly be addressed.
Related insight into this problem arises from the relative distributions of baryonic and dark matter deduced from the combination of lensing and stellar dynamics for the recently-located SDSS-selected Einstein rings (Treu et al 2006, Figure 25). Although it might be thought that lensing preferentially selects the most massive and compact sources, Treu et al compare the FP of such lenses with those in the larger field sample (Fig. 25) and deduce otherwise. An important result from the study of the first set of such remarkable lenses is how well the total mass profile can be represented by an isothermal form with mass tracing light, viz:
 |
Even over 0 < z < 1, the mass slope
 is constant at
2.0 to within 2% precision indicating rather precise collisional
coupling of dark matter and gas.
is constant at
2.0 to within 2% precision indicating rather precise collisional
coupling of dark matter and gas.
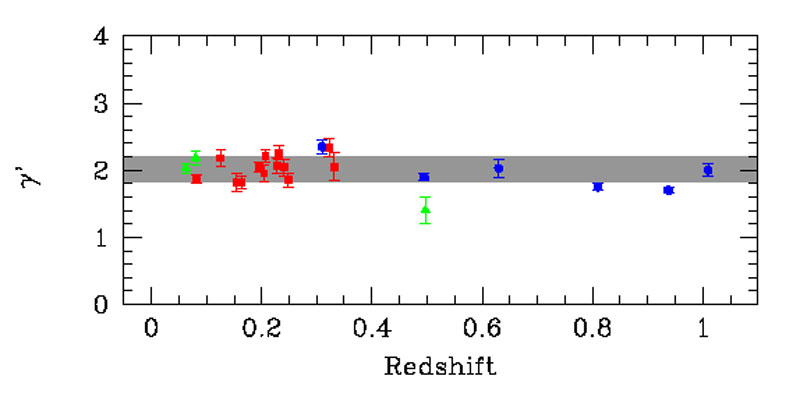 |
Figure 25. Distribution of the gradient
gamma in the total mass profile with
redshift as deduced from the combination of stellar dynamics and lensing
for ellipticals in the SLAC survey (Treu et al, in prepn). The remarkable
constancy of the profile slope indicates massive relaxed systems were
in place at z |
Sadly, far less is known about the mass assembly history of regular spirals.
The disk scaling law equivalent to the FP for ellipticals, the
Tully-Fisher relation
(Tully & Fisher 1977)
which links rotational velocity to luminosity gives ambiguous
information without additional input. Modest evolution in the TF
relationship was deduced from the pioneering Keck study of z
1 spirals
by Vogt et al (1997)
but this could amount to
0.6 mag of B-band
luminosity brightening in sources of a fixed rotational velocity to
z 1,
or more enhancement if masses were reduced.
Additional variables capable of breaking the degeneracy between dynamical
mass and luminosity include physical size and stellar mass.
Lilly et al (1998)
examined the size-luminosity relation for several hundred
disks to z 1 in
a HST-classified redshift survey sample (see
Sargent et al 2006
for an update) and found no significant growth for the largest systems.
Conselice et al (2005)
correlated stellar and dynamical masses for
100
spirals with resolved dynamics in the context of a simple halo formulation.
Although their deduced halo masses must be highly uncertain, they likewise
deduced that growth must be modest since z
1, occurring in a
self-similar fashion for the baryonic and dark components.
4.4. Stellar Masses from Multi-Color Photometry
Bundy et al (2005,
2006)
give a good summary and critical analysis of
the now well-established practice of estimating stellar masses from
multi-color optical-infrared photometry.
Figure 26 gives a practical illustration of the
technique where it can be seen that even for low z galaxies with good
photometry, the precision in mass is only
± 0.1-0.2 dex. In
most cases, even random uncertainties are at the ± 0.2-0.3 dex level
and systematic errors are likely to be much higher.
 |
Figure 26. Deriving stellar masses for galaxies of known redshift via multi-color optical photometry (after Bundy et al 2006). (Left) Rest-frame spectral energy distribution of two DEEP2 galaxies of known redshift from broad-band BRIK photometry with a fit deduced by fitting from a stellar synthesis library. The fit yields the most likely mass/light ratio of the observed population. (Right) Likelihood distribution of the stellar mass for the same two galaxies derived by Bayesian analysis. Dashed lines indicate the eventual range of permitted solutions. |
Since analysing stellar mass functions is now a major industry in the community, it is worth spending some time considering the possible pitfalls. A significant fraction of the large datasets being used are purely photometric, with both redshifts and stellar masses being simultaneously deduced from multi-color photometry (Drory et al 2002, Bell et al 2004, Fontana et al 2004). Few large surveys have extensive spectroscopy from which to check that this procedure works.
Bundy et al (2006) address this important question in the context of their extensive DEEP2 spectroscopic sample by artificially `switching off' the knowledge of the spectroscopic z: how does the stellar mass deduced when simultaneously deriving the photometric redshift from the same data compare with that derived when the spectroscopic value is externally input? Figure 27 illustrates that a significant component of error is one beyond that expected solely from the error in the derived redshift (as measured from the zspec vs. zphoto comparison).
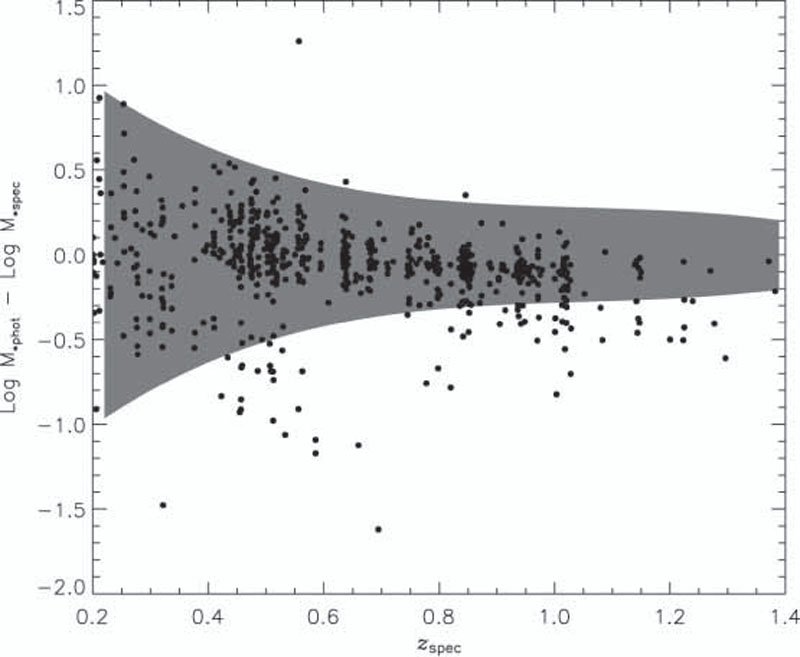 |
Figure 27. Error in log stellar mass when the known spectroscopic redshift is ignored (Bundy et al 2005). The shaded region defines the expected scatter in mass arising solely from that in the photometric-spectrosopic redshift comparison. Clearly in addition to this component, some catastrophic failures are evident. |
A second restriction in many stellar mass determinations is the absence of any near-infrared photometry. This may seem surprising given the classic papers (Kauffmann & Charlot 1998, Brinchmann & Ellis 2000) stressed its key role. However, panoramic near-infrared imaging is much more expensive in telescope time as few observatories, until recently, had large format infrared cameras. Inevitably, some groups have attempted to get by without the near-infrared data.
Figure 28 illustrates how the precision degrades when the K band data is dropped in the stellar mass fit (Bundy et al 2006) 5. Although the systematic error is contained, the noise increases significantly for redshifts z > 0.7 where the optical photometry fails to adequately sample the older, lower mass stars.
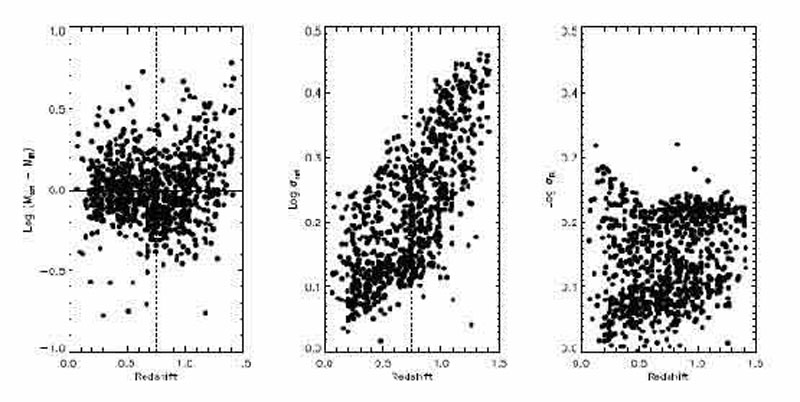 |
Figure 28. Effect of deriving stellar masses from optical photometry alone (Bundy et al 2006). (Left) Difference in masses derived using BRIK and BRI photometry. (Center) Distribution of uncertainties deduced from Bayesian fitting for the BRI fits. (Right) as center for the BRIK fitting. Although the systematic offset is small, the uncertainty in deduced stellar mass increases dramatically for galaxies with z > 0.7. |
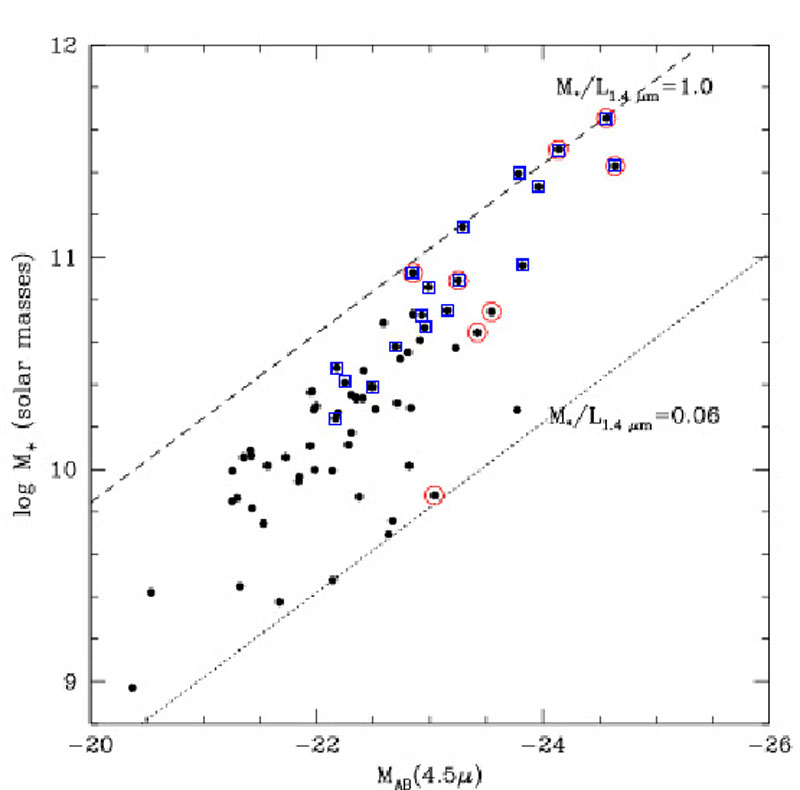
Shapley et al (2005)
explore a further uncertainty, which is particularly
germane to the analysis of their z
2 sources. Using IRAC
to represent the rest-frame infrared at these redshifts, they consider
the role that recent bursts of star formation might have on the deduced
stellar masses. Although bursts predominantly affect short-wavelength
luminosities, one might imagine little effect at the longer wavelengths
(c.f.
Kauffmann & Charlot
1998).
Shapley et al consider a wider range
of star formation histories and show that the derived stellar mass depends
less strongly on the long wavelength luminosity L (4.5
µm) than expected. The scatter is consistent with variations
in mass/light ratios of ×15 (Figure 29).
The strong correlation between mass and
optical-infrared color emphasizes the importance of secondary activity.
 |
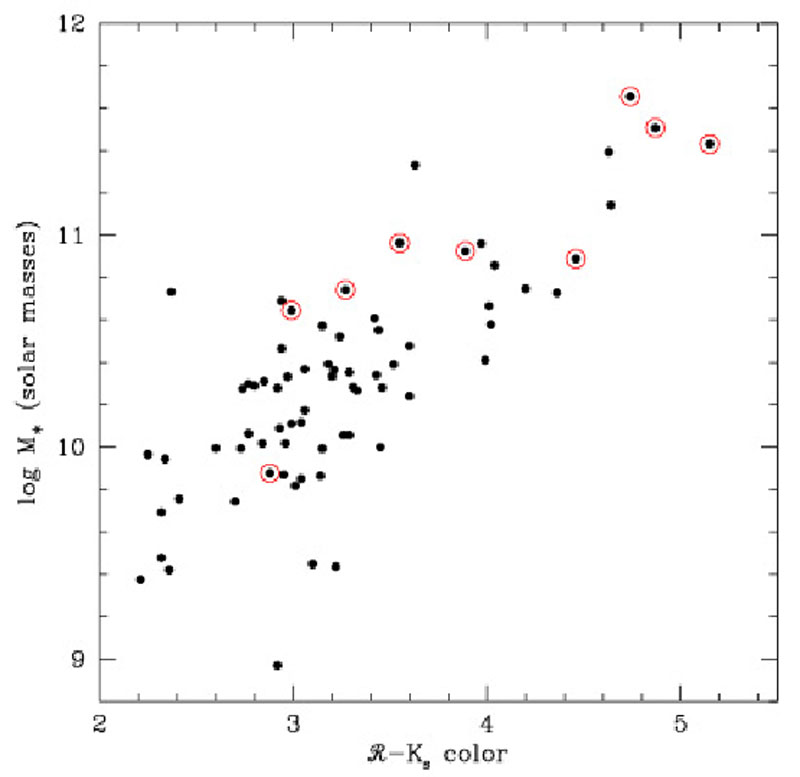 |
Figure 29. Stellar masses versus
observed
IRAC 4.5 µm luminosities for the sample of z
|
|
4.5. Results: Stellar Mass Functions 0 < z < 1.5
Noting the above uncertainties, we now turn to results compiled from the stellar mass distributions of galaxies undertaken in both spectroscopic and photometric surveys. A recent discussion of the various results can be found in Bundy et al (2006).
Brinchmann & Ellis
(2000)
were the first to address the
global evolution of stellar mass in this redshift range using a
morphological sample of 350 galaxies with spectroscopic
redshifts and infrared photometry. The small sample did
not permit consideration of detailed stellar mass functions, but
the integrated mass density was partitioned in 3 redshift bins
for spheroidals, spirals and irregulars. Surprisingly little growth
was seen in the overall mass density from z
1 to today;
the strongest evolutionary signal seen is a redistribution
of mass amongst the morphologies dominated by a declining
mass density in irregulars with time.
The ratio of the galactic stellar mass Mstar to the current star formation rate SFR, e.g. as deduced spectroscopically or from the rest-frame optical colors, is sometimes termed the specific star formation rate, R. This quantity allows us to address the question of whether galaxies have been forming stars for a significant fraction of the Hubble time, at a rate commensurate with explaining their assembled mass. A low value for R implies a quiescent object whose growth has largely ended; the mean stellar age is quite large. A high value of R implies an active object which has assembled recently. A frequently-used alternative is the `doubling time' - that period over which, at the current SFR, the observed stellar mass would double. This time would be quite short for active objects.
Cowie et al (1996),
Brinchmann & Ellis
(2000),
and most recently
Juneau et al (2005),
found a surprising trend whereby most massive galaxies
over z 0.5-1.5
are quiescent, having presumably formed
their stars well before z
2, whereas low mass
galaxies remain surprisingly active. The term `downsizing' - a signature
of continued growth in lower mass galaxies after that in the high mass
galaxies has been completed - was first coined by
Cowie et al (1996)
and has been used rather loosely in the recent literature to imply any
signature of anti-hierarchical activity. In particular, it is important
to distinguish between downsizing in star formation activity,
which presumably represents some physical
process that permits continued star formation in lower mass systems
when that in massive galaxies has concluded, from downsizing
in mass assembly, a truly `anti-hierarchical' process whereby new mass
is being added to lower mass galaxies at later times (see discussion in
Bundy et al 2006).
Before trying to understanding in more detail what causes this mass-dependent star formation, it is worth returning to the issue of dry mergers raised in Section 4.3. A `downsizing' signature was also seen in the growth of spheroidal galaxies as analysed by their location on the evolving Fundamental Plane (Treu et al 2005, van der Wel et al 2005). However, van Dokkum (2005) argued that while this may reflect older stars in the more massive galaxies, the assembled mass may still be young if merging preferentially occurs between quiescent objects. The only way to test this hypothesis is to directly measure the growth rate in spheroidal systems.
Using the deeper and more extensive sample of galaxies available
in the GOODS fields,
Bundy et al (2005)
produced type-dependent stellar mass functions
(Figure 30). Here, for
the first time, one can see the morphological evolution detected by
Brinchmann & Ellis largely arises via the transformation of
intermediate mass (
5 × 10¹⁰ - 2 × 10¹¹
M)
irregulars and spirals
into spheroidals. If merging is responsible for this transformation, it is
predominantly occurring between gas-rich and active systems even
at the very highest masses. The bulk of the evolution below z
1 is
simply a redistribution of star formation activity, perhaps as a result
of mergers or feedback processes.
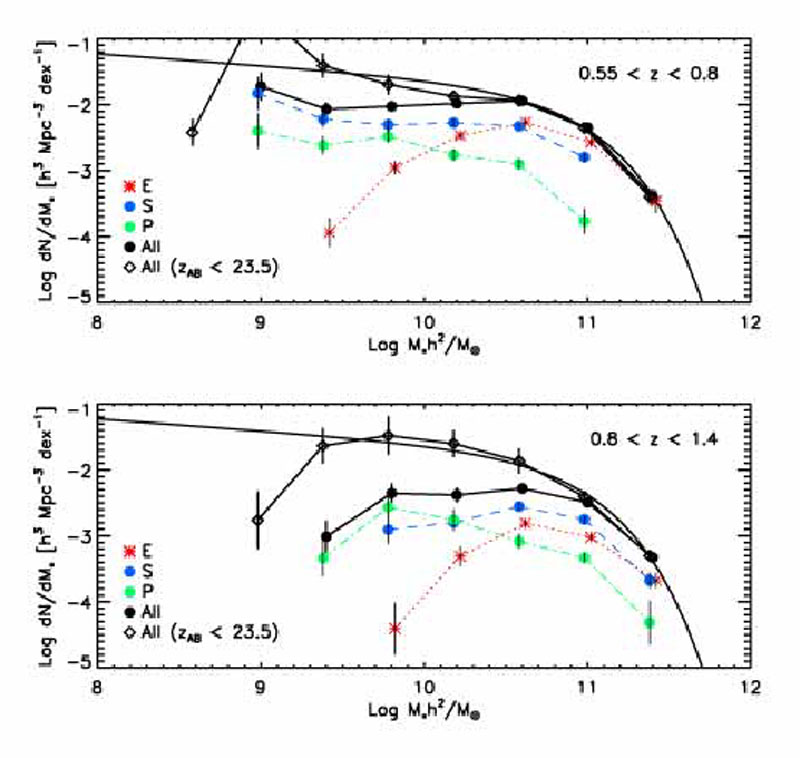 |
Figure 30. Stellar mass function arranged by morphology in two redshift bins from the analysis of Bundy et al (2005) for h = 1. The solid curve in both plots represents the present day mass function from the 2dF survey (Cole et al 2003). Type-dependent mass functions are color-coded with black representing the total. The solid line connecting the filled black circles represents the sample with spectroscopic redshifts, the dotted line connecting the open black diamonds includes masses derived from sources with photometric redshifts. The vertical dashed lines represent completeness limits for all types. |
Interestingly, in Figure 30 there is almost no
change in the
total mass function with time above 5. 1010
M,
suggesting little growth in the mass spheroidals that dominate
the high mass end. However, it worth remembering that the two
GOODS fields are limited in size (0.1 deg2) and suffer from
cosmic variance at the 20% level at high redshift increasing to 60% at low
redshift
(Bundy et al 2005).
Stellar mass functions for a much larger sample of field galaxies of known redshift have been analyzed by Bundy et al (2006) utilizing the combination of extensive spectroscopy and Palomar K-band imaging in four DEEP2 fields (totalling 1.5 deg2). This sample has the benefit of being much less affected by cosmic variance although, as there is no complete coverage with HST, morphological classifications are not possible. Color bimodality has been analyzed in the DEEP2 sample (Weiner et al 2005) and Bundy et al use the rest-frame U - B color and spectroscopic [O II] equivalent width to separate quiescent and active galaxies.
Figure 31 shows a direct comparison of the
integrated stellar mass functions from this large survey alongside
other, less extensive surveys, most of which are based only on photometric
redshifts. Although each is variance limited in different ways,
one is struck again by the quite modest changes in the abundance
of massive galaxies since z
1.
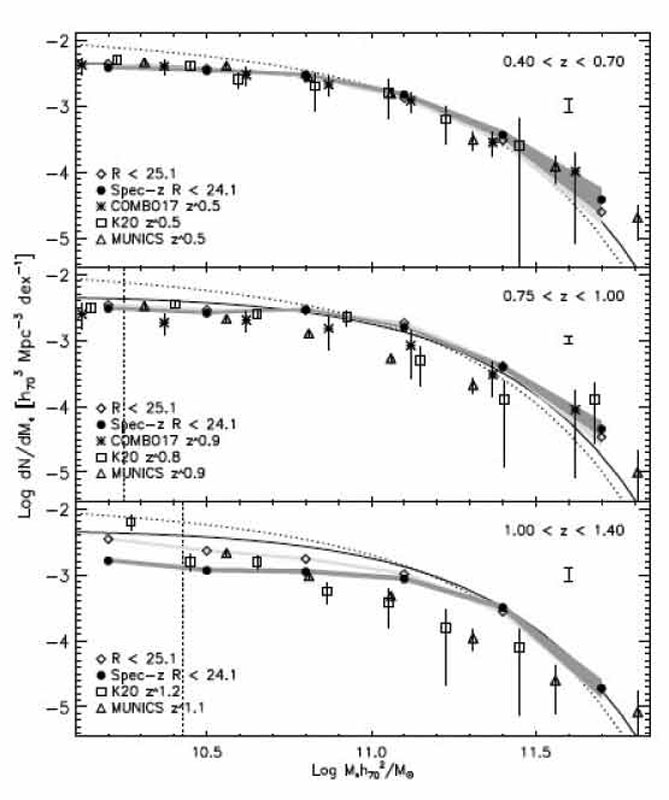 |
Figure 31. The evolving stellar mass function from the comparison of Bundy et al (2006). |
Next we consider (Figure 32) the stellar mass
functions for the quiescent
and active star-forming galaxies independently, partitioned according
to the rest-frame U - B color. The surprising result here is the
existence of a threshold or quenching mass, MQ
above which there are no active systems. This is implied independently
in Figure 30 where, within the redshift bin
0.55 < z < 0.8, there
are no spirals or irregulars with mass > 1011
M.
Interestingly, there is also a modest downward transition in
MQ with time.
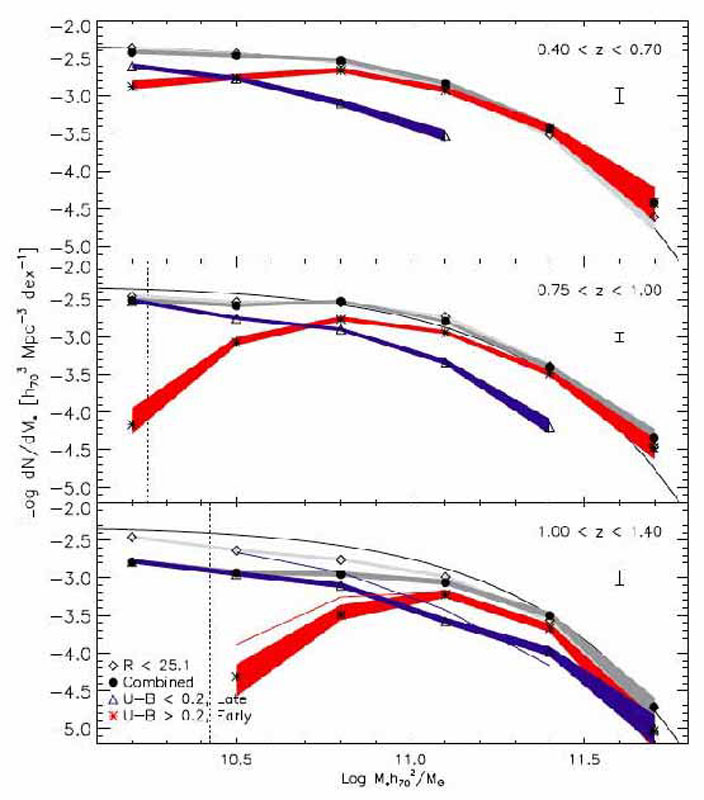 |
Figure 32. The evolving stellar mass function split into quiescent (red) and active (blue) sources from the survey of Bundy et al (2006). Uncertainties arising from counting statistics and errors in the stellar masses are indicated by the associated shading. The thin solid line represents the local 2dF function (Cole et al 2003) and the dark and light grey regions represent total mass functions using only spectroscopic and including photometric redshifts respectively. |
A remarkably consistent picture emerges from these studies.
Over the redshift range 0 < z < 1.5, the stellar mass
function has changed very little at the high mass end. Substantial growth,
in terms of a mass doubling on
5-8 Gyr timescale,
is only possible for galaxies with stellar masses below 1010
M.
Above this mass, the basic evolutionary signal is a quenching
of star formation in well-established systems. This quenching
progresses toward lower mass systems at later times,
consistent with the mass-dependent trends seen in the ages of
stellar populations in the quiescent spheroidals.
The physical origin of the quenching of star formation, the fundamental origin of the various downsizing signals, is unclear. Although the merger-induced production of active galactic nuclei may lead to the temporary expulsion and heating of the gaseous halos that surround galaxies (Springel et al 2005, Croton et al 2006), key tests of this hypothesis include sustaining the quenching, the weak environmental dependence of the observational trends and the surprisingly clear redshift dependence of the effect (Figure 32).
4.6. Results: Stellar Mass Functions z > 1.5
With current facilities, the stellar mass data beyond z
1.5
generally probes only the higher mass end of the distribution
and relies on photometric rather than spectroscopic data.
Nonetheless, the results emerging have received as much
attention as those at lower redshift. Unlike the complexities of
understanding downsizing and the redistribution of mass
and morphology in the z < 1 data, the basic question at stake
here is simply whether the abundance of massive z
2
galaxies is larger than expected in the standard model.
Testing the decline with redshift in the comoving abundance of, say,
systems with stellar mass greater than 1011
M,
expected in  CDM
has been a frustrating story
for the observers for two reasons. Firstly, the most massive
systems are rare and clustered, and so determining reliable
density estimates beyond z
1.5 has required panoramic
deep infrared data which has only recently arrived. For a
review of the early observational efforts see
Benson, Ellis &
Menanteau (2002)
CDM
has been a frustrating story
for the observers for two reasons. Firstly, the most massive
systems are rare and clustered, and so determining reliable
density estimates beyond z
1.5 has required panoramic
deep infrared data which has only recently arrived. For a
review of the early observational efforts see
Benson, Ellis &
Menanteau (2002)
Secondly, there has been considerable confusion in the theoretical
literature on the expected rate of decline in > 1011
M
systems. Early predictions
(Kauffmann, Charlot &
White 1996)
claimed a 3-fold decline in the comoving abundance to z
1 in
apparent agreement with the large photometric sample analyzed
by Bell et al (2004).
However, careful comparisons of independent semi-analytical predictions
(Kauffmann et al 1999,
Cole et al 2000)
reveal substantial differences (by an order of magnitude for the same
world model) in the rate of decline even to z
1
(Benson, Ellis &
Menanteau 2002).
In reality, the predictions depend
on many parameters where differences can have a large
effect for the region of the mass function where the slope dN /
dM is steep.
Dickinson et al (2003)
undertook a pioneering study to evaluate
the growth of stellar mass with photometric redshift using deep
H < 26.5 NICMOS data in the Hubble Deep Field North. Although
a tiny field (5 arcmin2), the work was the first to
demonstrate the existence of 1011
M
galaxies at z
1.5-2 as well as the challenges of estimating reliable abundances. A
similar HDF-S analysis was undertaken by
Rudnick et al (2003).
A more representative area of 4 × 30 arcmin was probed
spectroscopically in the Gemini Deep Deep Survey
(Glazebrook et al 2004),
albeit to a much shallower depth. These authors claimed a `surprising'
abundance of 1011
M
systems to z
2. Although
an absolute comparison of the abundances with semi-analytical
predictions is not likely to be illuminating for the reasons mentioned
above, the redshift-dependent mass growth rate over 1 <
z < 2,
derived empirically from both the stellar masses and the integrated
star formation rate, seems much slower than expected in the
semi-analytical models
(Granato et al 2000).
Of particular interest is the fact that the mass growth rate seems not
depend strongly on the mass range in question in apparent disagreement
with the model predictions (Figure 33).
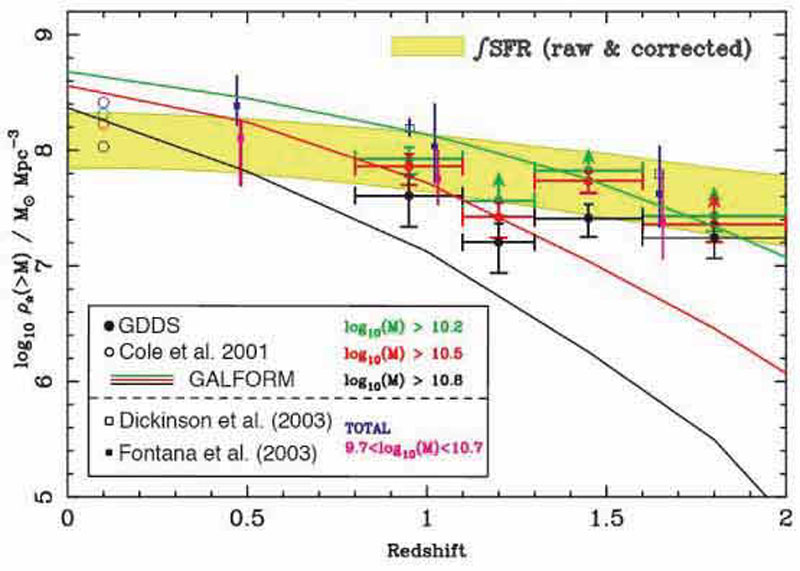 |
Figure 33. The mass assembly history
derived from stellar masses in the Gemini Deep Deep spectroscopic survey
(Glazebrook et al 2004).
Colored data points refer to observed cumulative densities
|
Although many of the observers associated with the Gemini Deep Deep Survey have claimed the abundance and slow growth rate of massive galaxies over 1.5 < z < 2 poses a crisis for the standard model, alongside the puzzling `anti-hierarchical' behavior observed for z < 1.5, the plain fact is that there is considerable uncertainty in the semi-analytical predictions.
4.7. Quiescent Galaxies with 2 < z < 3
Finally, it is illustrative to consider the dramatic effect that
infrared data from panoramic ground-based cameras and
the Spitzer Space Telescope is having, not only on our knowledge
of the distribution of stellar masses at high redshift, but also how
stellar mass is distributed among quiescent and star-forming
populations. Until recently, there was widespread belief
that the bulk of the star formation in this era, and probably a significant
fraction of the stellar mass, lay in the Lyman break population.
By contrast,
van Dokkum et al (2006)
have examined the rest-frame U - V colors of a sample of 300 >
1011
M
galaxies with 2 < zphoto < 3
(Figure 34) and claim almost
80% are quiescent. The definition of `quiescent' here is somewhat
important to get correct, given it now emerges that many of the
originally-selected distant red galaxies with J - K > 2.3
(Section 2.6) turn out to have quite
respectable star formation rates. Infrared spectroscopy sensitive to
H emission and
the 4000Å break is making great strides in clarifying this question
(Kriek et al 2006).
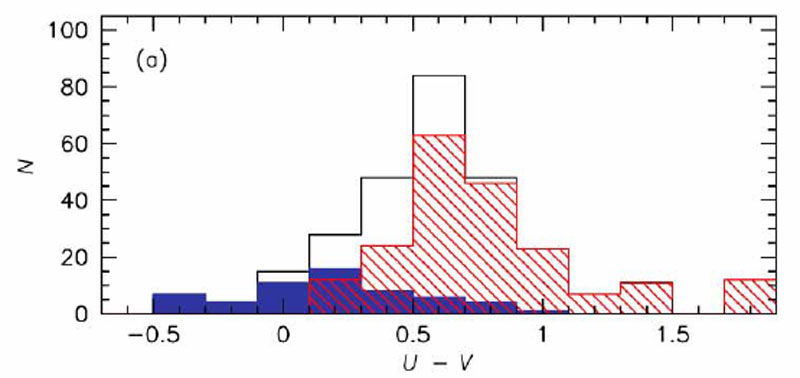 |
Figure 34. The distribution of rest-frame
U-V color for a Spitzer-selected sample of 2 < z < 3
galaxies with stellar masses > 1011
M |
In this lecture we have demonstrated important new techniques
for estimating the stellar masses of all types of galaxies to impressive
high redshift (z
3). The reliability of these techniques
is improved greatly by having spectroscopic, rather than photometric,
redshifts and, for z > 0.7, by the addition of infrared
photometry. These techniques augment and extend more precise measures
available for restricted classes of galaxies - such as the Fundamental
Plane for pressure-supported spheroidals, and the Tully-Fisher
relationship for rotationally-supported disks.
These various probes point to a self-consistent, but puzzling,
description of mass assembly since z
1.5. During this
era, massive galaxies have hardly grown at all - most of the
star formation and rapid growth is occurring in systems whose
masses are less than 1010
M.
Remarkably, the star formation appears to be quenched above a certain
threshold mass whose value, in turn, is declining with time.
Energetic sources such as supernovae or active nuclei may be responsible for this `downsizing' signature but further work is needed to verify both the weak environmental trends seen in the observations and the redshift-dependent trends in the threshold mass.
Beyond z 1.5,
the number and distribution of massive (> 1011
M
galaxies has led to some surprises.
Although the sheer abundance may not be a problem for
contemporary models, the fact that so many have apparently
completed their star formation is more challenging and
consistent with the slow growth rate observed at later
times. The observational situation is rapidly developing
but consistent with the presence of a surprisingly abundant
and mature population of massive galaxies by z
3.
4 The reason observers have gone somewhat out of their way to consider such complicated scenarios is because late assembly of massive spheroidals was, until recently, a fundamental tenet of the CDM hierarchy to be salvaged at all costs (Kauffmann et al., 1996). Back.
5 A similar analysis was conducted by
Shapley et al., (2005)
at z 2, excluding
the relevant IRAC data.
Back.