


To explain dark matter physicists first turned to astrophysical objects made of ordinary, baryonic matter (the type of matter that we see everyday and is made up of fundamental particles called quarks, which we will discuss in further detail in section IV). Since we know that dark matter must be "dark," possible candidates included brown dwarfs, neutron stars, black holes, and unassociated planets; all of these candidates can be classified as MACHOs (MAssive Compact Halo Objects).
To hunt for these objects two collaborations, the MACHO Collaboration and the EROS-2 Survey, searched for gravitational microlensing (the changing brightness of a distant object due to the interference of a nearby object) caused by possible MACHOs in the Magellanic Clouds. (Other collaborations have studied this as well, such as MOA, OGLE, and SuperMACHO. [7, 8, 9]) The MACHO Collaboration painstakingly observed and statistically analyzed the skies for such lensing; 11.9 million stars were studied, with only 13-17 possible lensing events detected. [10] In April of 2007, the EROS-2 Survey reported even fewer events, observing a sample of 7 million bright stars with only one lensing candidate found. [11] This low number of possible MACHOs can only account for a very small percentage of the non-luminous mass in our galaxy, revealing that most dark matter cannot be strongly concentrated or exist in the form of baryonic astrophysical objects. Although microlensing surveys rule out baryonic objects like brown dwarfs, black holes, and neutron stars in our galactic halo, can other forms of baryonic matter make up the bulk of dark matter? The answer, surprisingly, is no, and the evidence behind this claim comes from Big Bang Nucleosynthesis (BBN) and the Cosmic Microwave Background (CMB).
BBN is a period from a few seconds to a few minutes after the Big Bang
in the early, hot universe when neutrons and protons fused together to
form deuterium, helium, and trace amounts of lithium and other light
elements. In fact, BBN is the largest source of deuterium in the
universe as any deuterium found or produced in stars is almost
immediately destroyed (by fusing it into 4He); thus the
present abundance of deuterium in the universe can be considered a
"lower limit" on the amount of deuterium created by the Big
Bang. Therefore, by considering the deuterium to hydrogen ratio of
distant, primordial-like areas with low levels of elements heavier than
lithium (an indication that these areas have not changed significantly
since the Big Bang), physicists are able to estimate the D/H abundance
directly after BBN (it is useful to look at the ratio of a particular
element's abundance relative to hydrogen). Using nuclear physics and
known reaction rates, BBN elemental abundances can be theoretically
calculated; one of the triumphs of the Big Bang model is the precise
agreement between theory and observational determinations of these light
elemental abundances. Fig. (2) shows
theoretical elemental abundances as calculated with the BBN code nuc123
compared with experimental ranges.
[13]
It turns out that the D/H ratio is
heavily dependent on the overall density of baryons in the universe, so
measuring the D/H abundance gives the overall baryon abundance. This is
usually represented by
 b
h2,
where b
is the baryon density relative to a reference critical density
(
b
h2,
where b
is the baryon density relative to a reference critical density
( c)
and h = H / 100 km
sec-1 Mpc-1 (the reduced Hubble
constant, which is used because of the large historical uncertainty in
the expansion rate of the universe). R. H. Cyburt calculated two
possible values for
b
h2 depending on what deuterium observation is taken:
b
h2 = 0.0229 ± 0.0013
and b
h2 =
0.0216-0.0021+0.0020, both which we will see
accounts for only about 20% of the total matter density.
[12]
c)
and h = H / 100 km
sec-1 Mpc-1 (the reduced Hubble
constant, which is used because of the large historical uncertainty in
the expansion rate of the universe). R. H. Cyburt calculated two
possible values for
b
h2 depending on what deuterium observation is taken:
b
h2 = 0.0229 ± 0.0013
and b
h2 =
0.0216-0.0021+0.0020, both which we will see
accounts for only about 20% of the total matter density.
[12]
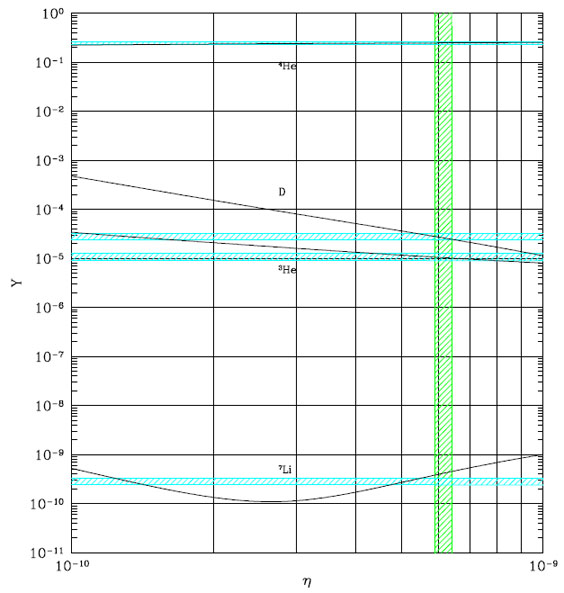 |
Figure 2. Light elemental abundances versus
the photon to baryon ratio,
|
The CMB, discovered by Penzias and Wilson in 1964 (but theorized by others much earlier) as an excess background temperature of about 2.73 K, is another way in which we can learn about the composition of the universe. [14] Immediately after the Big Bang, the universe was an extremely dense plasma of charged particles and photons. This plasma went through an initial rapid expansion, then expanded at a slower, steady rate, and cooled for about 380,000 years until it reached what is known as the epoch of recombination. At this time, neutral atoms were formed, and the universe became transparent to electromagnetic radiation; in other words, photons, once locked to charged particles because of interactions, were now able to travel unimpeded through the universe. The photons released from this "last scattering" exist today as the CMB.
COBE (COsmic Background Explorer) launched in 1989, verified two fundamental properties of the CMB: 1) the CMB is remarkably uniform (2.73 K across the sky) and 2) the CMB, and thus the early universe, is a nearly perfect blackbody (vindicating the use of statistical thermodynamics to describe the early universe). Although the CMB is extraordinarily uniform, COBE's Differential Microwave Radiometer (DMR) discovered in its first year fundamental anisotropies (fluctuations) within the CMB. These fluctuations are due to two different effects. Large scale fluctuations can be attributed to the Sachs-Wolfe effect: in areas that were more dense at the last scattering, lower energy photons were emitted, because they had to escape more powerful potential energy wells than photons from less dense regions. On small scales, the origin of the CMB anisotropies are due to what are called acoustic oscillations. Before photon decoupling, protons and photons can be modeled as a photon-baryon fluid (since electrons are so much less massive than baryons we can effectively ignore them here). This fluid effectively goes through the following cycle: 1) the fluid is compressed as it falls into a gravitational well, 2) the pressure of the fluid increases until it forces the fluid to expand outward, 3) the pressure of the fluid decreases as it expands until gravity pulls it back, and 4) the process repeats until photon decoupling. Depending on the location in the cycle for a portion of the fluid at photon decoupling, the photons which emerge vary in temperature. The fluctuations in the CMB are thus indications of both the initial density perturbations that allowed for the formation of early gravitational wells as well as dynamics of the photon-baryon fluid. In this manner the temperature fluctuations of the CMB are dependent on the amount of baryons in the universe at the time of recombination.
Although the detection of the fluctuations in the CMB was a major accomplishment, the magnitude of the temperature variations puzzled scientists. These fundamental fluctuations in the CMB are incredibly small, only about 30 ± 5 µK, meaning that the CMB is uniform to 1 part in 105. In fact, these fluctuations were too small to have solely accounted for the seeds of structure formation; [15] essentially, given the size of the CMB fluctuations, the structure of the universe we see today would not have had time to form. The problem is time: ordinary matter only becomes charge neutral at the epoch of recombination, and before that, due to electrostatic forces, matter cannot effectively clump into gravitational wells to begin forming structure. The COBE results showed a need for an electrically neutral form of matter that could jump start the structure formation process well before recombination.
WMAP (Wilkinson Microwave Anisotropy Probe) was launched in 2001 with the mission to more precisely measure the anisotropies in the CMB. Located at the Earth-Sun L2 point (about a million miles from Earth), the satellite has taken data continuously (most recently having released an analysis of seven years of operation) and is able to detect temperature variations as small as one millionth of a degree. Due to the increased precision of WMAP (and through the use of computer codes which can calculate the CMB anisotropies given fundamental parameters such as the baryon density) we now know the total and baryonic matter densities from WMAP: [16]
 |
(5) |
where m
h2 is the total matter density, and
b
h2 is the baryonic matter density. The first essential
observation is that these two numbers are different; baryonic matter
is not the only form of matter in the universe. In fact, the dark matter
density,
dm
h2 = 0.1123 ± 0.0035, is around 83% of the total
mass density and corresponds to an average density of
dm
 0.3
GeV/cm3 5
× 10-28 kg/m3. An analysis of the CMB
allows for a
discrimination between dark matter and ordinary matter precisely because
the two components act differently; the dark matter accounts for roughly
90% of the mass, but unlike the baryons, they are not
linked to the photons as part of the "photon-baryon fluid."
Fig. (3) demonstrates this point extremely well;
small shifts in the baryon density result in a CMB anisotropy power
spectrum (a graphical method of depicting the CMB anisotropies) which
are wholly inconsistent with WMAP and other CMB experiment data.
0.3
GeV/cm3 5
× 10-28 kg/m3. An analysis of the CMB
allows for a
discrimination between dark matter and ordinary matter precisely because
the two components act differently; the dark matter accounts for roughly
90% of the mass, but unlike the baryons, they are not
linked to the photons as part of the "photon-baryon fluid."
Fig. (3) demonstrates this point extremely well;
small shifts in the baryon density result in a CMB anisotropy power
spectrum (a graphical method of depicting the CMB anisotropies) which
are wholly inconsistent with WMAP and other CMB experiment data.
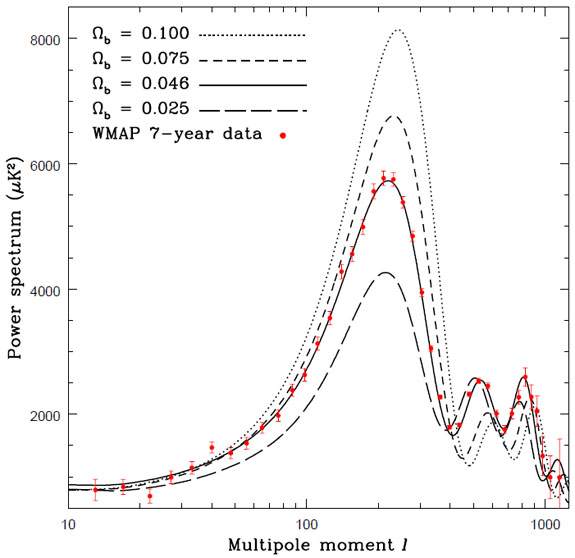 |
Figure 3. The CMB Anisotropy Power Spectrum
for various values of
|
Analyses of the large scale structure of the universe also yield evidence
for dark matter and help break degeneracies present in the CMB data
analysis. By calculating the distance to galaxies using their redshifts,
cosmologists have been able to map out the approximate locations of
more than 1.5 million galaxies. For example, the Sloan Digital Sky Survey
(SDSS) has created 3-D maps of more than 900,000 galaxies, 120,000 quasars,
and 400,000 stars during its eight years of operation.
[17]
In fact, galaxy counts have had a long and important history in
cosmology; in the 1950s and 60s radio galaxy counts provided the earliest,
hard evidence against the Steady State model. But how can galaxy counts
give evidence for dark matter? As discussed earlier, the current
structure in the universe is
due to initial density fluctuations which served as seeds for structure
formation magnified by the presence of dark matter. The most likely
source of these initial density perturbations are quantum fluctuations
magnified by inflation, a period of early rapid exponential growth
approximately 10-35 seconds after the big bang. Under the
assumption that these random fluctuations are Gaussian, a single
function, the power spectrum P(k), is sufficient to
describe the density perturbations. From here a given P(k)
can be used to theoretically calculate large scale structure. The
converse is also true: by measuring large scale structure (galaxy counts
and surveys) one can experimentally determine the power spectrum
P(k). By obtaining the matter
power spectrum from galaxy surveys, the amount of total matter and
baryonic matter can be found: the overall strength of P(k)
is sensitive to the value
of m, and
the amount of baryons has effects on the shape of P(k).
Using these techniques, a final study of the 2dF Galaxy Redshift Survey
power spectrum found
m = 0.231
± 0.021 and
b /
m = 0.185
± 0.046; a study based on data from SDSS yielded
m = 0.286
± 0.018 and
dm
h2 = 0.02267 ± 0.00058.
[18,
19]
Note that these results agree with both CMB and BBN predictions.
N-body simulations of Large Scale Structure are another tool
which have been used to demonstrate the need for dark matter. These
complex simulations often take weeks to complete on superclusters; for
example, MS-II tracked over 10 billion particles which each represent
6.89 × 10⁶ h-1
M in a
volume of (100 h-1 Mpc)3 to study dark
matter halo structure and formation.
[20]
Similarly, di Matteo et al. ran simulations to study the role
of black holes in structure formation using 20-200 million particles in
a volume of (33.75 h-1 Mpc)3 to (50
h-1 Mpc)3.
[21]
N-body simulations confirm the need for dark matter. Simulations
without dark matter do not form the familiar filament and void-type
structures seen in the observable universe by SDSS and other surveys on
the proper timescales. Additionally,
scenarios run in which dark matter is relativistic
or "hot" find that structure formation is retarded or "washed-out"
instead of enhanced; thus not only is dark matter needed, but more
specifically, dark matter must be "cold" or nonrelativistic during
the period of structure formation.
[22,
23]
in a
volume of (100 h-1 Mpc)3 to study dark
matter halo structure and formation.
[20]
Similarly, di Matteo et al. ran simulations to study the role
of black holes in structure formation using 20-200 million particles in
a volume of (33.75 h-1 Mpc)3 to (50
h-1 Mpc)3.
[21]
N-body simulations confirm the need for dark matter. Simulations
without dark matter do not form the familiar filament and void-type
structures seen in the observable universe by SDSS and other surveys on
the proper timescales. Additionally,
scenarios run in which dark matter is relativistic
or "hot" find that structure formation is retarded or "washed-out"
instead of enhanced; thus not only is dark matter needed, but more
specifically, dark matter must be "cold" or nonrelativistic during
the period of structure formation.
[22,
23]
Recent evidence hailed as the "smoking-gun" for dark matter comes from the Bullet cluster, the result of a sub-cluster (the "bullet") colliding with the larger galaxy cluster 1E 0657-56. During the collision, the galaxies within the two clusters passed by each other without interacting (a typical distance between galaxies is approximately one megaparsec, or 3.26 million lightyears). However, the majority of a cluster's baryonic mass exists in the extremely hot gas between galaxies, and the cluster collision (at roughly six million miles per hour) compressed and shock heated this gas; as a result, a huge amount of X-ray radiation was emitted which has been observed by NASA's Chandra X-ray Observatory. Comparing the location of this radiation (an indication of the location of the majority of the baryonic mass in the clusters) to a mapping of weak gravitational lensing (an indication of the location of the majority of the total mass of the clusters) shows an interesting discrepancy; the areas of strong X-ray emission and the largest concentrations of mass seen through gravitational lensing are not the same. The majority of the mass in the clusters is non-baryonic and gravity "points" back to this missing mass. [24]
The galaxy cluster known as MACS J0025.4-1222 is a second example of a powerful collision between two clusters which separated the luminous and dark matter within the two clusters. In mid-2008, Brada c et al. found that the behavior of the matter within this cluster is strikingly similar to the Bullet Cluster; the dark matter passed through the collision while the intergalactic gas interacted and emitted X-rays. These results reaffirmed those of the Bullet Cluster and the need for collisionless dark matter (as well as severely constraining MOND theories (see the Appendix for a brief description of MOND theories). [25]
In May of 2007, NASA's Hubble Space Telescope (HST) detected a ring-like structure of dark matter, caused by another collision of two massive galaxy clusters one to two billion years ago. [26] The dark matter in the two clusters collapsed towards the center, but some of it began to "slosh" back out, causing the ring-shaped structure it now has. Overlapping the distribution of gravitational lensing with the baryonic mass in the combined cluster (just as with the Bullet cluster) shows the largest discrepancy yet between luminous and dark matter.
In early 2009, Penny et al. released results of a study from a HST survey of the Perseus Cluster, which is located about 250 million light years from Earth. They noticed that small, dwarf spheroidal galaxies are stable while larger galaxies are being torn apart by tidal forces caused by the cluster potential, a sign that a significant amount of dark matter may be holding the dwarf galaxies together. By determining the minimum mass required for these dwarf galaxies to survive the cluster potential, Penny et al. were able to calculate the amount of dark matter needed in each galaxy. They specifically studied 25 dwarf spheroidal galaxies within the cluster and found that 12 require dark matter in order to survive the tidal forces at the cluster center.
In conclusion, the evidence for dark matter on scales from dwarf galaxies to clusters to the largest scales in the universe is compelling. There is remarkable agreement between multiple lines of evidence about the need for cold dark matter. Having established the need for dark matter, in the next section we will discuss possible particle candidates for dark matter and how theories beyond the Standard Model are necessary to solve the puzzle.
 . The
horizontal lines show measured abundances of the respective elements
and the vertical lines show the photon to baryon ratio as measured by
WMAP.
. The
horizontal lines show measured abundances of the respective elements
and the vertical lines show the photon to baryon ratio as measured by
WMAP.