


In this section, we review the data mining process. Specifically, as described in Section 1, this data mining review focuses on knowledge discovery in databases (KDD), although our definition of a `database' is somewhat broad, essentially being any machine-readable astronomical data. As a result, this section is arranged algorithmically. To avoid overlap with Section 3 on the astronomical uses, we defer most of the application examples to that section. Nevertheless, all algorithms we describe have been, or are of sufficient maturity that they could immediately be applied to astronomical data. The reader who is expert in astronomy but not in data mining is advised to read this section to gain the full benefit from Section 3. As in any specialized subject, a certain level of jargon is necessary for clarity of expression. Terms likely to be unfamiliar to astronomers not versed in data mining are generally explained as they are introduced, but for additional background we note that there are other useful reviews of the data mining field [5, 6, 7]. Another recent overview of data mining in astronomy by Borne has also been published [8].
The process of data collection encompasses all of the steps required to obtain the desired data in a digital format. Methods of data collection include acquiring and archiving new observations, querying existing databases according to the science problem at hand, and performing as necessary any cross-matching or data combining, a process generically described as data fusion.
A common motivation for cross-matching is the use of multiwavelength data, i.e., data spanning more than one of the regions of the electromagnetic spectrum (gamma ray, X-ray, ultraviolet, optical, infrared, millimeter, and radio). A common method in the absence of a definitive identification for each object spanning the datasets is to use the object's position on the sky with some astrometric tolerance, typically a few arcseconds. Cross-matching can introduce many issues including ambiguous matches, variations of the point spread function (resolution of objects) within or between datasets, differing survey footprints, survey masks, and large amounts of processing time and data transfer requirements when cross-matching large datasets.
A major objective of the Virtual Observatory (VO, Section 4.5) is to make the data collection process more simple and tractable. Future VO webservices are planned that will perform several functions in this area, including cross-matches on large, widely distributed, heterogeneous data.
Common astronomical data formats include FITS [9], a binary format, and plain ASCII, while an emerging format is VOTable [10]. Commonly used formats from other areas of data mining, such as attribute relation file format (ARFF) 1, are generally not widely used in astronomy.
Some data preprocessing may necessarily be part of the data collection process, for example, sample cuts in database queries. Preprocessing can be divided into steps that make the data to be read meaningful, and those that transform the data in some way as appropriate to a given algorithm. Data preprocessing is often problem-dependent, and should be carefully applied because the results of many data mining algorithms can be significantly affected by the input data. A useful overview of data preprocessing is given by Pyle [11].
Algorithms may require the object attributes, i.e., the values in the data fields describing the properties of each object, to be numerical or categorical, the latter being, e.g. `star', or `galaxy'. It is possible to transform numerical data to categorical and vice versa.
A common categorical-to-numerical method is scalarization, in which different possible categorical attributes are given different numerical labels, for example, `star', `galaxy', `quasar' labeled as the vectors [1,0,0], [0,1,0], and [0,0,1], respectively. Note that for some algorithms, one should not label categories as, say, 1, 2 and 3, if the output of the algorithm is such that if it has confused an object between 1 and 3 it labels the object as intermediate, in this case, 2. Here, 2 (galaxy) is certainly not an intermediate case between 1 (star) and 3 (quasar). One common algorithm in which such categorical but not ordered outputs could occur is a decision tree with multiple outputs.
Numerical data can be made categorical by transformations such as binning. The bins may be user-specified, or can be generated optimally from the data [12]. Binning can create numerical issues, including comparing two floating point numbers that should be identical, objects on a bin edge, empty bins, values that cannot be binned such as NaN, or values not within the bin range.
Object attributes may need to be transformed. A common operation is the differencing of magnitudes to create colors. These transformations can introduce their own numerical issues, such as division by zero, or loss of accuracy.
In general, data will contain one or more types of bad values, where the value is not correct. Examples include instances where the value has been set to something such as -9999 or NaN, the value appears correct but has been flagged as bad, or the value is not bad in a formatting sense but is clearly unphysical, perhaps a magnitude of a high value that could not have been detected by the instrument. They may need to be removed either by simply removing the object containing them, ignoring the bad value but using the remaining data, or interpolating a value using other information. Outliers may or may not be excluded, or may be excluded depending on their extremity.
Data may also contain missing values. These values may be genuinely missing, for example in a cross-matched dataset where an object is not detected in a given waveband, or is not in an overlapping region of sky. It is also possible that the data should be present, but are missing for either a known reason, such as a bad camera pixel, a cosmic ray hit, or a reason that is simply not known. Some algorithms cannot be given missing values, which will require either the removal of the object or interpolation of the value from the existing data. The advisability of interpolation is problem-dependent.
As well as bad values, the data may contain values that are correct but are outside the desired range of analysis. The data may therefore need to be sampled. There may simply be a desired range, such as magnitude or position on the sky, or the data may contain values that are correct but are outliers. Outliers may be included, included depending on their extremity (e.g., n standard deviations), downweighted, or excluded. Alternatively, it may be more appropriate to generate a random subsample to produce a smaller dataset.
Outside any normalization of the data prior to its use in the data mining algorithm, for example, calibration using standard sources, input or target attributes of the data will often be further normalized to improve the numerical conditioning of the algorithm. For example, if one axis of the n-dimensional space created by n input attributes encompasses a range that, numerically, is much larger than the other axes, it may dominate the results, or create conditions where very large and small numbers interact, causing loss of accuracy. Normalization can reduce this, and examples include linear transformations, like scaling by a given amount, scaling using the minimum and maximum values so that each attribute is in a given range such as 0-1, or scaling each attribute to have a mean of 0 and a standard deviation of 1. The latter example is known as standardization. A more sophisticated transformation with similar advantages is whitening, in which the values are not only scaled to a similar range, but correlations among the attributes are removed via transformation of their covariance matrix to the identity matrix.
In general, a large number of attributes will be available for each object in a dataset, and not all will be required for the problem. Indeed, use of all attributes may in many cases worsen performance. This is a well-known problem, often called the curse of dimensionality. The large number of attributes results in a high-dimensional space with many low density environments or even empty voids. This makes it difficult to generalize from the data and produce useful new results. One therefore requires some form of dimension reduction, in which one wishes to retain as much of the information as possible, but in fewer attributes. As well as the curse of dimensionality, some algorithms work less well with noisy, irrelevant, or redundant attributes. An example of an irrelevant attribute might be position on the sky for a survey with a uniform mask, because the position would then contain no information, and highly redundant attributes might be a color in the same waveband measured in two apertures.
The most trivial form of dimension reduction is simply to use one's judgement and select a subset of attributes. Depending on the problem this can work well. Nevertheless, one can usually take a more sophisticated and less subjective approach, such as principal component analysis (PCA) [13, 14, 15]. This is straightforward to implement, but is limited to linear relations. It gives, as the principal components, the eigenvectors of the input data, i.e., it picks out the directions which contain the greatest amount of information. Another straightforward approach is forward selection, in which one starts with one attribute and selectively adds new attributes to gain the most information. Or, one can perform the equivalent process but starting with all of the attributes and removing them, known as backward elimination.
In many ways, dimension reduction is similar to classification, in the sense that a larger number of input attributes is reduced to a smaller number of outputs. Many classification schemes in fact directly use PCA. Other dimension reduction methods utilize the same or similar algorithms to those used for the actual data mining: an ANN can perform PCA when set up as an autoencoder, and kernel methods can act as generalizations of PCA. A binary genetic algorithm (Section 2.4.4) can be used in which each individual represents a subset of the training attributes to be used, and the algorithm selects the best subset. The epsilon-approximate nearest neighbor search [16] reduces the dimensionality of nearest neighbor methods. Other methods include information bottleneck [17], which directly uses information theory to optimize the tradeoff between the number of classes and the information contained, Fisher Matrix [18], Independent Component Analysis [19], and wavelet transforms. The curse of dimensionality is likely to worsen in the future for a similar reason to that of missing values, as more multiwavelength datasets become available to be cross-matched. Classification and dimension reduction are not identical of course: a classification algorithm may build a model to represent the data, which is then applied to further examples to predict their classes.
2.4. Selection and Use of Machine Learning Algorithms
Machine learning algorithms broadly divide into supervised and unsupervised methods, also known as predictive and descriptive, respectively. These can be generalized to form semi-supervised methods. Supervised methods rely on a training set 2 of objects for which the target property, for example a classification, is known with confidence. The method is trained on this set of objects, and the resulting mapping is applied to further objects for which the target property is not available. These additional objects constitute the testing set. Typically in astronomy, the target property is spectroscopic, and the input attributes are photometric, thus one can predict properties that would normally require a spectrum for the generally much larger sample of photometric objects. The training set must be representative, i.e., the parameter space covered by the input attributes must span that for which the algorithm is to be used. This might initially seem rather restrictive, but in many cases can be handled by combining datasets. For example, the zCOSMOS redshift survey [20], at one square degree, provides spectra to the depth of the photometric portion of the Sloan Digital Sky Survey (SDSS) [21], r ~ 22 mag, which covers over 8000 square degrees. Since SDSS photometry is available for zCOSMOS objects, one can in principle use the 40,000 zCOSMOS galaxies as a training set to assign photometric redshifts to over 200 million SDSS galaxies.
In contrast to supervised methods, unsupervised methods do not require a training set. This is an advantage in the sense that the data can speak for themselves without preconceptions such as expected classes being imposed. On the other hand, if there is prior information, it is not necessarily incorporated. Unsupervised algorithms usually require some kind of initial input to one or more of the adjustable parameters, and the solution obtained can depend on this input.
Semi-supervised methods attempt to allow the best-of-both-worlds, and both incorporate known priors while allowing objective data interpretation and extrapolation. But given their generality, they can be more complex and difficult to implement. They are of potentially great interest astronomically because they could be used to analyze a full photometric survey beyond the spectroscopic limit, without requiring priors, while at the same time incorporating the prior spectroscopic information where it is available.
The most widely used and well-known machine learning algorithm in astronomy to-date, referred to as far back as the mid 1980s, [22] is the artificial neural network (ANN, Fig. 1) [23, 24, 25]. This consists of a series of interconnected nodes with weighted connections. Each node has an activation function, perhaps a simple threshold, or a sigmoid. Although the original motivation was that the nodes would simulate neurons in the brain, [26, 27] the ANNs in data mining are of such a size that they are best described as nonlinear extensions of conventional statistical methods.
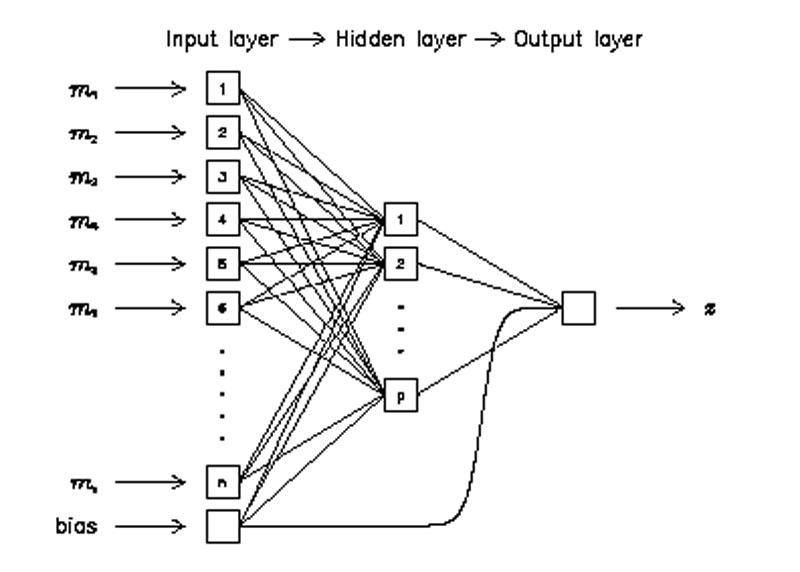 |
Figure 1. Schematic of an artificial neural network for an object with n attributes, a hidden layer of size p, and a single continuously-valued output, in this case, the redshift, z. From Firth, Lahav & Somerville [33]. |
The supervised ANN takes parameters as input and maps them on to one or more outputs. A set of parameter vectors, each vector representing an object and corresponding to a desired output, or target, is presented. Once the network is trained, it can be used to assign an output to an unseen parameter vector. The training uses an algorithm to minimize a cost function. The cost function, c, is commonly of the form of the mean-squared deviation between the actual and desired output:
 |
where ok and tk are the output and target respectively for the kth of N objects.
In general, the neurons could be connected in any topology, but a commonly used form is to have an a: b1 : b2 : ... : bn :c arrangement, where a is the number of input parameters, b1,...,n are the number of neurons in each of n one dimensional `hidden' layers, and c is the number of neurons in the final layer, which is equal to the number of outputs. Each neuron is connected to every neuron in adjacent layers, but not to any others. Multiple outputs can each give the Bayesian a posteriori probability that the output is of that specific class, given the values of the input parameters.
The weights are adjusted by the training algorithm. In astronomy this has typically been either the well-known backpropagation algorithm [28, 29, 30] or the quasi-Newton algorithm [23], although other algorithms, such as Levenberg-Marquardt [31, 32] have also been used.
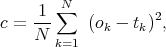
Another common method used in data mining is the decision tree (DT, Fig. 2) [34, 35, 36, 37, 38]. Decision trees consist first of a root node which contains all of the parameters describing the objects in the training set population along with their classifications. A node is split into child nodes using the criterion that minimizes the classification error. This splitting subdivides the parent population group into children population groups, which are assigned to the respective child nodes. The classification error quantifies the accuracy of the classification on the test set. The process is repeated iteratively, resulting in layered nodes that form a tree. The iteration stops when specific user-determined criteria are reached. Possibilities include a minimum allowed population of objects in a node (the minimum decomposition population), the maximum number of nodes between the termination node and the root node (the maximum tree depth), or a required minimum decrease resulting from a population split (the minimum error reduction). The terminal nodes are known as the leaf nodes. The split is tested for each input attribute, and can be axis-parallel, or oblique, which allows for hyperplanes at arbitrary angles in the parameter space. The split statistic can be the midpoint, mean, or median of the attribute values, while the cost function used is typically the variance, as with ANN.
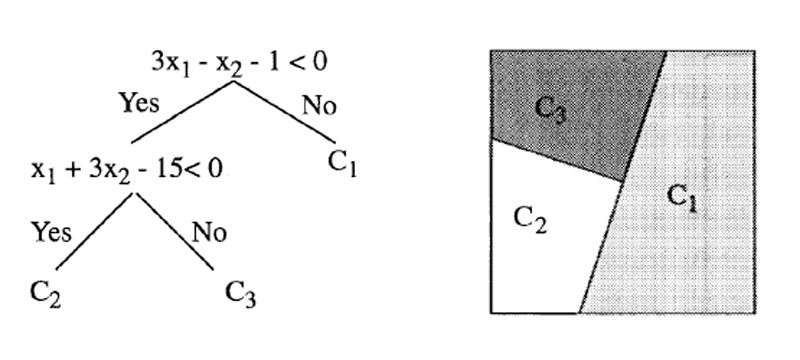 |
Figure 2. As Fig. 1, but showing a decision tree. The oblique planes specified by the division criteria on the input attributes x1 and x2 at the nodes in this case divide the input parameter space into three regions. From Salzberg et al. [39]. |
In recent years, another algorithm, the support vector machine (SVM, Fig. 3) [40, 41, 42, 43, 44, 45, 46, 47, 48], has gained popularity in astronomical data mining. SVM aims to find the hyperplane that best separates two classes of data. The input data are viewed as sets of vectors, and the data points closest to the classification boundary are the support vectors. The algorithm does not create a model of the data, but instead creates the decision boundaries, which are defined in terms of the support vectors. The input attributes are mapped into a higher dimensional space using a kernel so that nonlinear relationships within the data become linear (the `kernel trick') [49], and the decision boundaries, which are linear, are determined in this space. Like ANN and DT, the training algorithm minimizes a cost function, which in this case is the number of incorrect classifications. The algorithm has two adjustable hyperparameters: the width of the kernel, and the regularization, or cost, of classification error, which helps to prevent overfitting (Section 2.5) of the training set. The shape of the kernel is also an adjustable parameter, a common choice being the Gaussian radial basis function. As a result, an SVM has fewer adjustable parameters than an ANN or DT, but because these parameters must be optimized, the training process can still be computationally expensive. SVM is designed to classify objects into two classes. Various refinements exist to support additional classes, and to perform regression, i.e., to supply a continuous output value instead of a classification. Classification probabilities can be output, for example, by using the distance of a data point from the decision boundary.
 |
Figure 3. As Fig. 1,
but showing a support vector machine. The circled points are the
support vectors between the two classes of objects, represented by open
and filled circles. The cases shown are separable and non-separable
data with linear and nonlinear boundaries. w is the normal to
the hyperplane, and b is the perpendicular distance. From
Huertas-Company et al.
[50],
to which the reader is referred for details of
|
Another powerful but computationally intensive method is k nearest neighbor (kNN) [51, 52, 53, 54, 55]. This method is powerful because it can utilize the full information available for each object, with no approximations or interpolations. The training of kNN is in fact trivial: the positions of each of the objects in the input attribute space are simply stored in memory. For each test object, the same attributes are compared to the training set and the output is determined using the properties of the nearest neighbors. The simplest implementation is to output the properties of the single nearest neighbor, but more commonly the weighted sum of k nearest neighbors is used. The weighting is typically the inverse Euclidean distance in the attribute space, but one can also use adaptive distance metrics. The main drawback of this method is that is it computationally intensive, because for each testing object the entire training set must be examined to determine the nearest neighbors. This requires a large number of distance calculations, since the test datasets are often much larger than the training datasets. The workload can be mitigated by storing the training set in an optimized data structure, such as a kd-tree.
However, in the past few years, novel supercomputing hardware (which is discussed in more detail in Section 4.7) has become available that is specifically designed to carry out exactly this kind of computationally intensive work, including applications involving a large number of distance calculations. The curve of growth of this technology exceeds that of conventional CPUs, and thus the direct implementation of kNN using this technology has the potential to exceed the performance of conventional CPUs.
Kernel density estimation (KDE) [56, 57, 58, 59, 60, 61, 62] is a method of estimating the probability density function of a variable. It is a generalization of a histogram where the kernel function is any shape instead of the top-hat function of a histogram bin. This has the advantages that it avoids the discrete nature of the histogram and does not depend on the position of the bin edges, but the width of the kernel must still be chosen so as not to over- or under-smooth the data. A Gaussian kernel is commonly utilized. In higher numbers of dimensions, common in astronomical datasets, the width of the kernel must be specified in each dimension.
K-means clustering [63, 64] is an unsupervised method that divides data into clusters. The number of clusters must be initially specified, but since the algorithm converges rapidly, many starting points can be tested. The algorithm uses a distance criterion for cluster membership, such as the Euclidean distance, and a stopping criterion for iteration, for example, when the cluster membership ceases to change.
Mixture models [65, 66] decompose a distribution into a sum of components, each of which is a probability density function. Often, the distributions are Gaussians, resulting in Gaussian mixture models. They are often used for clustering, but also for density estimation, and they can be optimized using either expectation maximization or Monte Carlo methods. Many astronomical datasets consist of contributions from different populations of objects, which allows mixture modeling to disentangle these population groups. Mixture models based on the EM algorithm have been used in astronomy for this purpose [67, 68].
Expectation maximization (EM) [69, 70, 71] treats the data as a sum of probability distributions, which each represent one cluster. This method alternates between an expectation stage and a maximization stage. In the expectation stage, the algorithm evaluates the membership probability of each data point given the current distribution parameters. In the maximization stage, these probabilities are used to update the parameters. This method works well with missing data, and can be used as the unsupervised component in semi-supervised learning (Section 2.4.3) to provide class labels for the supervised learning.
The Kohonen self-organizing map (SOM) [72, 73] is an unsupervised neural network that forms a general framework for visualizing datasets of more than two dimensions. Unlike many methods which seek to map objects onto a new output space, the SOM is fundamentally topological. This is neatly illustrated by the fact that one astronomical SOM application [74] is titled `Galaxy Morphology Without Classification'. A related earlier method is learning vector quantization [75].
Independent component analysis (ICA) [76, 77, 19, 78, 79], an example of blind source separation, can separate nonlinear components of a dataset, under the assumption that those components are statistically independent. The components are found by maximizing this independence. Related statistical methods include principal component analysis (Section 2.3), singular value decomposition, and non-negative matrix factorization.
The semi-supervised approach [80, 81] has been somewhat underused to-date, but holds great potential for the upcoming, large, purely photometric surveys. Supervised methods require a labeled training set, but will not assign new classes. On the other hand, unsupervised methods do not require training, but do not use existing known information. Semi-supervised methods aim to capture the best from both of these methods by retaining the ability to discover new classes within the data, and also incorporating information from a training set when available. An example of a dataset amenable to the approach is shown in Fig. 4.
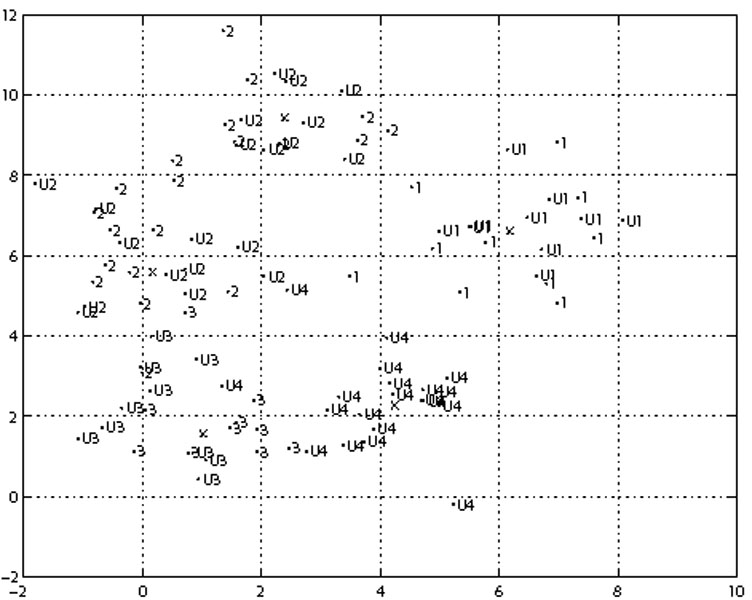 |
Figure 4. Dataset amenable to semi-supervised learning, showing labeled and unlabeled classes, denoted by 1-4 and U1-U4, respectively. The axes are arbitrary units. The crosses result from a mixture model applied to the data. From Bazell & Miller [82]. |
This is particularly relevant in astronomical applications using large amounts of photometric and a more limited subsample of spectroscopic data, which may not be fully representative of the photometric sample. The semi-supervised approach allows one to use the spectral information to extrapolate into the purely photometric regime, thereby allowing a scientist to utilize all of the vast amount of information present there.
Semi-supervised learning represents an entire subfield of data mining research. Given the nontrivial implementation requirements, this field is a good area for potential fruitful collaborations between astronomers, computer scientists, and statisticians. As one example of a possible issue, a lot of photometric data are likely to be a direct continuation in parameter space of spectroscopic data, with, therefore, a highly overlapping distribution. This means that certain semi-supervised approaches will work better than others, because they contain various assumptions about the nature of the labeled and unlabeled data.
In Sections 2.4.1-2.4.2 above, we described the main data mining algorithms used to date in astronomy, however, there are numerous additional algorithms available, which have often been utilized to some extent. These algorithms may be employed at more than one stage in the process, such as attribute selection, as well as the classification/regression stage.
While neural networks in some very broad sense mimic the learning mechanism of the brain, genetic algorithms [83, 84, 85, 86, 87, 88] mimic natural selection, as the most successful individuals created are those that are best adapted for the task at hand.
The simplest implementation is the binary genetic algorithm, in which each `individual' is a vector of ones and zeros, which represent whether or not a particular attribute, e.g., a training set attribute, is used. From an initial random population, the individuals are combined to create new individuals. The fitness of each individual is the resulting error in the training algorithm run according to the formula encoded by the individual. This process is repeated until convergence if found, producing the best individual.
A typical method of combining two individuals is one-point crossover, in
which segments of two individuals are swapped. To more fully explore the
parameter space, and to prevent the algorithm from converging too
rapidly on a local minimum, a probability of mutation is introduced into
the newly created individuals before they are processed. This is simply
the probability that a zero becomes a one, or vice-versa. An approximate
number of individuals to use is given by nin ~
2nf log(nf), where
nf is the number of attributes. The algorithm
converges in nit ~
 nf
log(nf) iterations, where
is a problem-dependent
constant; generally
> 3.
nf
log(nf) iterations, where
is a problem-dependent
constant; generally
> 3.
Numerous refinements to this basic approach exist, including using continuous values instead of binary ones, and more complex methods for combining individuals. Further possibilities for the design of genetic algorithms exist [89], and it is possible in principle to combine the optimization of the learning algorithm and the attribute set.
The Information bottleneck method [17] is based directly on information theory and is designed to achieve the best tradeoff between accuracy and compression for the desired number of classes. The inputs and outputs are probability density functions. Association rule mining [90, 91] is a method of finding qualitative rules within a database such that a rule derived from the occurrence of certain variables together implies something about the occurrence of a variable not used in creating that rule. The false discovery rate [92] is a method of establishing a significant discovery from a smaller set of data than the usual n sigma hypothesis test.
This list could continue, broadening into traditional statistical methods such as least squares, and regression, as well as Bayesian methods, which are widely used in astronomy. For brevity we do not consider these additional methods, but we do note that graphical models [6] are a general way of describing the interrelationships between variables and probabilities, and many of the data mining algorithms described earlier, such as ANNs, are special cases of these models.
Unfortunately, there is no simple method to select the optimal algorithm to use, because the most appropriate algorithm can depend not only on the dataset, but also the application for which it will be employed. There is, therefore, no single best algorithm. Likewise, the choice of software is similarly non-trivial. Many general frameworks exist, for example WEKA [5] or Data to Knowledge [93], but it is unlikely that one framework will be able to perform all steps necessary from raw catalog to desired science result, particularly for large datasets. In Table 1, we summarize some of the advantages and disadvantages of some of the more popular and well-known algorithms used in astronomy. We do not attempt to summarize available software. Various other general comparisons of machine learning algorithms exist [7], as well as numerous studies comparing various algorithms for particular datasets, a field which itself is rather complex [94].
| Algorithm | Advantages | Disadvantages |
| Artificial Neural Network | Good approximation of nonlinear functions | Black-box model |
| Easily parallelized | Local minima | |
| Good predictive power | Many adjustable parameters | |
| Extensively used in astronomy | Affected by noise | |
| Robust to irrelevant or redundant attributes | Can overfit | |
| Long training time | ||
| No missing values | ||
| Decision Tree | Popular real-world data mining algorithm | Can generate large trees that require pruning |
| Can input and output numerical or categorical variables | Generally poorer predictive power than ANN, SVM or kNN | |
| Interpretable model | Can overfit | |
| Robust to outliers, noisy or redundant attributes | Many adjustable parameters | |
| Good computational scalability | ||
| Support Vector Machine | Copes with noise | Harder to classify >2 classes |
| Gives expected error rate | No model is created | |
| Good predictive power | Long training time | |
| Popular algorithm in astronomy | Poor interpretability | |
| Can approximate nonlinear functions | Poor at handling irrelevant attributes | |
| Good scalability with number of attributes | Can overfit | |
| Unique solution (no local minima) | Some adjustable parameters | |
| Nearest Neighbor | Uses all available information | Computationally intensive |
| Does not require training | No model is created | |
| Easily parallelized | Can be affected by noise and irrelevant attributes | |
| Few or no adjustable parameters | ||
| Good predictive power | ||
| Expectation Maximization | Gives number of clusters in the data | Can be biased toward Gaussians |
| Fast convergence | Local minima | |
| Copes with missing data | ||
| Can give class labels for semi-supervised learning | ||
Many of the algorithms previously described involve `greedy' optimization. In these cases, the cost function, which is the measure of how well the algorithm is performing in its classification or prediction task, is minimized in a way that does not allow the value of the function to increase much if at all. As a result, it is possible for the optimization to become trapped in a local minimum, whereby nearby configurations are worse, but better configurations exist in a different region of parameter space. Various approaches exist to overcome local minima. One approach is to simply run the algorithm several times from different starting points. Another approach is simulated annealing [95, 96, 97, 98], where, in following the metallurgical metaphor, the point in parameter space `heats up', thus perturbing it and allowing it to escape from the local minimum. The point is allowed to `cool', thus having the ability to find a solution closer to the global minimum.
Models produced by data mining algorithms are subject to a fundamental limitation common to many systems in which a predictive model is constructed, the bias-variance tradeoff. The bias is the accuracy of the model in describing the data, for example, a linear model might have a higher bias than a higher order polynomial. The variance is the accuracy of this model in describing new data. The higher order polynomial might have a lower bias than a linear model, but it might be more strongly affected by variations in the data and thus have a higher variance. The polynomial has overfit the data. There is usually an optimal point between minimizing bias and minimizing variance. A typical way to minimize overfitting is to measure the performance of the algorithm on a test set, which is not part of the training set, and adjusting the stopping criterion for training to stop at an appropriate location.
To help prevent overfitting, training can also be regularized, in which an extra term is introduced into the cost function to penalize configurations that add complexity, such as large weights in an ANN. This complexity can cause a function to be less smooth, which increases the likelihood of overfitting. As is the case with supervised learning, unsupervised algorithms can also overfit the data, for example, if some kind of smoothing is employed but its scalelength is too small. In this case, the algorithm will `fit the noise' and not the true underlying distribution.
Another common approach to control overfitting and improve confidence in the accuracy of the results is cross-validation, where subsets of the data are left out of the training and used for testing. The simplest form is the holdout method, where a single subset of the training data is kept out of the training, and the algorithm error is evaluated by running on this subset. However, this can have a high bias (see bias-variance tradeoff, above) if the training set is small, due to a significant portion of the training information being left out. K-fold cross-validation improves on this by subdividing the data into K samples and training on K - 1 samples, or alternatively using K random subsets. Typically, K = 5 or K = 10, as small K could still have high bias, as in the holdout method, but large K, while being less biased, can have high variance due to the testing set being small. If K is increased to the size of the dataset, so that each subsample is a single point, the method becomes leave-one-out cross-validation. In all instances, the estimated error is the mean error from those produced by each run in the cross-validation.
Another important refinement to running one algorithm is the ability to use a committee of instances of the algorithm, each with different parameters. One can allow these different instantiations to vote on the final prediction, so that the majority or averaged result becomes the final answer. Such an arrangement can often provide a substantial improvement, because it is more likely that the majority will be closer to the correct answer, and that the answer will be less affected by outliers. One such committee arrangement is bootstrap aggregating, or bagging [99, 5], where random subsamples with replacement (bootstrap samples) are taken, and the algorithm trained on each. The created algorithms vote on the testing set. Bagging is often applied to decision trees with considerable success, but it can be applied to other algorithms. The combination of bagging and the random selection of a small subset of features for splitting at each node is known as a Random Forest [100].
Boosting [7] uses the fact that several `weak' instances of an algorithm can be combined to produce a stronger instance. The weak learners are iteratively added and misclassified objects in the data gain higher weight. Thus boosting is not the same as bagging because the data themselves are weighted. Boosted decision trees are a popular approach, and many different boosting algorithms are available.
As well as committees of the same algorithm, it is also possible to combine the results of more than one different algorithm on the same dataset. Such a mixture of experts approach often provides an optimal result on real data. The outcome may be decided by voting, or the output of one algorithm can form the input to another, in a chaining approach.
For many astronomical applications, the results are, or would be, significantly improved by utilizing the full probability density function (PDF) for a predicted property, rather than simply its single scalar value. This is because much more information is retained when using the PDF. Potential uses of PDFs are described further in Section 4.1.
2.6. Application of Algorithms and Some Limitations
The purpose of this review is not to uncritically champion certain data mining algorithms, but to instead encourage scientific progress by exploiting the full potential of these algorithms in a considered scientific approach. We therefore end this section by outlining some of the limitations of and issues raised by KDD and the data mining approach to current and future astronomical datasets. Several of these problems might be ameliorated by increased collaboration between astronomers and data mining experts.
Extrapolation: In many astronomical applications, it is common for data with less information content to be available for a greater number of objects over a larger parameter space. The classic example is in surveys where photometric objects are typically observed several magnitudes fainter than spectroscopic objects. For a supervised learning algorithm, it is usually inappropriate to extrapolate beyond the parameter space for which the training set (e.g., the spectroscopic objects) is representative.
Non-intuitive results: It is very easy to run an implementation of a well-known algorithm and output a result that appears reasonable, but is in fact either statistically invalid or completely wrong. For example, randomly subsampled training and testing sets from a dataset will overlap and produce a model that overfits the data.
Measurement error: Most astronomical data measurements have an associated error, but most data mining algorithms do not take this explicitly into account. For many algorithms, the intrinsic spread in the data corresponding to the target property is the measurement of the error.
Adjustable parameters: Several algorithms have a significant number of adjustable parameters, and the optimal configuration of these parameters is not obvious. This can result in large parameter sweeps that further increase the computational requirement.
Scalability: Many data mining algorithms scale, for n objects, as n2, or even worse, making their simple application to large datasets on normal computing hardware intractable. One can often speed up a naïve implementation of an algorithm that must access large numbers of data points and their attributes by storing the data in a hierarchical manner so that not all the data need to be searched. A popular hierarchical structure for accomplishing this task is the kd-tree [101]. However, the implementation of such trees for large datasets and on parallel machines remains a difficult problem [102].
Learning Curve: Data mining is an entire field of study in its own right, with strong connections to statistics and computing. The avoidance of some of the issues we present, such as the selection of appropriate algorithms, collaboration where needed, and the full exploitation of their potential for science return, require overcoming a substantial learning curve.
Large datasets: Many astronomical datasets are larger than can be held in machine memory. The exploitation of these datasets thus requires more sophisticated database technology than is currently employed by most astronomical projects.
"It's not science": The success of an astronomical project is judged by the science results produced. The time invested by an astronomer in becoming an expert in data mining techniques must be balanced against the expected science gain. It is difficult to justify and obtain funding based purely on a methodological approach such as data mining, even if such an approach will demonstrably improve the expected science return.
It does not do the science for you: The algorithms will output patterns, but will not necessarily establish which patterns or relationships are important scientifically, or even which are causal. The truism `correlation is not causation' is apt here. The successful interpretation of data mining results is up to the scientist.
1 http://weka.wikispaces.com/ARFF Back.
2 For many astronomical applications, one might more properly call it a training sample, but the term training set is in widespread use, so we use that here to avoid confusion. Back.
 .
.