


We now turn to the future of data mining in astronomy. Several trends are apparent that indicate likely fruitful directions in the next few years. These trends can be used to make informed decisions about upcoming, very large surveys. This section assumes that the reader is somewhat familiar with the concepts in both Sections 2 and 3, namely, with both data mining and astronomy. We once again arrange the topics by data mining algorithm rather than by astronomical application, but we now interweave the algorithms with examples.
As in the past, it is likely that cross-fertilization with other fields will continue to be beneficial to astronomy, and of particular relevance here, the data mining efforts made by these fields. Examples include high energy physics, whose most obvious spinoff is the World Wide Web from CERN, but the subject has an extensive history of extremely large datasets from experiments such as particle colliders, and has provided well-known and commonly used data analysis software such as ROOT [297], designed to cope with these data sizes and first developed in 1994. In the fields of biology and the geosciences, the concepts of informatics, the study of computer-based information systems, have been extensively utilized, creating the subfields of bio- and geoinformatics. The official recognition of an analogous subfield within astronomy, astroinformatics, has recently been recommended [8].
4.1. Probability Density Functions
A probability density function (PDF, Fig. 10) is a function such that the probability that the value, x, is in the interval a < x < b, is the definite integral over the range:
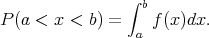 |
Thus the total area under the function is one. PDFs are of great significance for data mining in astronomy because they retain information that is otherwise lost, and because they enable results with improved signal-to-noise from a given dataset. One can think of a PDF as a histogram in the limit of small bins but many objects. Approaches such as supervised learning are in general taking as input the information on objects and providing as output a prediction of properties. The most general way to do this is to work with the full PDFs at each stage. The formalism has recently been demonstrated in an astronomical context by Budavári [271], and it is applicable to the prediction of any astronomical property. For inputs a,b,c,..., the output probabilities of a set of properties, P(x,y,z,...) can be predicted. Fully probabilistic cross-matching of surveys has also been implemented by the same author [298].
 |
Figure 10. Example photometric redshift probability density functions (PDFs) for galaxies, showing the rich content of extra information compared to a single value, or value plus Gaussian error. The horizontal axes, z, are the photometric redshifts, and the vertical are the probability densities. The solid red and dotted blue lines are the PDF with and without the photometric uncertainties, respectively, and the vertical dashed green lines are, in these cases, the true distances. From Budavári [271]. |
Results with PDFs in photo-zs are starting to appear, either with single values and a spread, or the full PDF. Cunha et al. [299] show that full PDFs help reduce bias. Margoniner & Wittman [300] show that they enable subsamples with improved signal-to-noise, and Wittman [301] also demonstrates reduction in error. Ball et al. [261] show that generating full photo-z PDFs for quasars allows subsection of a sample virtually free of catastrophic failures, the first time this has been demonstrated, and an important result for their use as tracers of the large scale structure in the universe. Wolf [280] confirms a similar result. Myers, White & Ball [302] show that using the full PDF for clustering measurements will improve the signal-to-noise by four to five times for a given dataset without any alteration of the data (< ahref="#Figure 11">Fig. 11). This method is applicable to the clustering of any astronomical object. Full PDFs have also been shown to improve performance in the photometric detection of galaxy clusters [303], again due to the increased signal-to-noise ratio. Several further efforts use a single photo-z and a spread, but not the full PDF. However, the method of Myers, White & Ball shows that it is the full PDF that will give the most benefit. PDFs will also be important for weak lensing [300].
As well as photo-zs, predicting properties naturally incorporates probabilistic classification. Progress has been made, e.g., the SDSS has been classified according to P(galaxy, star, neither) [126]. Similar classifications that could be made are P(star formation, AGN) and P(quasar, not quasar). Bailer-Jones et al. [304] implement probabilistic classification that emphasizes finding very rare objects, in this case quasars among the stars that will be seen by Gaia.
Ball et al. [261] generate a PDF by perturbing inputs for a single-neighbor kNN. The idea of perturbing data has been studied in the field of Privacy Preserving Data Mining [305, 306], but here the aim is to generate a PDF using the errors on the input attributes in a way that is computationally scalable to upcoming datasets. The approach appears to work well despite the fact that at present, survey photometric errors are generally poorly characterized [307]. Proper characterization of errors will be of great importance to future surveys as the probabilistic approach becomes more important. Scalability may be best implemented either by using kd-tree like data structures, or by direct implementation on novel supercomputing hardware such as FPGA, GPU, or Cell processors (Section 4.7), which can provide enormous performance benefits for applications that require a large number of distance calculations.
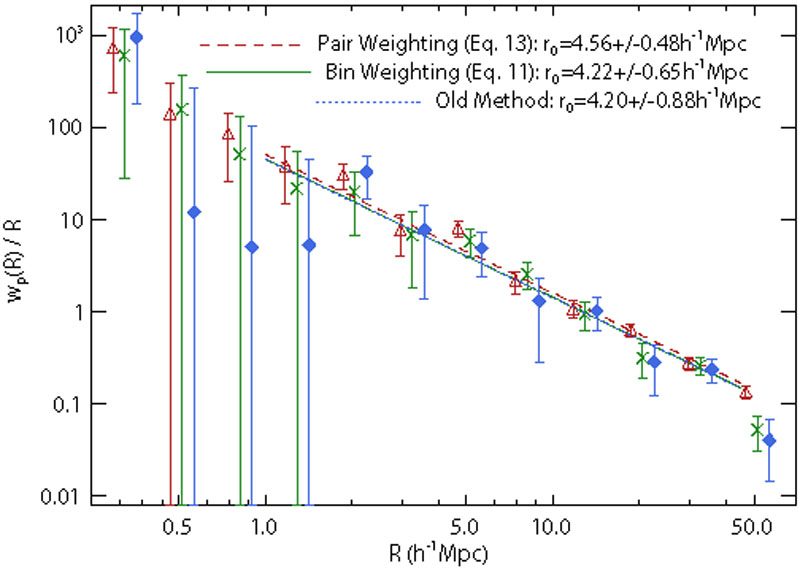 |
Figure 11. Improvement in the signal-to-noise ratio of the clustering signal of quasars enabled by PDFs. The improvements to the projected correlation function (vertical axis) enabled by utilizing PDFs are shown by the green crosses and red triangles, compared to the old method, based on single-valued photometric redshifts, shown by blue diamonds. The horizontal axis is the projected radial distance between objects. The diagonal lines are power-law fits, with scale length r0, to the correlation function. The points are offset for clarity. From Myers, White & Ball [302]. |
4.2. Real-Time Processing and the Time Domain
The time domain is already a significant area of study and will become increasingly important over the next decade with the advent of large scale synoptic surveys such as the Large Synoptic Survey Telescope (LSST) [308]. A large number of temporal resolved observations over large areas of the sky remains an unexplored area, and the historical precedent suggests that many interesting phenomena remain to be discovered [286].
However, as one might expect, this field presents a number of challenges not encountered in the data mining of static objects. These include (i) how to handle multiple observations of objects that can vary in irregular and unpredictable ways, both intrinsic and due to the observational equipment, (ii) objects in difference images (the static background is subtracted, leaving the variation), (iii) the necessarily extremely rapid response to certain events such as gamma ray bursts where physical information can be lost mere seconds after an event becomes detectable, (iv) robust classification of large streams of data in real time, (v) lack of previous information on several phenomena, and (vi) the volume and storage of time domain information in databases. Other challenges are seen in static data, but will assume increased importance as real-time accuracy is needed. For example, the removal of artifacts [309] that might otherwise be flagged as unusual objects and incur expensive follow-up telescope time. Variability will be both photometric, a change in brightness, and astrometric, because objects can move. While some astronomical phenomena, such as certain types of variable stars, vary in a regular way, others vary in a nonlinear, irregular, stochastic, or chaotic manner, and the variability itself can change with time (heteroskedasticity) [310]. Time series analysis is a well developed area of statistics, and many of these techniques will be useful.
The combination of available information, but incomplete coverage of the possible phenomena suggests that a probabilistic (Section 4.1) approach [311], either involving priors, or semi-supervised (Section 2.4.3) will in general be the most appropriate. This is because the algorithms can use the existing information, but objectively interpret new phenomena. Supervised learning will perform better for problems where more information and larger datasets are available, and unsupervised or Bayesian priors will perform better when there are fewer observations. Many events will still require followup observations, but since there will be far more events than can ever be followed up in detail, data mining algorithms will help ensure that the observations made are optimal in terms of the targeted scientific results.
As a confederation of data archives and interoperable standards of many of the world's existing telescopes, the Virtual Observatory (VO, Section 4.5) will be crucial in meeting the challenge of the time domain, and significant infrastructure for the VO already exists. The VOEventNet [312] is a system for the rapid handling of real time events, and provides an online federated data stream of events from several telescopes. It can be followed by both human observers and robotic telescopes.
Numerous next-generation wide-field surveys in the planning or construction stages will be synoptic. The largest such survey in the optical is the LSST, which will observe the entire sky, visible from its location, every three nights. These observations will provide a data stream exceeding one petabyte per year, and, as a result, they anticipate many of the challenges described here [313]. Like LSST [314], the Gaia satellite [315] has working groups dedicated to data mining. The Classification Working Group has employed several data mining techniques, and developed new approaches [316, 304] to be used when the survey comes online. Other ongoing or upcoming synoptic surveys include Palomar-Quest [317], the Catalina Real-Time Transient Survey [318], Pan-STARRS [319], and those at other wavelengths such as instruments leading up to and including the Square Kilometer Array [320].
The time domain will not only provide challenges to existing methods of data mining, but will open up new avenues for the extraction of information, such as using the variability of objects for classification [321] or photometric redshift [322]. Because they are due to a relatively compact source in the center of galaxies, active galactic nuclei vary on much shorter timescales than normal galaxies. This variability has been proposed as a mechanism to select quasar and other AGN candidates. Other events are suspected theoretically but have not been observed [323]. But given the dataset sizes, automated detection of such events at some level is clearly required. The computational demands of real time processing of the enormous data streams from these surveys is significant, and will likely be met by the use of newly emerging specialized computing hardware (Section 4.7).
The current state of the art in supercomputing consists of terabyte-sized files and teraflop computing speeds, which is conveniently encapsulated in the term terascale computing. Following Moore's law [324], in which computer performance has increased exponentially for the last several decades, the coming decade will feature the similarly-derived petascale computing [325]. Much of the performance increase in the past decade has been driven by increases in processor (CPU) clock frequency, but this rate has now slowed due to physical limitations on the sizes of components, and more importantly power consumption and energy (heat) dissipation. It has therefore become more economical to manufacture chips with multiple processor cores.
The typical supercomputer today is a cluster, which consists of a large number of conventional CPUs connected by a specialized interconnect system, a distributed or shared memory, a shared filesystem, and hosting the Linux operating system. Many systems are heterogeneous because this is scalable and cost-effective, but coordinating and making effective such a system can be challenging. In particular, it will be vital that the system is properly balanced between processing power and disk input/output (I/O) to supply the data. Combined with the increasing number of processor cores, this means that parallel and distributed computing is rapidly increasing in importance.
A useful set of `rules of thumb' for parallel and other aspects of computing were formulated by Amdahl in the 1960s [326], and they remain true today. One of these is that roughly 50,000 CPU cycles are required per byte of data. Most scientific datasets require far fewer cycles than this, and it is thus likely that future performance will be I/O limited, unless sufficient disks are provided in parallel. Bell, Gray & Szalay [1] estimate that a petascale system will require 100,000 one TB disks. The exact details of how to distribute the data for best performance are likely to be system-dependent [68]. The available CPU speed should scale to the data size, although it will not scale to most naïvely implemented data mining algorithms (Section 4.4).
An example of an upcoming petascale system whose uses will include astronomical data mining is the Blue Waters 4 system at the National Center for Supercomputing Applications (NCSA), which is due to come online in 2011. Specifications include 200,000 compute cores with 4 GHz 8 core processors, 1 PB of main memory, 10 PB of user disk storage, 500 PB of archival storage, and 400 GB s-1 bandwidth connectivity to provide sustained petascale compute power. It will implement the IBM PERCS (Productive, Easy-to-use, Reliable Computer System) [327], which will integrate their CPU, operating system, parallel programming, and file systems. This provides a method of addressing the issues of running real-world applications at the petascale by balancing the CPU, I/O, networking, and so on. Similarly, a considerable investment of effort is being carried out in the years leading up to deployment in 2011 on the development of applications for the system, in consultation with the scientists who will run them. Several astronomical applications are included, mostly simulations, but also data mining in the form of the analysis of LSST datasets.
Not all petascale computing will be done on systems as large as Blue Waters. In the US, the National Science Foundation Office of Cyberinfrastructure has been advised [1] to implement a power-law type system, with a small number of very large systems, of order ten times more regional centers, and ten times more local facilities (Tiers 1-3). Such local facilities, for example Beowulf clusters, are already common in university departments, and consist of typically a few dozen commodity machines. A recent trend matching the increasing requirements for data-intensive as opposed to CPU-intensive computing is the GrayWulf cluster [328], which implements the idea of data `storage bricks': cheap, modular, and portable versions of a balanced system which when added together provide petascale computation.
4.4. Parallel and Distributed Data Mining
As indicated in Section 4.3 above, because of the slowing increase in raw speed of individual CPUs, processors are becoming increasingly parallelized, both in terms of the number of processor cores on a single chip, and increasing amounts of these chips being deployed in parallel on supercomputing clusters. Providing appropriately scaled systems (CPU, I/O, etc.) is one challenge, but most data mining algorithms not only will be required to run on petascale data, but their naïve implementations scale as N2, or worse. It has been suggested [329] that any algorithm that scales beyond N log N will rapidly be rendered infeasible.
McConnell and Skillicorn [330] have promoted parallel and distributed data mining [331, 332, 333, 334], which is well-known in the data mining field, but virtually unused in astronomy. In this approach, the algorithms explicitly take advantage of available parallelism. The simplest example is task-farming, or the embarrassingly parallel approach, in which a task is divided into many mutually-independent subtasks, each of which is allocated to a single processor. This can be done on an array of ordinary desktop machines as well as a supercomputer. A more complex challenge is when many parts of the data must be accessed, or when an algorithm relies on the outputs from calculations distributed across multiple compute nodes. For a large dataset the hardware required likely includes shared memory (Section 4.3), thus shared memory parallelization [335] can be important. Many algorithms exist for the implementation of data mining on parallel computer systems beyond simple task farming, but these are not widely used within science, as compared to the commercial sector. The application programming interfaces MPI and OpenMP have been widely used on distributed and shared memory systems, respectively, for simulation and some data analysis, but they do not offer the semantic capabilities [336] needed for data mining, i.e., the metadata describing the meaning of the data being processed and the results produced are not easily incorporated.
Parallel data mining is challenging, as not only must the algorithm be implemented on the hardware, but many algorithms simply cannot be ported as-is to such a system. Instead, parallelization requires that the algorithm itself, as encapsulated in the code, must often be fundamentally altered at the pseudocode level. This can be a time-consuming and counterintuitive process, especially to scientists who are generally not trained or experienced in parallel programming. Progress is slowly being made in astronomy, including a parallel implementation of kd-trees [102], cosmological simulations requiring datasets larger than the node memory size [337], and parallelization of algorithms [338].
An alternative approach is grid computing, in which the exact resource used is unimportant to the user, although not all data mining algorithms lend themselves to this paradigm. A variant of grid computing is crowdsourcing, in which members of the public volunteer their spare CPU cycles to process data for a project. The most well-known project of this type is SETI@Home, and more recently, the Galaxy Zoo project, which employed large numbers of people to successfully classify galaxies in SDSS images. Such crowdsourcing is likely to become even more important in the future, particularly in combination with greatly improved outreach via astronomical applications on social networking sites such as Facebook [339].
Scalability is also helped on conventional CPUs by the employment of tree structures, such as the kd-tree, which partition the data. This enables a search to access any data value without searching the whole dataset. Kd-trees have been used for many astronomical applications, including speeding up N-point correlation functions [340]; cross-matching, classification, and photometric redshifts [341]. They can be extended to more sophisticated structures, for example, the multi-tree [342]. However, implementation of such tree structures on parallel hardware or computational accelerators (Section 4.7) remains difficult [102].
The Virtual Observatory (VO) is an analogous concept to a physical observatory, but instead of telescopes, various centers house data archives. The VO consists of numerous national-level organizations, and the International Virtual Observatory Alliance. Within the national organizations there are various data centers that house large datasets, computing facilities to process and analyze them, and people with considerable expertise in the datasets stored at that particular center.
Common data standards and web services are necessary for the VO to work. Such standards have emerged, including web services using XML and SOAP, a data format, VOTable [10], a query language based on SQL, the Astronomical Data Query Language [343], image access protocols for images (SIAP [343]), and spectra (SSAP) 5, VOEventNet [312] for the time domain, plus various standards of interoperability and ways of describing resources such as the Unified Content Descriptor [344]. Large numbers of high level tools for working with data are also available 6.
An example of the emerging data standards for archiving is the Common Archive Observation Model [345] (CAOM) of the Canadian Astronomical Data Center (CADC). Given that it is likely that the future VO will continue to consist of a number of data centers like the CADC, this model represents a useful and realistic way in which data can be made meaningfully accessible, but not so rigidly presented as to prevent the desired analysis of future researchers with as yet unforeseen science goals. This model consists of the components Artifact, Plane, SimpleObservation, and CompositeObservation, which describe logical parts of the data from individual files to logical sets of observations such as spectra, and forms the basis of all archiving activity at the CADC.
The increasing immobility of large datasets as described in Section 4.3 will render it uneconomical in terms of time and money to download large datasets to local machines. Rather than bringing the data to the analysis, it will become more sensible to take the analysis to the data [346]. To be able to perform complicated data mining analyses, it is necessary that the data be organized well enough to make this tractable, and that the center archiving the data must have sufficient computing power and web services to perform the analyses. The organizational requirement means that the data must be stored as a database with the sophistication found in the commercial sector, where mining of terascale databases is routine. Commercial software and computer science expertise will help, but the task is non-trivial because astronomical data analysis can require particular data types and structures not usually found in commercial software, such as time series observations. An example of such a database already in place is the SDSS, and its underlying schema [347] has been used and copied by other surveys such as GALEX.
Nevertheless, it is likely that considerable analyses will continue to be carried out on smaller subsets of the data, and this data may well continue to be downloaded and analyzed locally, as it has been to date. If one anticipates working exclusively with one survey, it may still be more efficient to implement a GrayWulf-like cluster locally and download the complete dataset.
Another difficult problem faced by the VO is that a significant future scientific benefit from large datasets will be in the cross-matching of multiple datasets, in particular, multiwavelength data. But if such data are distributed among different data centers and are difficult to move, such work may be intractable. What can be done, however, is to make available as part of the VO web services, tools for cross-matching datasets at a given center. A common data format and description, combined with the fact that much of the science is done from small subsets of large datasets, means that this is certainly tractable. As a result, it is not surprising that there is significant demand for such tools [348].
An important consideration for the VO is that many astronomers, indeed many scientists in general, will want to run their own software on the data, and not simply a higher level tool that involves trusting someone else's code. This will be true even if the source code is available. Or, a scientist might wish to complete an analysis that is not available in a higher level tool. It is thus important that the data are available at a low level of processing so that one can set one's own requirements as needed. NASA has a categorization of data where 0 is raw, 1 is calibrated, and 2 is a derived product, such as a catalog. An ideal data archive would have available well documented and accessible level 2 catalogs, similarly documented and accessible level 1 data, and perhaps not online but stored level 0 data, to enable, for example, a re-reduction.
Data have been released using the VO publishing interfaces [349], data mining algorithms such as ANNs have been implemented [350], and applications for analyses with web interfaces are online [351]. Multiwavelength analyses are becoming more feasible and useful [348], and it is therefore now possible, but still time-consuming, to perform scientific analyses using VO tools [352]. We expect this will be an area where considerable work will still need to be done, however, in order to fully enable the full exploitation of the archives of astronomy data in the future.
Visualization of data is an important part of the scientific process, and the combination of terascale computing and data mining poses obvious challenges. Common plotting codes presently in use in astronomy include SuperMongo 7, PGPlot 8, Gnuplot 9, and IDL 10 [353], but these are stand-alone codes that do not easily cope with data that cannot be completely loaded into the available memory space. Newer tools, such as TOPCAT [354], VisIVO [355], and VOMegaPlot [356] support the Virtual Observatory standards such as VOTable and PLASTIC [357] for interoperability between programs. The full library on which the TOPCAT program is based, STILTS [358], is able to plot arbitrarily-sized datasets.
As with hardware, software, and data analysis, collaboration with computer scientists and other disciplines has resulted in progress in various areas of scientific visualization. At Harvard, the AstroMed project at the Initiative for Innovative Computing (IIC) has collaborated with medical imaging teams [359]. The rendering of complex multi-dimensional volumetric and surficial data is a common desire of both fields, and the medical imaging software was considerably more advanced than was typical in astronomy in terms of graphical capability. As with the creation and curation of databases for large datasets, collaboration with the IT sector has enabled significant progress and the use of tools beyond the scope of those that could be created by astronomers alone, such as Google Sky [360]. It is likely that such collaboration will continue to increase in importance.
The program S2Plot [361], developed at Swinburne, is motivated by the idea of making three-dimensional plots as easy to transfer from one medium to another (interchange) as two-dimensional plots. The existing familiar interface of a plotting code, in this case PGPlot, has been extended [362] to enable rendering of multi-dimensional data on several media, including desktop machines, PDF files, Powerpoint-style slides, or web pages. Systems in which the user is able to interact directly with the data are also likely to play a significant role. Partiview [363], developed at NCSA, enables the visualization of particulate data and some isosurfaces either on a desktop or in an immersive CAVE system, and several astronomical datasets have been visualized. Szalay, Springel & Lemson [364] describe using graphical processing units (Section 4.7) to aid visualization, in which the data are preprocessed to hierarchical levels of detail, and only rendered to the resolution required to appear to the eye as if the whole dataset is being rendered. Paraview 11 is a program designed for parallel processing on large datasets using distributed memory systems, or on smaller data on a desktop.
Finally, in recent years, numerous online virtual worlds have become popular, the most well-known of which is Second Life. Hut [365] and Djorgovski 12 describe their interaction within these worlds, both with other astronomers in the form of avatars in meetings, and with datasets. While it may initially seem to be just a gimmicky way to have a meeting, the interaction with other avatars is described as `fundamentally visceral', much more so than one would expect. This suggests that, along with social networks for outreach, such interaction among astronomers may become more common, as one will be able to attend a meeting without having to travel physically.
4.7. Novel Supercomputing Hardware
For the final part of Section 4, we turn to novel supercomputing hardware. This is a rapidly developing area, but it has enormous potential to speed up existing analyses, and render previously impossible questions tractable. Specialized hardware has been used in astronomy for many years, but until recently only in limited contexts and applications, such as the GRAPE [366] systems designed specifically for n-body calculations, or direct processing of data in instrument-specific hardware. Here, we describe three hardware formats that have emerged in recent years as viable solutions to a more general range of astronomical problems: graphical processing units (GPUs), field-programmable gate arrays (FPGAs), and the Cell processor.
As described in Section 4.3, the increasing speed of CPU clock cycles has now been largely replaced by increasing parallelism as the main method for continuing improvements in computing power. The methods described there implement coarse-grained parallelism, which is at the level of separate pieces of hardware or application processes. The hardware described here implements fine-grained parallelism, in which, at the instruction level, a calculation that would require multiple operations on a CPU is implemented in one operation. The hardware forms an intermediary between the previously-used application-specific integrated circuits (ASIC), and the general purpose CPU.
Future petascale machines (Section 4.3) are likely to include some or all of these three, either as highly integrated components in a cluster-type system, or as part of the heterogeneous hardware making up a distributed grid-like system that has overall petascale performance.
Spurred by the computer gaming industry, the GPUs on graphics cards within desktop-scale computers have increased in performance much more rapidly than conventional processors (CPUs). They are specially designed to be very fast at carrying out huge numbers of operations that are used in the rendering of graphics, by using vector datatypes and streaming the data. Vector processors have been used before in supercomputing, but GPUs have become of great interest to the scientific community due to their commodity-level pricing, which results from their widespread commercial use, and the increasing ease of use for more general operations than certain graphical processes.
At first, GPUs dealt only with fixed-point numbers, but now single-precision floating point and even double-precision are becoming more common. Thus the chips are no longer simply specialized graphics engines, but are becoming much more general-purpose (GPGPUs). Double-precision is required or highly desirable for many scientific applications. The ease of use of GPUs has been increased thanks to NVidia's Compute Unified Device Architecture development environment (CUDA) 13 for its cards, and will be further aided by the Open Computing Language (OpenCL) 14 for heterogeneous environments. These enable the GPU functions to be called in a similar way to a C library, and are becoming a de facto standard. CUDA has also been ported to other higher level languages, including PyCUDA in Python.
GPUs are beginning to be used in astronomy, and several applications have appeared. GPUs can reproduce the functionality of the GRAPE hardware for n-body simulations [367], and CUDA implementations have been shown to outperform GRAPE in some circumstances [368]. GPUs are beginning to be used for real-time processing of data from next generation instruments [369] as part of the Data Intensive Science Consortium at the Harvard IIC. Significant speedup has been demonstrated of a k nearest neighbor search on a GPU compared to a kd-tree implemented in C on a CPU [370].
FPGAs [371, 372] are another form of hardware that has become viable for somewhat general-purpose scientific computing. While FPGAs have been widely used as specialized hardware for many years, including in telescopes for data processing or adaptive optics, it is only in the past few years that their speed, cost, capacity, and ease of use have made them viable for more general use by non-specialists. As with GPUs, the ability to work with full double precision floating point numbers is also increasing, and their use is via libraries and development environments that enable the FPGA portion of the code to appear as just another function call in C or a C-like language. These tools implement the hardware description language to program the FPGA, which need not be known by the user.
An FPGA consists of a grid of logic gates which must be programmed via software to implement a specific set of functions before running code (hence field-programmable). If the calculation to be performed can be fully represented in this way on the available gates, this enables a throughput speed of one whole calculation of a function per clock cycle, which given a modern FPGA's clock speed of 100 MHz or more, is 100 million per second. In practice, however, the actual speed is often limited by the I/O.
One recent example is the direct mapping of an ANN onto an FPGA [373], which can then in principle classify one object per clock cycle, or 100 million objects per second at 100 MHz. FPGAs will continue to be widely used as specialized components for astronomical systems, for example in providing real-time processing of the next generation synoptic surveys. Brunner, Kindratenko & Myers [338] demonstrated a significant speedup of the N-point correlation function using FPGAs. Freeman, Weeks & Austin [374] directly implement distance calculations, such as required by the kNN data mining algorithm, on an FPGA.
Finally, the IBM Cell processor [375] is a chip containing a conventional CPU and and array of eight more powerful coprocessors for hardware acceleration in a similar manner to the GPU and FPGA. Like the NVidia GPU, it has been widely used in mass-production machines such as the Playstation 3, and is or will be incorporated into several `hybrid' petascale machines, including IBM's Roadrunner, and possibly Blue Waters. Unfortunately, also like the GPU, it is not yet as easy to use as desired for large scale scientific use, but progress in the area is continuing.
Further novel supercomputing hardware such as ClearSpeed may become viable for science and widely used. It is an area of exciting developments and considerable potential. As with many new developments, however, one must be somewhat careful, in this case because the continued development of the hardware is driven by large commercial companies (NVidia, IBM, etc.), and not the scientific community. Nevertheless, the potential scientific gains are so large that it is certainly worth keeping an eye on.
4 http://www.ncsa.uiuc.edu/BlueWaters Back.
5 http://www.ivoa.net/Documents Back.
7 http://www.astro.princeton.edu/~rhl/sm Back.
8 http://www.astro.caltech.edu/~tjp/pgplot Back.
9 http://www.gnuplot.info Back.
10 http://idlastro.gsfc.nasa.gov/ Back.
11 http://www.paraview.org Back.
12 http://blogs.discovermagazine.com/cosmicvariance/2008/11/03/guest-post-george-djorgovski-a-new-world-overture Back.
13 http://www.nvidia.com/cuda Back.
14 http://www.khronos.org/opencl Back.