Copyright © 2012 by Annual Reviews. All rights reserved
| Annu. Rev. Astron. Astrophys. 2012. 50:531-608
Copyright © 2012 by Annual Reviews. All rights reserved |


5.1. The Milky Way as a Star-forming Galaxy
As our nearest example, the Milky Way (hereafter denoted as MW) has obvious advantages in studies of star formation in galaxies. However, living inside the MW presents serious problems of distance determination and selection effects, compared to studies of other galaxies. We can "look in from the outside" only with the aid of models. After reviewing surveys briefly, we consider properties of gas and star formation within the MW, bearing in mind the issues raised in § 2.4 and § 3, first as a whole, and then the radial distribution, and finally some notes on non-axisymmetric structure.
Recent and ongoing surveys of the Galactic Plane at multiple wavelengths are revitalizing the study of the MW as a galaxy. Surveys of HI from both northern (Taylor et al. 2003) and southern (McClure-Griffiths et al. 2005) hemispheres, along with a finer resolution survey of parts of the Galactic Plane (Stil et al. 2006) have given a much clearer picture of the atomic gas in the MW (for a review of HI surveys, see Kalberla & Kerp 2009). Based on these surveys, properties of the cool atomic clouds have been analyzed by Dickey et al. (2003).
Numerous surveys of the MW have been obtained in CO J = 1 → 0 (e.g., Dame et al. 2001; Bronfman et al. 1988; Clemens et al. 1988). A survey of the inner part of the MW in 13CO (Jackson et al. 2006) has helped with some of problems caused by optical depth in the main isotopologue.
Surveys for tracers of star formation have been made in radio continuum (free-free) emission (Altenhoff et al. 1970) and recombination lines (Anderson et al. 2011; Lockman 1989), in water masers (Cesaroni et al. 1988; Walsh et al. 2011), and methanol masers (Pestalozzi et al. 2005; Green et al. 2009). In addition to being signposts of (mostly massive) star formation, the masers provide targets for astrometric studies using VLBI.
Complementary surveys of clouds have been done using mid-infrared extinction (e.g., Perault et al. 1996; Egan et al. 1998; Peretto & Fuller 2009), which can identify Infrared Dark Clouds (IRDCs) against the Galactic background emission. The MIPSGAL survey (Carey et al. 2009) should also provide a catalog of very opaque objects. At longer wavelengths, the dust is usually in emission, and millimeter continuum emission from dust (e.g., Aguirre et al. 2011; Rosolowsky et al. 2010; Schuller et al. 2009) provides a different sample of objects.
Each method has its own selection effects and efforts are ongoing to bring these into a common framework. A key ingredient is to determine the distances, using spectral lines and methods to break the distance ambiguity in the inner galaxy; initial work is underway (Russeil et al. 2011; Schlingman et al. 2011; Dunham et al. 2011b; Foster et al. 2011). Ultimately, these studies should lead to a better definition of the total amount and distribution of dense gas (§ 1.2). The Herschel HIGAL survey (Molinari et al. 2010) will add wavelengths into the far-infrared and lead to a far more complete picture. Quantities like LFIR / Mcloud and LFIR / Mdense, as used in extragalactic studies, can be calculated for large samples.
5.1.2. The Milky Way as a Whole
The Milky Way is a barred spiral galaxy (Burton 1988; Dame et al. 2001; Benjamin et al. 2005). The number and position of spiral arms are still topics for debate, but the best currently available data favor a grand-design, two-armed, barred spiral with several secondary arms. A conception of what the MW would look like from the outside (Churchwell et al. 2009) is shown in Figure 5. We can expect continuing improvements in the model of the MW as VLBI astrometry improves distance determinations of star forming regions across the MW (Reid et al. 2009; Brunthaler et al. 2011). As we will be comparing the MW to NGC 6946, we also show images of that galaxy at Hα, 24 µm, HI, and CO J = 2 → 1 in Fig. 6.
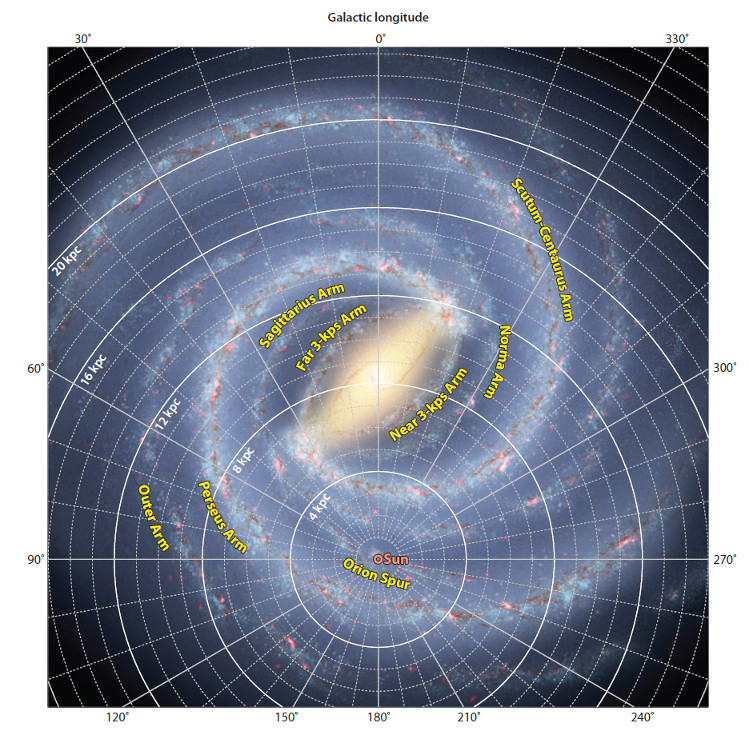 |
Figure 5. Sketch of approximately how the Galaxy is likely to appear viewed face-on, with Galactic coordinates overlaid and the locations of spiral arms and the Sun indicated. The image is based on data obtained from the literature at radio, infrared, and visible wavelengths. As viewed from a great distance, our Galaxy would appear to be a grand-design two-armed barred spiral with several secondary arms: The main arms are the Scutum-Centaurus and Perseus, and the secondary arms are Sagittarius, the outer arm, and the 3-kpc expanding arm. Adapted by R. Benjamin from a figure originally made by R. Hurt of the Spitzer Science Center in consultation with R. Benjamin at the University of Wisconsin-Whitewater and available in Churchwell et al. (2009). The original figure appeared in the Publications of the Astronomical Society of the Pacific, Copyright 2009, Astron. Soc. Pac.; reproduced with permission of the Editors. |
 |
Figure 6. High-resolution maps of star-formation tracers and cold-gas components in NGC 6946. (Top left) Spitzer 24-µm dust emission from the SINGS/KINGFISH Project (Kennicutt et al. 2011), (top right) Hα emission from Knapen et al. (2004), (bottom left) HI emission from the VLA THINGS Survey (Walter et al. 2008), and (bottom right) CO J = 2 → 1 emission from the HERACLES Survey (Walter et al. 2008). Note that the HI map extends over a much wider area than the CO, Hα, and 24-µm observations. |
Based on a model including dark matter (Kalberla & Kerp 2009; Kalberla et al. 2007; Kalberla & Dedes 2008), the MW mass within 60 kpc of the center is M(tot) = 4.6 × 10¹¹ M⊙, with M(baryon) = 9.5 × 10¹⁰ M⊙. The total mass of atomic gas (HI plus He) is M(atomic) = 8 × 10⁹ M⊙, and the warm ionized medium contains M(WIM) = 2 × 10⁹ M⊙. The mass fraction of the HIM (§ 2.1) is negligible. With a (perhaps high) estimate for the molecular mass of M(mol) = 2.5 × 10⁹ M⊙, Kalberla & Kerp (2009) derive a gas to baryon ratio of 0.13. As explained in § 5.1.3, for consistent comparison to the radial distribution in NGC 6946, we will use a constant X(CO) = 2.0 × 10²⁰, correct for helium, and assume an outer radius of the star forming disk of 13.5 kpc to define masses, surface densities, etc. Within = 13.5 kpc, M(mol) = 1.6 × 10⁹ M⊙ and M(atomic) = 5.0 × 10⁹ M⊙ with these conventions.
The volume filling factor of the CNM is about 1% (Cox 2005) and that of molecular clouds, as traced by the 13CO survey (Roman-Duval et al. 2010), has been estimated at about 0.5% (M. Heyer, personal communication) in the inner galaxy, but much lower overall. Denser (n ~ few × 103 cm-3) structures found in millimeter continuum surveys, roughly corresponding to clumps, appear to have a surface filling factor of 10-4 and a volume filling factor of about 10-6 (M. K. Dunham, personal communication), but better estimates should be available soon.
The star formation rate of the MW has been estimated from
counting HII regions, which can be seen across the
MW and extrapolating to lower mass stars
(Mezger 1987;
McKee
& Williams 1997;
Murray
& Rahman 2010).
These methods average over the effective lifetime of
massive stars, about 3-10 Myr
(Table 1).
Estimates of  *
from a model of the total far-infrared emission of the
MW (e.g.,
Misiriotis et al. 2006)
are somewhat less sensitive to the high end of the IMF
(§ 3) and average over a longer time.
An alternative approach, based on counting likely YSOs in the GLIMPSE
survey of the Galactic plane
(Robitaille & Whitney 2010)
is much less biased toward the most massive stars,
but is limited by sensitivity, issues of identification
of YSOs, and models of extinction.
Chomiuk & Povich (2011)
have recently reviewed all methods
of computing *
for the MW and conclude that they are consistent
with *
= 1.9± 0.4 M⊙ yr-1. However they
conclude that resolved star counts give SFRs that are factors of 2-3
times higher (see § 6.4 for
further discussion).
*
from a model of the total far-infrared emission of the
MW (e.g.,
Misiriotis et al. 2006)
are somewhat less sensitive to the high end of the IMF
(§ 3) and average over a longer time.
An alternative approach, based on counting likely YSOs in the GLIMPSE
survey of the Galactic plane
(Robitaille & Whitney 2010)
is much less biased toward the most massive stars,
but is limited by sensitivity, issues of identification
of YSOs, and models of extinction.
Chomiuk & Povich (2011)
have recently reviewed all methods
of computing *
for the MW and conclude that they are consistent
with *
= 1.9± 0.4 M⊙ yr-1. However they
conclude that resolved star counts give SFRs that are factors of 2-3
times higher (see § 6.4 for
further discussion).
With a radius of active star formation of 13.5 kpc
(§ 5.1.3),
* = 1.9
M⊙ yr-1 yields ⟨Σ(SFR)⟩
= 3.3 × 10⁻³ M⊙ yr-1
kpc-2. Taking M(mol, < 13.5) = 1.6 ×
109 M⊙,
tdep = 0.8 Gyr, 10 times longer than
⟨tdep⟩ in local clouds
(§ 4.1).
For all the gas in the (60 kpc) MW,
tdep = 6.6 Gyr, or 5.5 Gyr if the WIM is excluded.
If we attribute all non-gaseous baryons in the
Kalberla & Kerp (2009)
model (8.25 × 10¹⁰ M⊙) to stars and
stellar remnants, ignore recycling, and take an age of 1 ×
1010 yr, we would derive an average
star formation rate of 8.25 M⊙ yr-1, about
4 times the current rate.
The MW also offers a wide range of conditions, from the far outer Galaxy to the vicinity of the Galactic Center, for detailed study. The hurdle to overcome, especially in the inner MW, is to assign accurate distances. The radial distributions of atomic and molecular gas, along with the star formation rate surface density (here in units of M⊙ Gyr-1 pc-2), are plotted in Figure 7, along with a similar plot for NGC 6946 (Schruba et al. 2011). For consistency, we have used the same X(CO) and correction for helium (for both molecular and atomic gas) as did Schruba et al. (2011). These distributions for the MW have considerable uncertainties, and should be taken with appropriate cautions, especially in the innermost regions, as discussed below. Misiriotis et al. (2006) presents a collection of estimates of Σ(SFR) and a model. They all show a steady decline outward from a peak at ~ 5 kpc, but the situation in the innermost galaxy is unclear. The data on HII regions that forms the basis of most estimates are very old, and a fresh determination of Σ(SFR)(Rgal) is needed.
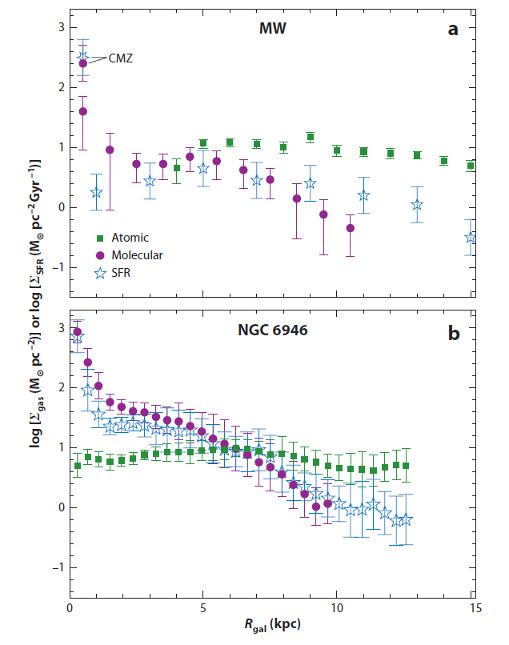 |
Figure 7. (a) The radial distribution of surface densities of atomic gas, molecular gas, and star-formation rate (SFR) for the Milky Way (MW). The atomic data were supplied by P. Kaberla, (Kalberla & Dedes 2008), but we corrected for helium. The discontinuity around 8.5 kpc reflects the inability to model Hi near the solar circle. The molecular data are taken from table 1 in Nakanishi & Sofue (2006) but scaled up to be consistent with the bottom panel, using X(CO) = 2.0 × 10²⁰ and multiplying by 1.36 to include helium. The molecular surface density in the innermost bin is highly uncertain and may be overestimated by using a constant value of X(CO) (§ 2.4). The Σ(SFR) is read from figure 8 in Misiriotis et al. (2006), but it traces back through a complex history to Guesten & Mezger (1982), who used radio continuum emission from Hii regions. That result was then scaled to the latest estimate of total SFR in the MW of 1.9 M⊙ year-1 (Chomiuk & Povich 2011). Separate points for Σmol and Σ(SFR) are plotted for the Central Molecular Zone (CMZ) (Rgal < 250 pc). An uncertainty of 0.3 was assigned arbitrarily to the values of log Σ(SFR). (b) Same as panel a, but for NGC 6946. It is based on a figure in Schruba et al. (2011) but modified by A. Schruba to show radius in kiloparsecs for ready comparison to the plot for the MW. Reproduced by permission of the AAS. All gas distributions for both galaxies include a correction for helium. |
In comparison, NGC 6946 has a similar, rather flat, distribution of atomic gas, with Σ(atomic) ~ 10 M⊙ pc-2. The molecular gas distribution is similar to that of the MW, except for a clearer and stronger peak within Rgal = 2 kpc. The distribution of Σ(SFR) follows the molecular gas in both galaxies, more clearly so in NGC 6946.
We discuss the MW distributions from the outside, moving inward. The average surface density of molecular gas drops precipitously beyond 13.5 kpc, after a local peak in the Perseus arm (Heyer et al. 1998), as does the stellar density (Ruphy et al. 1996), thereby defining the far outer Galaxy, and the radius used in our whole Galaxy quantities (§ 5.1.2). The atomic surface density also begins to drop around 13-17 kpc, following an exponential with scale length 3.74 kpc (Kalberla & Kerp 2009). Molecular clouds in the far outer galaxy are rare, but can be found with large-scale surveys. Star formation does continue in the rare molecular clouds (Wouterloot & Brand 1989), and Figure 7 would suggest a higher ratio of star formation to molecular gas, but there are issues of incompleteness in the outer galaxy. A study of individual regions (Snell et al. 2002) found a value of LFIR / M similar to that for the inner Galaxy. They conclude that the star formation process within a cloud is not distinguishable from that in the inner Galaxy; the low global rate of star formation is set by the inefficient conversion of atomic to molecular gas in the far outer Galaxy. This result is consistent with the results of Schruba et al. (2011) for other galaxies, as exemplified by NGC 6946.
Inside about 13 kpc, the atomic surface density is roughly constant at 10-15 M⊙ pc-2, while the average molecular surface density increases sharply, passing 1 M⊙ pc-2 somewhere near the solar neighborhood (Dame et al. 2001), to a local maximum around = 4-5 kpc (Nakanishi & Sofue 2006). After a small decrease inside 4 kpc, the surface density rises sharply within = 1 kpc. Nakanishi & Sofue (2006) and thus Figure 7 use a constant X(CO), which could overestimate the molecular mass near the center (§ 2.4).
The innermost part of the MW, < 250 pc, known as the Central
Molecular Zone (CMZ), potentially provides an opportunity for a
close look at conditions in galactic nuclei without current AGN
activity, provided that the issues of non-circular motions,
foreground and background confusion, and possible changes in X(CO)
(Oka
et al. 1998)
can be overcome. Despite their conclusion that X(CO) is lower,
Oka et
al. (1998)
argue that the CMZ has a molecular mass of 2-6 × 10⁷
M⊙.
Analysis of dust emission yields a mass of 5 × 10⁷
M⊙
(Pierce-Price et al. 2000),
which leads to Σgas = 250 M⊙
pc-2 for the CMZ.
A TIR luminosity of 4 × 10⁸ L⊙
(Sodroski et al. 1997)
for the CMZ would imply
* ~ 0.06
M⊙ yr-1
using the conversion in Table 1,
roughly consistent with other recent estimates
(Immer
et al. 2012),
based on analysis of point infrared sources, but
new data from the surveys mentioned above should allow
refinement of these numbers. Evidence for variations in star formation rate
on short timescales is discussed by
Yusef-Zadeh et al. (2009).
Using * =
0.06 M⊙ yr-1 and = 0.25 kpc for
the CMZ, Σ(SFR) = 300 M⊙ Gyr-1
pc-2. These values of Σmol and
Σ(SFR) for the CMZ are
plotted separately in Figure 7 and identified as
"CMZ." If correct, the CMZ of the MW begins to look a bit more like
the inner few kpc of NGC 6946.
The CMZ provides an excellent place to test scaling relations, including
those for dense gas, in detail, if the complicating issues can be
understood. Preliminary results suggest that Σ(SFR) is
similar to that expected from Σmol (see
Fig. 7), but lower than expected
from dense gas relations (S. Longmore, personal communcation).
The properties of clouds and clumps also may vary with . Heyer et al. (2009) reanalyzed cloud properties in the inner Galaxy based on CO and 13CO surveys. For the area of the cloud defined roughly by the 1 K CO detection threshold, he found a median Σmol(cloud) = 42 M⊙ pc-2 for clouds, substantially less than originally found by Solomon et al. (1987), and only a few clouds have Σmol(cloud) > 100 M⊙ pc-2. Analysis based on detection thresholds for 13CO yield a median Σmol(13CO clump) = 144 M⊙ pc-2 for "13CO clumps" (Roman-Duval et al. 2010, who refer to them, however as clouds). The mean in 0.5 kpc bins of surface density per 13CO clump is roughly constant at 180 M⊙ pc-2 from = 3 to 6.6 kpc, beyond which it drops sharply toward the much lower values in the solar neighborhood. Assuming the region sampled is representative, Roman-Duval et al. (2010) have plotted the azimuthally averaged surface density of 13CO clumps versus Galactocentric radius; it peaks at 2.5 M⊙ pc-2 at 4.5 kpc, declining to < 0.5 M⊙ pc-2 beyond 6.5 kpc. The clouds do appear to be associated with spiral arms, so azimuthal averaging should be taken with caution. The cloud mass function of 246 clouds in the far outer galaxy has a power-law slope of αcloud = -1.88, similar to but slightly steeper than that found inside the solar circle (§ 2.5) and a maximum mass of about 104 M⊙ (Snell et al. 2002). The lower value for the maximum mass of a cloud seems to result in a concomitant limit on the number of stars formed in a cluster, but no change is inferred for the intrinsic IMF (Casassus et al. 2000). A piece of a spiral arm at Rgal = 15 kpc has been recently identified in HI and CO, containing a molecular cloud with M = 5 × 10⁴ M⊙ (Dame & Thaddeus 2011).
5.1.4. Non-axisymmetric Structure
The molecular gas surface density shows a strong local maximum around = 4.5 kpc in the northern surveys (Galactic quadrants I and II), while southern surveys (quadrants III and IV) show a relatively flat distribution of Σmol from about 2 to 7 kpc (Bronfman et al. 2000). This asymmetry is likely associated with spiral structure (Nakanishi & Sofue 2006) and a long (half-length of 4.4 kpc) bar (Benjamin et al. 2005). The star formation rate, measured from LFIR, does not, however, reflect this asymmetry; in fact, it is larger in quadrant IV than in I, suggesting a star formation efficiency up to twice as high, despite the lower peak Σmol (Bronfman et al. 2000). Interestingly, the distribution of denser gas, traced by millimeter-wave dust continuum emission (Beuther et al. 2012), is also symmetric on kpc scales, but asymmetries appear within the CMZ region (Bally et al. 2010). Major concentrations of molecular clouds with very active star formation appear to be associated with regions of low shear (Luna et al. 2006), and with the junction of the bar and spiral arms (Nguyen Luong et al. 2011).
5.2. Demographics of Star-Forming Galaxies Today
The recent influx of multi-wavelength data has expanded the richness of information available on global star formation properties of galaxies, and transformed the interpretive framework from one based on morphological types to a quantitative foundation based on galaxy luminosities, masses, and other physical properties.
The role of galaxy mass as a fundamental determinant of the star formation history of a galaxy has been long recognized (e.g., Gavazzi & Scodeggio 1996), but data from SDSS and subsequent surveys have reshaped our picture of the population of star-forming galaxies (e.g., Kauffmann et al. 2003; Baldry et al. 2004; Baldry et al. 2006; Brinchmann et al. 2004). The integrated colors of galaxies, which are sensitive to their star formation histories, show a strongly bimodal dependence on stellar mass, with a relatively tight "red sequence" populated by galaxies with little or no current star formation, and a somewhat broader "blue sequence" or "blue cloud" of actively star-forming galaxies. The dominant population shifts from blue to red near a transition stellar mass of ~ 3 × 10¹⁰ M⊙ (Kauffmann et al. 2003). The relative dearth of galaxies in the "green valley" between the red and blue sequences suggests a deeper underlying physical bimodality in the galaxy population and a rapid evolution of galaxies from blue to red sequences.
A similar bimodality characterizes the mass dependence of the SFR per unit galaxy mass (SSFR). The mass dependence of the SSFR has been explored by numerous investigators (e.g., Brinchmann et al. 2004; Salim et al. 2007; Schiminovich et al. 2007; Lee et al. 2007). Figure 8 shows an example from Schiminovich et al. (2007), based in this case on dust-corrected FUV measurements of SDSS galaxies.
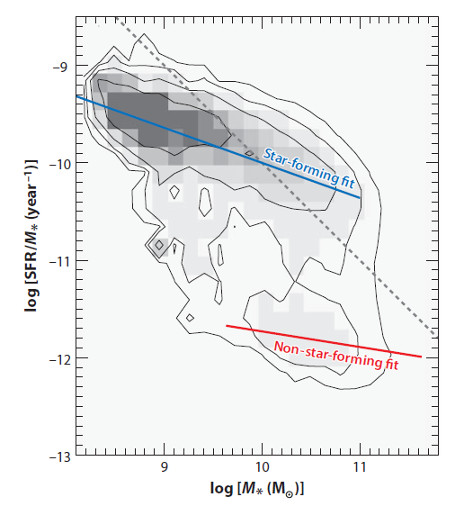 |
Figure 8. Relation between a specific
star-formation rate (SFR)
( |
A clear separation between the blue and red sequences is evident, and the dispersion of SSFRs within the blue sequence is surprisingly small, suggesting that some kind of self-regulation mechanism may be at work among the actively star-forming galaxies. The bimodality is not absolute; there is a clear tail of less active but significantly star forming galaxies between the two sequences. These represent a combination of relatively inactive (usually early-type) disk galaxies and unusually active spheroid-dominated systems (§ 5.4). The sharp increase in the fraction of inactive galaxies above stellar masses of order a few times 1010 M⊙ is also seen.
The blue sequence in Figure 8 is not horizontal; the SSFR clearly increases with decreasing galaxy mass. The slope (-0.36 for the data in Figure 8) varies somewhat between different studies, possibly reflecting the effects of different sampling biases. The negative slope implies that lower-mass galaxies are forming a relatively higher fraction of their stellar mass today, and thus must have formed relatively fewer of their stars (compared to more massive galaxies) in the past. The most straightforward explanation is that the dominant star-forming galaxy population in the Universe has gradually migrated from more massive to less massive galaxies over cosmic time. Direct evidence for this "downsizing" is seen in observations of the SSFR vs mass relation in high-redshift galaxies (e.g., Noeske et al. 2007).
Another instructive way to examine the statistical properties of star-forming galaxies is to compare absolute SFRs and SFRs normalized by mass or area. Several interesting trends can be seen in Figure 9, which plots integrated measurements of the SFR per unit area as a function of the absolute SFRs. The first is the extraordinary range in SFRs, more than seven orders of magnitude, whether measured in absolute terms or normalized per unit area or (not shown) galaxy mass. Much of this range is contributed by non-equilibrium systems (starbursts). Normal galaxies occupy a relatively tight range of SFRs per unit area, reminiscent of the tightness of the blue sequence when expressed in terms of SSFRs. The total SFRs of the quiescent star-forming galaxies are also tightly bounded below a value of ~ 20 M⊙ yr-1. Starburst galaxies, and infrared-luminous and ultraluminous systems in particular, comprise most of the galaxies in the upper 2-3 decades of absolute SFRs and Σ(SFR).
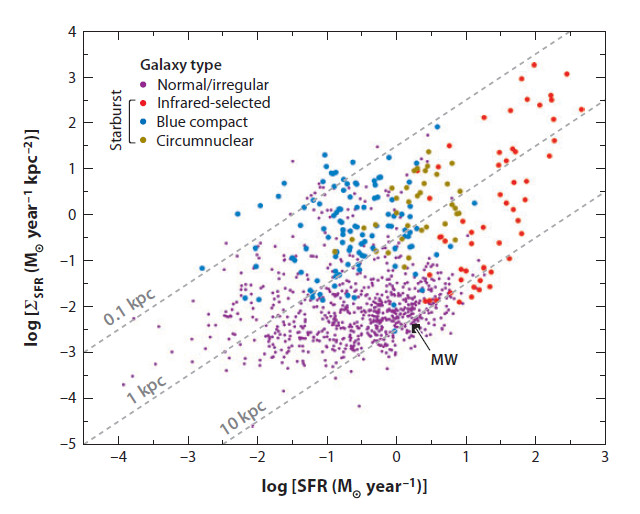 |
Figure 9. Distribution of integrated star-formation properties of galaxies in the local Universe. Each point represents an individual galaxy or starburst region, with the average star-formation rate (SFR) per unit area (SFR intensity) plotted as a function of the absolute SFR. The SFR intensities are averaged over the area of the main star-forming region rather than the photometric area of the disk. Diagonal gray lines show loci of constant star-formation radii, from 0.1 kpc (top) to 10 kpc (bottom). Several subpopulations of galaxies are shown: normal disk and irregular galaxies measured in Hα and corrected for dust attenuation (solid purple points) from the surveys of Gavazzi et al. (2003), James et al. (2004), Hameed & Devereux (2005), and Kennicutt et al. (2008); luminous and ultraluminous infrared galaxies (LIRGs and ULIRGs, respectively) (red points) from Dopita et al. (2002) and Scoville et al. (2000); blue compact starburst galaxies measured in Hα (blue points) from Pérez-González et al. (2003) and Gil de Paz et al. (2005); and circumnuclear starforming rings in local barred galaxies measured in Paα (dark yellow points) as compiled by Kormendy & Kennicutt (2004). The position of the MilkyWay (black square) lies near the high end of normal spirals in total SFR, but it is near the average in Σ(SFR) (§ 5.1). The relative numbers of galaxies plotted does not reflect their relative space densities. In particular, the brightest starburst galaxies are extremely rare. |
The distribution of SFRs along the X-axis of Figure 9 (after correcting for volume completeness biases) is simply the SFR distribution function (e.g., Gallego et al. 1995; Martin et al. 2005b). Figure 10 shows a recent determination of this distribution from Bothwell et al. (2011), based on flux-limited UV and TIR samples of galaxies and SFRs derived using the methods of Hao et al. (2011), and corrections for AGN contamination following Wu et al. (2010b; 2011). The SFR function is well fitted by a Schechter (1976) exponentially truncated power-law, with a faint-end slope α = -1.5 and characteristic SFR, SFR* = 9 M⊙. Although SFRs as high as ~ 1000 M⊙ yr-1 are found in present-day ULIRGs, the contribution of LIRGs and ULIRGs to the aggregate star formation today is small (< 10% also see Goto et al. 2011). Steady-state star formation in galaxies dominates today. The value of SFR* increases rapidly with z, and galaxies with Lbol > 1011 L⊙ (i.e., LIRGs) become dominant by redshifts z > 1 (e.g., Le Floc'h et al. 2005). This change partly reflects an increase in merger-driven star formation at higher redshift, but at early epochs even the steady-state star formation in massive galaxies attained levels of order tens to hundreds of solar masses per year, thus placing those galaxies in the LIRG and ULIRG regime. This suggests that most of the decrease in the cosmic SFR in recent epochs has been driven by downsizing in the level of steady-state star formation (e.g., Bell et al. 2005; Jogee et al. 2009).
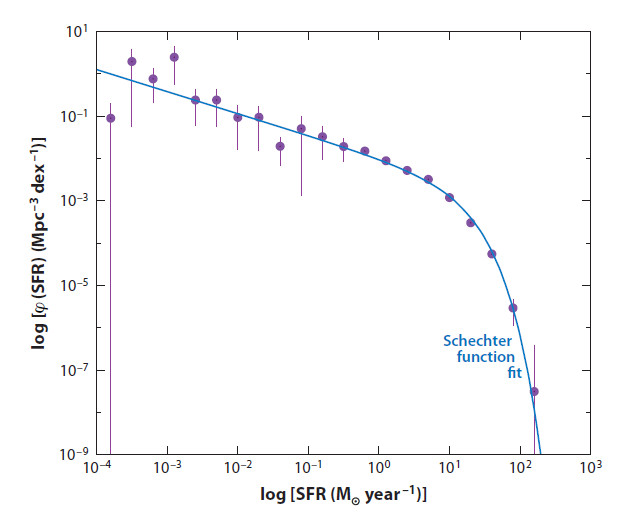 |
Figure 10. Volume-corrected star-formation-rate (SFR) distribution function for disk and irregular galaxies in the local Universe, as derived from a combination of large flux-limited ultraviolet and infrared catalogs and a multiwavelength survey of the local 11-Mpc volume. Vertical lines indicate uncertainties due to finite sampling; these are especially important for low SFRs where the statistics are dominated by dwarf galaxies that can be observed only over small volumes. Statistics on gas-poor (elliptical, dwarf spheroidal) galaxies are not included in this study. The blue line shows a maximum-likelihood Schechter function fit, as described in the text. Figure is original, but similar to one in Bothwell et al. (2011). |
5.3. The High-Density Regime: Starbursts
As highlighted in § 1.2, the starburst phenomenon encompasses a wide range of physical scales and host galaxy properties, and no precise physical definition of a starburst has been placed into wide use. Part of the explanation can be seen in Fig. 9; although the most extreme starburst galaxies have properties that are well separated from those of normal star-forming galaxies, there is no clear physical break in properties; starbursts instead define the upper tails of the overall distributions in SFRs within the general galaxy population.
Much of the attention in this area continues to focus on the infrared-luminous and ultraluminous systems, because they probe star formation in the most extreme high-density circumnuclear environments seen in the local Universe. A major breakthrough in recent years has been the use of mid-infrared spectroscopy to distinguish dust heated by massive stars from that heated by a buried AGN (e.g., Genzel et al. 1998; Laurent et al. 2000; Dale et al. 2006; Armus et al. 2007). Regions heated by AGNs are distinguished by the appearance of highly ionized atomic species, as well as suppressed mid-infrared PAH emission relative to stellar-heated dust. Application of these diagnostics has made it possible to construct clean samples of LIRGs and ULIRGs that are dominated by star formation.
With the Spitzer and Herschel observatories, it has been possible to extend imaging and spectroscopy of the most luminous infrared-emitting galaxies to intermediate redshifts (e.g., Elbaz et al. 2005; Yan et al. 2007). As mentioned earlier the fraction of star formation in LIRGs and ULIRGs increases sharply with redshift, but imaging and spectroscopy of these objects reveals a marked shift in the physical characteristics of the population. Whereas at low redshift, ULIRGs (and many LIRGs) are dominated by very compact circumnuclear starbursts triggered by mergers, at higher redshifts the LIRG/ULIRG population becomes increasingly dominated by large disk galaxies with extended star formation. As a consequence of cosmic downsizing (i.e., "upsizing" with increasing redshift), by redshifts z ~ 1 the populations of LIRGs and ULIRGs become increasingly dominated by the progenitors of present-day normal galaxies, rather than by the transient merger-driven starbursts which dominate the present-day populations of ULIRGs, though examples of the latter are still found, especially in the population of submillimeter-luminous galaxies (SMGs) (e.g., Chapman et al. 2005).
Visible-wavelength observations of these high-redshift galaxies with IFU instruments, both with and without adaptive optics correction, have revealed many insights into the physical nature of this population of starburst galaxies (e.g., Genzel et al. 2008; Genzel et al. 2011; Förster Schreiber et al. 2009 and references therein). The Hα kinematics show a wide range of properties, from normal, differentially rotating disks to disturbed disks, and a subset with signatures of ongoing or recent mergers. The disks tend to be characterized by unusually high velocity dispersions, which have been interpreted as reflecting a combination of dynamical instability and possibly energy injection into the ISM from young stars. Further discussion of high-redshift galaxies is beyond the scope of this article, but we shall return to the cold ISM properties and SFRs of these galaxies in § 6.
5.4. The Low SFR and Low Density Regimes
One of the most important discoveries from the GALEX mission was the detection of low levels of star formation in environments which were often thought to have been devoid of star formation. These include early-type galaxies, dwarf galaxies, low surface brightness galaxies, and the extreme outer disks of many normal galaxies.
Although star formation had been detected occasionally in nearby elliptical and S0 galaxies (e.g., Pogge & Eskridge 1993), most of these galaxies have historically been regarded as being "red and dead" in terms of recent star formation. Deep GALEX imaging of E/S0 galaxies (e.g., Kaviraj et al. 2007), however, has revealed that approximately 30% of these early-type galaxies exhibit near-ultraviolet emission in excess of what could reasonably arise from an evolved stellar population (e.g., Kaviraj et al. 2007). Confirmation of the star formation has come from visible-wavelength IFU spectroscopy, as exploited for example by the SAURON survey (Shapiro et al. 2010). The SFRs in these galaxies tend to be very low, with at most 1-3% of the stellar mass formed over the past Gyr. High-resolution UV imaging with HST often reveals extended star-forming rings or spiral arms in these galaxies (Salim & Rich 2010). Follow-up CO observations of these galaxies reveals significant detections of molecular gas in a large fraction of the galaxies with detected star formation, with molecular gas masses of 107 - 1010 M⊙ (Combes et al. 2007; Crocker et al. 2011), and with SFRs roughly consistent with the Schmidt law seen in normal galaxies.
The GALEX images also reveal that star formation in more gas-rich disk galaxies often extends much farther in radius than had previously been appreciated. In exceptional cases (e.g., NGC 5236=M83, NGC 4625) the star formation extends to 3-4 times the normal R25 optical radius, to the edge of the HI disk (Thilker et al. 2005; Gil de Paz et al. 2005). A systematic study by Thilker et al. (2007) reveals that extended "XUV disks" are found in ~ 20% of spiral galaxies, with less distinct outer UV structures seen in another ~ 10% of disk galaxies. Follow-up deep Hα imaging and/or spectroscopy reveals extended disks of HII regions that trace the UV emission in most cases (e.g., Zaritsky & Christlein 2007; Christlein et al. 2010; Goddard et al. 2010), confirming the earlier detection of HII regions at large radii (e.g., Ferguson et al. 1998; Ryan-Weber et al. 2004). Individual examples of extended UV features without Hα counterparts are sometimes found, however (Goddard et al. 2010). The GALEX images also have led to a breakthrough in measurements of star formation in low surface brightness spiral galaxies (LSBs). These provide a homogeneous body of deep measurements of the star formation and the nature of the star formation law at low surface densities (§ 6; Wyder et al. 2009). Comparison to the outer MW (§ 5.1) suggests that deep searches for molecular gas will find few clouds, which will nonetheless, be the sites of star formation.
The other low-density star formation regime can be found in dwarf irregular galaxies. Drawing general inferences about the star formation properties of these galaxies requires large samples with well-defined (ideally volume-limited) selection criteria, and studies of this kind (based on UV, visible, and/or Hα observations) have been carried out by several groups (e.g., Karachentsev et al. 2004; Blanton et al. 2005; Meurer et al. 2006; Kennicutt et al. 2008; Dalcanton et al. 2009; Hunter et al. 2010). One perhaps surprising result is the near ubiquity of star formation in the dwarf galaxies. Kennicutt et al. (2008) observed or compiled Hα luminosities for galaxies within the local 11 Mpc, which included ~ 300 dwarf galaxies (MB > -17). Excluding a handful of dwarf spheroidal galaxies which have no cold gas, only 10 of these (~3%) were not detected in Hα, meaning that star formation has taken place over the last 3-5 Myr in the other 97% of the systems. Moreover many of the handful of Hα non-detections show knots of UV emission, demonstrating that even fewer of the galaxies have failed to form stars over the last ~ 100 Myr (Lee et al. 2011). Recent star formation is seen in all of the galaxies with MB < -13 and M(HI) > 5 × 10⁷ M⊙. For less massive galaxies it is possible for star formation to cease for timescales that are longer than the ionization lifetime of an HII region (up to 5 Myr), but examples of galaxies with extended periods of no star formation are extremely rare.
These data also provide a fresh look at the temporal properties of the star formation in dwarf galaxies generally. The distribution of SSFRs shows a marked increase in dispersion for galaxies with MB > -14.5 or circular velocity of 50 km s-1 (Lee et al. 2007; Bothwell et al. 2009). The corresponding neutral gas fraction does not show a similar increase in dispersion (Bothwell et al. 2009), so this suggests an increased short-term fluctuation of integrated SFRs in low-mass galaxies. Lee et al. (2009b) analyzed the statistics of the SFRs in more depth and confirmed a larger fraction of stars formed in bursts in low-mass galaxies (~ 25%), but these still represent only a small fraction of the total stars formed- even in the dwarfs the majority of stars appear to form in extended events of duration longer than ~ 10 Myr. Recent modelling of the statistics of Hα and UV emission by Weisz et al. (2012) and Fumagalli et al. (2011) as well as analysis of resolved stellar populations (e.g., Weisz et al. 2008) confirm the importance of fluctuations in the SFR.