Copyright © 2012 by Annual Reviews. All rights reserved
| Annu. Rev. Astron. Astrophys. 2012. 50:531-608
Copyright © 2012 by Annual Reviews. All rights reserved |


The immense dispersion in SFR properties seen in Figure 9 collapses to a remarkably tight scaling law when the SFR surface densities (Σ(SFR)) are plotted against mean gas surface densities (Σgas) (Kennicutt 1998b). This emergent order reflects the fact that gas is the input driver for star formation. The concept of a power-law relation between SFR density and gas density dates to Schmidt (1959); Schmidt (1963), and relations of this kind are commonly referred to as "Schmidt laws." On physical grounds we might expect the most fundamental relation between the volume densities of star formation and gas, but since most observations of external galaxies can only measure surface densities integrated along the line of sight, the most commonly used relation, often called a Kennicutt-Schmidt (KS) law, is in terms of surface densities.
 |
(13) |
The precise form of this relation depends on assumptions about how Σgas is derived from the observations (§ 2.4), but a strong correlation is clearly present.
6.1. The Disk-Averaged Star Formation Law
K98 presented a review of observations of the Schmidt law up to the time, and nearly all of that work characterised the relation between the disk-averaged SFR and gas surface densities in galaxies. The upper panel of Figure 11 presents an updated version of the global Schmidt law in galaxies. Each point is an individual galaxy (color coded as explained in the caption), with the surface density defined as the total gas mass (molecular plus atomic) or SFR normalized to the radius of the main star-forming disk, as measured from Hα, Paα, or IR maps. For simplicity, a constant X(CO) factor [2.3 × 1020 cm-2 (K km s-1)-1 with no correction for helium, see § 2.4] has been applied to all of the galaxies; the consequences of a possible breakdown in this assumption are discussed later. The sample of galaxies has been enlarged from that studied in Kennicutt (1998b), and all of the Hα-based SFR measurements have been improved by incorporating individual (IR-based) corrections for dust attenuation and [N2] contamination.
 |
Figure 11. (a) Relationship between the disk-averaged surface densities of star formation and gas (atomic and molecular) for different classes of star-forming galaxies. Each point represents an individual galaxy, with the SFRs and gas masses normalized to the radius of the main star-forming disk. Colors are used similarly as in Figure 9: Purple points represent normal spiral and irregular galaxies, red points infrared-selected starburst galaxies [mostly luminous and ultraluminous infrared galaxies (LIRGs and ULIRGs, respectively)], and dark yellow points denote circumnuclear starbursts with star-formation rates (SFRs) measured from Paα measurements. The Milky Way (black square) fits well on the main trend seen for other nearby normal galaxies. Magenta crosses represent nearby low-surfacebrightness galaxies, as described in the text. Open blue circles denote low-mass irregular and starburst galaxies with estimated metal (oxygen) abundances less than 0.3 Z⊙, indicating a systematic deviation from the main relation. For this plot, a constant X(CO) factor was applied to all galaxies. The light blue line shows a fiducial relation with slope N = 1.4 (not intended as a fit to these data). The sample of galaxies has been enlarged from that studied in Kennicutt (1998b), with many improved measurements as described in the text. (b) Corresponding relation between the total (absolute) SFR and the mass of dense molecular gas as traced in HCN. The dashed gray line is a linear fit, which contrasts with the nonlinear fit in panel a. Figure adapted from Gao & Solomon (2004). Reproduced by permission of the AAS. |
The form of this integrated Schmidt law appears to be surprisingly insensitive to SFR environment and parameters such as the atomic versus molecular fraction, but some metal-poor galaxies (defined as Z < 0.3 Z⊙) deviate systematically from the main relation, as shown by the blue open circles in Figure 11 (upper panel). These deviations could arise from a physical change in the star formation law itself, but are more likely to reflect a breakdown in the application of a constant X(CO) factor (§ 2.4; Leroy et al. 2011, and references therein). Adopting higher values of X(CO) for metal-poor galaxies brings the galaxies much more into accord with the main relation in Figure 11.
Recent observations of LSBs by Wyder et al. (2009) extend the measurements of the integrated star formation law to even lower mean surface densities, as shown by the purple crosses in the upper panel of Figure 11. A clear turnover is present, which is consistent with breaks seen in spatially-resolved observations of the star formation law (§ 6.2).
The slope of the integrated Schmidt law is non-linear, with N ≃ 1.4-1.5 (Kennicutt 1998b), when a constant X(CO) factor is applied. This uncertainty range does not include all possible systematic errors, arising for example from changes in X(CO) or the IMF with increasing surface density or SFR. Major systematic changes in either of these could easily change the derived value of N by as much as 0.2-0.3. For example, if X(CO) were five times lower in the dense starburst galaxies (§ 2.4), the slope of the overall Schmidt law would increase from 1.4-1.5 to 1.7-1.9 (Narayanan et al. 2012).
Usually the Schmidt law is parametrized in terms of the total (atomic plus molecular) gas surface density, but one can also explore the dependences of the disk-averaged SFR densities on the mean atomic and molecular surface densities individually. Among normal galaxies with relatively low mean surface densities, the SFR density is not particularly well correlated with either component, though variations in X(CO) could partly explain the poor correlation between SFR and derived H2 densities (e.g., Kennicutt 1998b). In starburst galaxies with high gas surface densities, however, the gas is overwhelmingly molecular, and a strong non-linear Schmidt law is observed (upper panel of Figure 11).
A similar non-linear dependence is observed for total SFR (as opposed to SFR surface density) versus total molecular gas mass (e.g., Solomon & Sage 1988; Gao & Solomon 2004), and presumably is another manifestation of the same underlying physical correlation. The dependence of the SFR on dense molecular gas mass is markedly different, however. The lower panel of Figure 11, taken from Gao & Solomon (2004), shows the relation between the integrated SFRs and the dense molecular gas masses, as derived from HCN J = 1 → 0 measurements (§ 2.4) for a sample of normal and starburst galaxies. In contrast to the correlation with total molecular mass from CO J = 1 → 0, this relation is linear, implying a strong coupling between the masses of dense molecular clumps and stars formed, which is largely independent of the galactic star-forming environment. Wu et al. (2005b) have subsequently shown that this linear relation extends down to the scales of individual star-forming molecular clouds and dense clumps in the Galaxy. Combined with the MW studies (§ 4), these dense gas relations for galaxies suggest that dense clumps are plausible fundamental star-forming units. If so, the mass fraction of the ISM (and fraction of the total molecular gas) residing in dense clumps must itself increase systematically with the SFR.
Because LHCN in the J = 1 → 0 line is only an approximate tracer for dense gas (§ 2.4.3) and because the definition of a dense clump is by no means precise (§ 2.5), one should be careful not to overinterpret these trends. Similar comparisons of the SFR with the emission from other molecular tracers suggest that the slope of the SFR versus gas mass relation changes continuously as one proceeds from lower-density tracers such as CO J = 1 → 0 to higher-excitation (and higher-density) CO transitions, and further to high-density tracers such as HCN and HCO+ and to higher transitions of those molecules (e.g., Juneau et al. 2009). Multi-transition studies, along with realistic modeling will help to refine the interpretation of line luminosities of dense gas tracers (e.g., Graciá-Carpio et al. 2008; Juneau et al. 2009).
The data shown in Figure 11 all come from observations of nearby galaxies (z < 0.03), but recently a number of studies have addressed the form of the molecular gas Schmidt law for starburst galaxies extending to redshifts z ≥ 2 (e.g., Bouché et al. 2007; Daddi et al. 2010; Genzel et al. 2010). The interpretation of these results is strongly dependent on the assumptions made about X(CO) in these systems. When a Galactic X(CO) conversion is applied, the high-redshift galaxies tend to fall roughly on the upper parts of the Schmidt law seen locally (e.g., Figure 11). However if a lower X(CO) factor is applied to the most compact starburst and submillimeter galaxies (SMGs), as suggested by many independent analyses of X(CO) (§ 2.4), the Schmidt relations shift leftwards by the same factor, forming a parallel relation (Daddi et al. 2010; Genzel et al. 2010).
Taken at face value, these results suggest the presence of two distinct modes of star formation with different global efficiencies, which separate the extended star-forming disks of normal galaxies from those in the densest circumnuclear starbursts; this distinction is likely to be present both in the present-day Universe and at early cosmic epochs. This inferred bimodality, however, is a direct consequence of the assumption of two discrete values for X(CO) in the two modes. A change in the interpretation of CO emission is certainly plausible when the derived molecular surface density is similar to that of an individual cloud (Σmol > 100 M⊙ pc-2), but the behavior of X(CO) may be complex (§ 2.4). Variation of X(CO) over a continuous range would indicate a steeper Schmidt law, rather than a bimodal law (Narayanan et al. 2012).
Daddi et al. (2010) also note that the higher concentration of gas in the ULIRGs/SMGs is consistent with an enhanced fraction of dense gas and the dense gas relations of Gao & Solomon (2004). However, the star formation rate also appears to be larger for a given mass of dense gas in extreme starbursts (García-Burillo et al. 2012 and references therein), especially when a lower value of αHCN is used. As with CO, one can interpret these as bimodal relations or as steeper than linear dependences on the gas tracer lines. These results, together with evidence for lower SFR per mass of dense gas in the CMZ of the MW (§ 5.1) warn against an overly simplistic picture of dense clumps as the linear building blocks for massive star formation, with no other variables in the picture.
The correlations between SFR and gas surface densities (and masses) are not the only scaling laws that are observed. Kennicutt (1998b) pointed out that the SFR surface densities also correlate tightly with the ratio of the gas surface density to the local dynamical time, defined in that case to be the average orbit time. This prescription is especially useful for numerical simulations and semi-analytical models of galaxy evolution. Interestingly, Daddi et al. (2010) and Genzel et al. (2010) found that the bifurcation of Schmidt laws between normal galaxies and ULIRGs/SMGs described above does not arise in the dynamical form of this relation.
Blitz & Rosolowsky (2006) have discovered another strong scaling relation between the ratio of molecular to atomic hydrogen in disks and the local hydrostatic pressure. The relation extends over nearly three orders of magnitude in pressure and H2/HI ratio and is nearly linear (slope = 0.92). Technically speaking this scaling relation only applies to the phase balance of cold gas rather than the SFR, but it can be recast into a predicted star formation law if assumptions are made about the scaling between the SFR and the molecular gas components (e.g., Blitz & Rosolowsky 2006; Leroy et al. 2008). Recent work by Ostriker et al. (2010) and Ostriker & Shetty (2011) provides a theoretical explanation for these relations.
Finally, a number of workers have explored the scaling between SFR surface density and a combination of gas and stellar surface densities. For example Dopita (1985) and Dopita & Ryder (1994) proposed a scaling between the SFR density and the product of gaseous and stellar surface densities; the latter scales with the disk hydrostatic pressure and hence bears some relation to the picture of Blitz & Rosolowsky (2006). More recently Shi et al. (2011) show that the scatter in the star formation law is minimized with a relation of the form ΣSFR ∝ Σgas Σ*0.5.
Determining which of these different formulations of the star formation law is physical and which are mere consequences of a more fundamental relation is difficult to determine from observations alone. Some of the degeneracies between these various relations can be understood if most gas disks lie near the limit of gravitational stability (Q ~ 1; Kennicutt 1989), and the critical column densities for the formation of cold gas phase, molecule formation, and gravitational instability lie close to each other (e.g., Elmegreen & Parravano 1994; Schaye 2004). In such conditions it can be especially difficult to identify which physical process is most important from observations. We return to this topic later.
We conclude this section by mentioning that there are other SFR scaling laws that can be understood as arising from an underlying Schmidt law. The best known of these is a strong correlation between characteristic dust attenuation in a star-forming galaxy and the SFR itself, with the consequence that galaxies with the highest absolute SFRs are nearly all dusty infrared-luminous and ultraluminous galaxies (e.g., Wang & Heckman 1996; Martin et al. 2005b; Bothwell et al. 2011). This opacity versus SFR relation is partly a manifestation of the Schmidt law, because we now know that the most intense star formation in galaxies takes place in regions with abnormally high gas surface densities, and thus also in regions with abnormally high dust surface densities. The other factor underlying the SFR versus opacity correlation is the prevalence of highly concentrated circumnuclear star formation in the most intense starbursts observed in the present-day universe (§ 5.3); this may not necessarily be the case for starburst galaxies at early cosmic epochs.
6.2. Radial Distributions of Star Formation and Gas
Over the past few years major progress has been made in characterizing the spatially-resolved star formation law within individual galaxies. This work has been enabled by large multi-wavelength surveys of nearby galaxies such as the Spitzer Infrared Nearby Galaxies Survey (SINGS) (Kennicutt et al. 2003), the GALEX Nearby Galaxies Survey (Gil de Paz et al. 2007), the Spitzer/GALEX Local Volume Legacy survey (LVL; Dale et al. 2009; Lee et al. 2011), and the Herschel KINGFISH Survey (Kennicutt et al. 2011). The resulting datasets provide the means to measure spatially-resolved and dust-corrected SFRs across a wide range of galaxy properties (§ 3). These surveys in turn have led to large spinoff surveys in HI (e.g., THINGS, Walter et al. 2008; FIGGS, Begum et al. 2008; Local Volume HI Survey; Koribalski 2010; LITTLE THINGS, Hunter et al. 2007) and in CO (e.g., BIMA-SONG, Helfer et al. 2003; IRAM HERACLES, Leroy et al. 2009; JCMT NGLS, Wilson et al. 2009; CARMA/NRO Survey, Koda & Nearby Galaxies CO Survey Group 2009; CARMA STING, Rahman et al. 2011; 2012).
The capabilities of these new datasets are illustrated in Figure 6, which shows Spitzer 24 µm, Hα, VLA HI, and CO (in this case from HERACLES) maps of NGC 6946 (see Figure 7 for the corresponding radial distributions of gas and star formation).
The first step in exploiting the spatial resolution of the new observations is to analyze the azimuthally-averaged radial profiles of the SFR and gas components (as illustrated for example in Figure 7) and the resulting SFR versus gas surface density correlations. This approach has the advantage of spatially averaging over large physical areas, which helps to avoid the systematic effects that are introduced on smaller spatial scales (§ 3.9). Radial profiles also have limitations arising from the fact that a single radial point represents an average over sub-regions with often wildly varying local gas and SFR densities, and changes in other radially varying physical parameters may be embedded in the derived SFR versus gas density relations.
Large-scale analyses of the star formation law derived in this way have been carried out by numerous authors (e.g., Kennicutt 1989; Martin & Kennicutt 2001; Wong & Blitz 2002; Boissier et al. 2003; Heyer et al. 2004; Komugi et al. 2005; Schuster et al. 2007; Leroy et al. 2008; Schruba et al. 2011; Gratier et al. 2010). A strong correlation between SFR and gas surface density is seen in nearly all cases, with a non-linear slope when plotted in terms of total (atomic+molecular) density. The best fitting indices N vary widely, however, ranging from 1.4-3.1 for the dependence on total gas density and 1.0-1.4 for the dependence on molecular gas surface density alone (for constant X(CO)). The measurements of the MW range from N = 1.2 ± 0.2, when only molecular gas is used (Luna et al. 2006), to 2.18 ± 0.20 when total (atomic and molecular) gas is used (Misiriotis et al. 2006).
Some of the differences between these results can be attributed to different schemes for treating dust attenuation, different CO line tracers, different metallicities (which may influence the choice of X(CO)), and different fitting methods. The influence of a metallicity-dependent X(CO) factor is investigated explicitly by Boissier et al. (2003). Since any variation in X(CO) is likely to flatten the radial molecular density profiles, a variable conversion factor tends to steepen the slope of the derived Schmidt law; for the prescription they use, the best fitting slope can increase to as high as N = 2.1 - 3.6, underscoring once again the critical role that assumptions about X(CO) play in the empirical determination of the star formation law. Despite these differences in methodology, real physical variation in the SFR versus gas density relation on these scales cannot be ruled out.
This body of work also confirms the presence of a turnover or threshold in the star formation relation at low surface densities in many galaxies. Early work on this problem (e.g., Kennicutt 1989; Martin & Kennicutt 2001; Boissier et al. 2003) was based on radial profiles in Hα, and some questions have been raised about whether these thresholds resulted from breakdowns in the SFR versus Hα calibration in low surface brightness regimes, as opposed to real thresholds in the SFR. Subsequent comparisons of UV and Hα profiles appear to confirm the presence of radial turnovers in the SFR in most disks, however, even in cases where lower levels of star formation persist to much larger radii (e.g., Thilker et al. 2007; Christlein et al. 2010; Goddard et al. 2010). This extended star formation can be seen in Figure 7 (R > 7 - 8 kpc). Recent studies of nearby galaxies with unusually extended XUV disks also show that the UV-based SFR falls off much more rapidly than the cold gas surface density, with global star formation efficiencies (є′) an order of magnitude or more lower than those in the inner disks (Bigiel et al. 2010). Taken together, these recent results and studies of the outer MW (§ 5.1) confirm the presence of a pronounced turnover in the Schmidt law for total gas at surface densities of order a few M⊙ pc-2 (Figure 12).
 |
Figure 12. Relation between star-formation-rate (SFR) surface densities and total (atomic and molecular) gas surface densities for various sets of measurements (from Bigiel et al. 2008). Regions colored gray, green, yellow, and red show the distribution of values from measurements of subregions of SINGS galaxies. Overplotted as light blue dots are data from measurements in individual apertures in M51 (Kennicutt et al. 2007). Data from radial profiles from M51 (Schuster et al. 2007), NGC 4736 and NGC 5055 (Wong & Blitz 2002), and NGC 6946 (Crosthwaite & Turner 2007) are shown as dark blue filled circles. The disk-averaged measurements from 61 normal spiral galaxies (dark blue stars) and 36 starburst galaxies (orange triangles) from Kennicutt (1998b) are also shown. The magenta-filled diamonds show global measurements from 20 low-surfacebrightness (LSB) galaxies (Wyder et al. 2009). In all cases, calibrations of initial mass function (IMF), X(CO), etc., were placed on a common scale. The three dotted gray diagonal lines extending from lower left to upper right reflect a constant global star-formation efficiency. The two vertical lines denote regimes that correspond roughly to those discussed in Section 6 of this review. Figure taken from Bigiel et al. (2008). Reproduced by permission of the AAS. |
6.3. The Star Formation Law on Sub-Kiloparsec Scales
The same multi-wavelength data can be used in principle to extend this approach to point-by-point studies of the star formation law. The angular resolution of the currently available datasets (optical/UV, mid-far IR, HI, CO) allows for extending this analysis down to angular scales of ~10, which corresponds to linear scales of 30-50 pc in the Local group and 200-1000 pc for the galaxies in the local supercluster targeted by SINGS, THINGS, KINGFISH, and similar surveys. Recent analyses have become available (Kennicutt et al. 2007; Bigiel et al. 2008; 2010; 2011; Leroy et al. 2008; Blanc et al. 2009; Eales et al. 2010; Verley et al. 2010; Liu et al. 2011; Rahman et al. 2011; 2012; Schruba et al. 2011), and several other major studies are ongoing.
The most comprehensive attack on this problem to date is based on a combination of SINGS, THINGS, and HERACLES observations (papers above by Bigiel, Leroy, and Schruba), and Figure 12, taken from Bigiel et al. (2008), nicely encapsulates the main results from this series of studies. The colored regions are the loci of individual sub-kiloparsec measurements of SFR surface densities (measured from a combination of FUV and 24 µm infrared fluxes) and total gas densities (HI plus H2 from CO(2-1) with a constant X(CO) factor), for 18 galaxies in the SINGS/THINGS sample. Other data (including Kennicutt 1998b) are overplotted as described in the figure legend and caption. The measurements show at least two distinct regimes, a low-density sub-threshold regime where the dependence of the SFR density on gas density is very steep (or uncorrelated with gas density), and a higher density regime where the SFR is strongly correlated with the gas density. The general character of this relation, with a high-density power law and a low-density threshold confirms most of the results presented earlier.
One can also examine separately the dependence of the SFR density on the atomic and molecular surface densities and the two relations are entirely different. The local SFR density is virtually uncorrelated with HI density, in part because the range of HI column densities is truncated above ΣHI ~ 10 M⊙ pc-2 or N(HI) ~ 1021 cm-2. This upper limit to the local HI densities corresponds to the column density where the HI efficiently converts to molecular form. This phase transition also roughly coincides with the turnover in the SFRs in Figure 12, which hints that the SFR threshold itself may be driven in part, if not entirely, by an atomic-molecular phase transition (see § 7).
In contrast to the HI, the SFR surface density is tightly correlated with the H2 surface density, as inferred from CO. A recent stacking analysis of the HERACLES CO maps made it possible to statistically extend this comparison to low H2 column densities, and it shows a tight correlation between SFR and CO surface brightness that extends into the HI-dominated (sub-threshold) regime (Schruba et al. 2011), reminiscent of studies in the outer MW (Fig. 7, § 5.1).
The strong local correlation between Σ(SFR) and Σmol is seen in all of the recent studies which probe linear scales of ~ 200 pc and larger. This is hardly surprising, given the strong coupling of star formation to dense molecular gas in local clouds (§ 4, § 6.4). However, on smaller linear scales the measurements show increased scatter for reasons discussed in § 3.9. On these scales we expect the scaling laws to break down, as the stars and gas may arise from separate regions; this effect has been directly observed in high-resolution observations of M33 (Onodera et al. 2010).
The main results described above - the presence of a power-law SFR relation with a low-density threshold, the lack of correlation of the local SFR with HI column density, the strong correlation with H2 column density, and the rapidly increasing scatter in the Schmidt law on linear scales below 100-200 pc - are seen consistently across most, if not all, recent spatially-resolved studies. Most of the recent studies also derive a mildly non-linear slope to the SFR density versus total gas density Schmidt law in the high-density regime, with indices N falling in the range 1.2-1.6. Less clear from the recent work is the linearity and slope of the Schmidt law on small scales, especially the dependence of SFR surface density on molecular gas surface density. The results from the HERACLES/THINGS studies have consistently shown a roughly linear ΣSFR versus Σmol relation (N = 1.0-1.1), and similar results have been reported by Blanc et al. (2009), Eales et al. (2010), and Rahman et al. (2012). Other authors however have reported steeper dependences (N = 1.2-1.7), closer to those seen in integrated measurements (e.g., Kennicutt et al. 2007; Verley et al. 2010; Rahman et al. 2011; Liu et al. 2011; Momose 2012). The discrepancies between these results are much larger than the estimated fitting errors, and probably arise in part from systematic differences in the observations and in the way the data are analyzed (see discussion in e.g., Blanc et al. 2009). One effect which appears to be quite important is the way in which background diffuse emission is treated in measuring the local SFRs (§ 3.9). Liu et al. (2011) show that they can produce either a linear or non-linear local molecular SFR law depending on whether or not the diffuse emission is removed. Another CARMA-based study by Rahman et al. (2011), however, suggests that the effects of diffuse emission may not be sufficient to account for all of the differences between different analyses. Another important factor may be the excitation of the CO tracer used (e.g., Juneau et al. (2009)).
It is important to bear in mind that nearly all of our empirical knowledge of the form of the local star formation law is based on observations of massive gas-rich spiral galaxies with near-solar gas-phase metal abundances. Most studies of the star formation relations in metal-poor dwarf galaxies have been limited to HI data or marginal detections in CO at best (e.g., Bigiel et al. 2008). A recent study of the SMC (~ 1/5 Z⊙) by Bolatto et al. (2011) offers clues to how these results may change in low-metallicity environments. They find that the atomic-dominated threshold regime extends up to surface densities that are an order of magnitude higher than in spirals.
6.4. Local Measurements of Star Formation Relations
With the ongoing large-scale surveys of the Galaxy and the Magellanic Clouds in recent years it is becoming possible to investigate star formation rate indicators, the scaling laws, and other star formation relations for local samples. These can provide valuable external checks on the methods applied on larger scales to external galaxies and probe the star formation relations on physical scales that are not yet accessible for other galaxies. Local studies of the conversion of CO observations into column density or mass were discussed in § 2.4.
Comparison of various star formation rate indicators
for the MW (§ 5.1), as would be
used by observers in another galaxy, against more direct measures,
such as young star counts, suggests that star formation rates
based on the usual prescriptions (mid-infrared and radio continuum)
may be underestimating absolute
 * by
factors of 2-3
(Chomiuk & Povich 2011).
The authors suggest that changes to the intermediate mass IMF,
timescale issues, models for O stars, and stochastic sampling of the
upper IMF can contribute to the discrepancy.
As discussed earlier, measures of star formation rate that use
ionizing photons (Hα or radio continuum) require regions with
a fully populated IMF to be reliable, and they systematically
underestimate the SFR in small star-forming clouds
(§ 3.9).
For example, star formation in clouds
near the Sun would be totally invisible to these measures
and the star formation rate would be badly underestimated in
the Orion cluster (§ 3.9).
Tests of other star formation rate tracers, such as 24
emission, within the Milky Way would be useful. Changes in
the IMF as large as those proposed by
Chomiuk & Povich (2011)
should also be readily observable in more evolved Galactic star
clusters, if not in the field star IMF itself.
* by
factors of 2-3
(Chomiuk & Povich 2011).
The authors suggest that changes to the intermediate mass IMF,
timescale issues, models for O stars, and stochastic sampling of the
upper IMF can contribute to the discrepancy.
As discussed earlier, measures of star formation rate that use
ionizing photons (Hα or radio continuum) require regions with
a fully populated IMF to be reliable, and they systematically
underestimate the SFR in small star-forming clouds
(§ 3.9).
For example, star formation in clouds
near the Sun would be totally invisible to these measures
and the star formation rate would be badly underestimated in
the Orion cluster (§ 3.9).
Tests of other star formation rate tracers, such as 24
emission, within the Milky Way would be useful. Changes in
the IMF as large as those proposed by
Chomiuk & Povich (2011)
should also be readily observable in more evolved Galactic star
clusters, if not in the field star IMF itself.
Using a YSO-counting method for five GMCs in the N159 and N44 regions
in the LMC,
Chen
et al. (2010)
were able to reach stellar masses of about 8 M⊙, below
which they needed to extrapolate. The resulting ratios of
*(YSOs)
to *(Hα + 24 µm) ranged from 0.37
to 11.6, with a mean of 3.5.
Recent studies have begun to probe the form of the star formation
relations on scales of clouds and clumps.
Using the YSO star counting method to get
* and
extinction maps to get mean mass surface density of individual, nearby
clouds,
Evans
et al. (2009)
found that the local clouds all lay well above
the K98 relation. Taken in aggregate, using the mean Σgas,
they lay a factor of 20 above the
Kennicutt et al. (1998b)
relation and even farther above the relation of
Bigiel
et al. (2008).
Subsequent studies show evidence for both a surface density threshold for star-forming clumps and a Σ(SFR)-Σmol relation in this high-density sub-cloud regime. Lada et al. (2010) found a threshold surface density for efficient star formation in nearby clouds; the star formation rate per cloud mass scatters widely (Fig. 13), but is linearly proportional to the cloud mass above a surface density contour of 116 ± 28 M⊙ pc-2 (Fig. 14), and the coefficient agrees well with the dense gas relations of Gao & Solomon (2004). Heiderman et al. (2010) studied the behavior of Σ(SFR) on smaller scales using contours of extinction. They limited the YSOs to Class I and Flat SED objects to ensure that they were still closely related to their surrounding gas and found a steep increase in Σ(SFR) with increasing Σgas up to about 130 M⊙ pc-2, above which a turnover was suggested. By adding the dense clumps data from Wu et al. (2010a), they identified a turnover at 129 ± 14 M⊙ pc-2, where the Σ(SFR) began to match the dense gas relation, but was far above the K98 relation for total gas (Figure 15). The agreement between these two independent approaches is encouraging, suggesting that a contour of about 125 M⊙ pc-2 is a reasonable defining level for a star-forming clump (§ 2.2). Other studies have found similar thresholds for efficient star formation or the presence of dense cores (Onishi et al. 1998; Enoch et al. 2007; Johnstone et al. 2004; André et al. 2010; Li et al. 1997; Lada 1992). Theoretical explanations for such thresholds can be found by considering magnetic support (Mouschovias & Spitzer 1976) or regulation by photo-ionization (McKee 1989). Alternatively, this threshold may simply correspond to the part of the cloud that is gravitationally bound (cf. § 4.3).
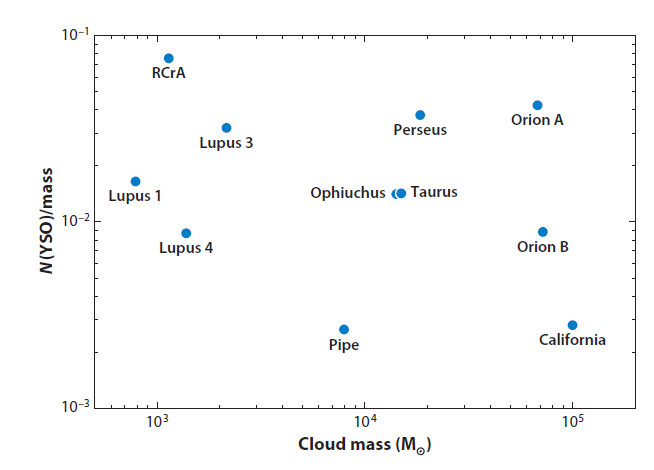 |
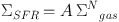
Figure 13. Plot of the ratio of the total number of young stellar objects [N(YSOs)] in a cloud to the total cloud mass versus total cloud mass. This is equivalent to a measure of the star-formation efficiency as a function of cloud mass for the local sample. It is also equivalent to the measure of the star-formation rate (SFR) per unit cloud mass as a function of the cloud mass. The plot shows large variations in the efficiency and, thus, the SFR per unit mass for the local cloud sample. Taken from Lada, Lombardi & Alves (2010); reproduced by permission of the AAS. |
The star formation rate density is even higher within clumps. Gutermuth et al. (2011) find a continuation of the steep increase in Σ(SFR) to higher Σgas in a study including embedded clusters. They find that Σ(SFR) ∝ Σgas2 up to several 100 M⊙ pc-2, with no evidence of a threshold. Near the centers of some centrally condensed clumps, Σgas reaches 1 gm cm-2, or about 4800 M⊙ pc-2 (Wu et al. 2010a), a threshold for the formation of massive stars suggested by theoretical analysis (Krumholz & McKee 2008).
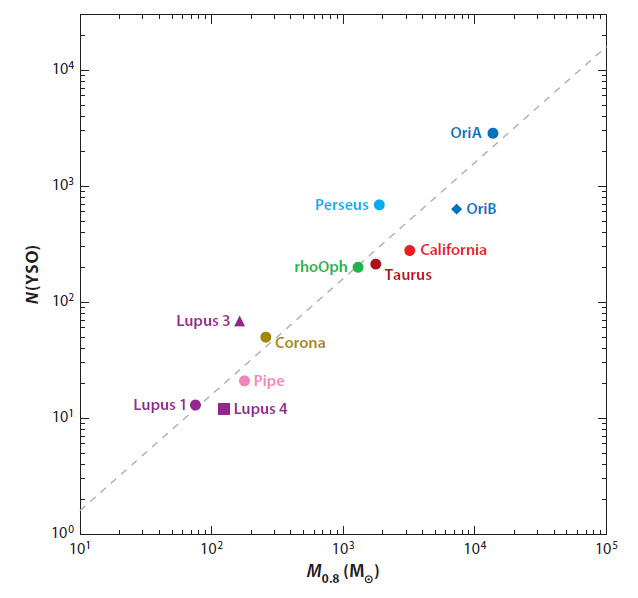 |
Figure 14. Relation between the total number of young stellar objects [N(YSOs)], the number of YSOs in a cloud, and M0.8, the integrated cloud mass above the threshold extinction of AK0 = 0.8 mag. For these clouds, the star-formation rate (SFR) is directly proportional to N(YSOs). Thus, this graph also represents the relation between the SFR and the mass of highly extincted and dense cloud material. A line representing the best-fit linear relation is also plotted for comparison. There appears to be a strong linear correlation between N(YSOs) (or SFR) and M0.8, the cloud mass at high extinction and density. Taken from Lada, Lombardi & Alves (2010); reproduced by permission of the AAS. |
Other studies have identified possible scaling relations in which SFR surface densities are not simply proportional to surface densities of dense gas. One analysis found that clouds forming stars with masses over 10 M⊙ satisfied the following relation: m(r) ≥ 870 M⊙ (r / pc)1.33 (Kauffmann et al. 2010; Kauffmann & Pillai 2010), where m(r) is the enclosed mass as a function of radius. This is essentially a criterion they call "compactness"; it can be thought of as requiring a central condensation, with ρ(r) ∝ rp, with p ≥ 1.67.
 |
Figure 15. Comparison of Galactic total c2d and Gould Belt (GB) clouds, young stellar objects (YSOs), and massive clumps to extragalactic relations. Star-formation rate (SFR) and gas surfaces densities for the total c2d and GB clouds (light blue squares), the Taurus cloud (black square), c2d Class I and Flat spectral energy distribution YSOs (green and magenta stars or inverted triangles for upper limits), and LIR > 104.5 L⊙ massive clumps (dark yellow diamonds) are shown. The range of gas surface densities for the spirals and circumnuclear starburst galaxies in the Kennicutt (1998b) sample is denoted by the gray horizontal lines. The gray-shaded region denotes the range for Σth = 129 ± 14 M⊙ pc-2. Taken from Heiderman et al. (2010); reproduced by permission of the AAS. |
Dunham et al. (2011b) have compared a subset of clumps in the BGPS catalog (Aguirre et al. 2011; Rosolowsky et al. 2010) with kinematic distances to the Heiderman-Lada (HL) criterion for efficient star formation and to the Kauffman-Pillai (KP) criterion for massive star formation. About half the clumps satisfy both criteria. Interestingly, Dunham et al. (2011a) found that about half the BGPS sample contained at least one mid-infrared source from the GLIMPSE survey. For the clumps most securely identified with star formation, 70% to 80% satisfy the HL or KP criteria.
All these studies consistently show that Σ(SFR), especially for massive stars, is strongly localized to dense gas, and is much higher (for Σgas > 100 M⊙ pc-2) than in the extragalactic Schmidt relations (Kennicutt 1998b; Bigiel et al. 2008). This offset between the extragalactic and dense clump "Schmidt laws" can be straightforwardly understood as reflecting the mass fraction (or surface filling factor) of dense clumps in the star-forming ISM. If most or all star formation takes place in dense clumps, but the clumps contain only a small fraction of the total molecular gas, we would expect the characteristic star formation tdep measured for clumps to be proportionally shorter than tdep of the total cloud mass and the efficiency (є) to be higher. Using a threshold of C18O emission to define clumps, Higuchi et al. (2009) found that the star formation efficiency (є) in clumps varies widely but averages 10%, about 4 times that in clouds as a whole (§ 4.1). If this interpretation is correct, we would also expect the relations between SFR and dense gas mass for galaxies (Gao-Solomon relation) to be similar for galaxies and the clumps, and they indeed appear to be roughly consistent (Wu et al. 2005b).
This conclusion is subject to some caveats, however. Various authors (Krumholz & Thompson 2007; Narayanan et al. 2008; Juneau et al. 2009) have pointed out that lines like those of HCN J = 1 → 0 are not thermalized at lower densities, so can result in a linear relation even if the underlying star formation relation is a local version of a non-linear KS law that extends to much lower densities. The SFR vs dense gas relation is based on a correlation between total FIR and HCN luminosities, and LFIR is likely to underestimate the SFR in young clusters (Urban et al. 2010; Gutermuth et al. 2011; Krumholz & Thompson 2007), perhaps by up to factors of 3-30. However, Lada et al. (2012) find a similar continuity between the Gao-Solomon starbursts and SFRs measured by counting YSOs in gas above a threshold surface density.