


Active Galactic Nuclei (AGN) are not the objects frequently discussed in the context of distance measurements. However, an excellent example of the water maser shows their current importance, and the continuously increasing AGN samples and our understanding of those objects open new possibilities.
The discovery of a water maser at 22.23508 GHz in the Seyfert II galaxy NGC 4258 (Miyoshi et al, 1995, Herrnstein et al, 2005) offers an unprecedented possibility to measure the distance to this galaxy directly through geometrical methods, without any need for intermediate steps, and with high accuracy.
This coherent emission forms due to collisional excitation (for emission mechanism, see e.g. Elitzur 1992, Lo 2005), the emitted frequency corresponds to the transition between rotational energy levels in the water molecule. The emission may form in the medium with the temperature about 300 - 600 K, and particle number densities 108 − 1011 cm−3. Its narrow band emission traces precisely the dynamics of the material through the line shifts.
In general, water maser emission can form in molecular clouds, comets, planetary atmospheres, stellar atmospheres, and in the case of distant galaxies can be mostly found in starburst regions. The maser emission in NGC 4258 is different, it originates in a Keplerian slightly warped disk surrounding the central black hole and it is strong enough that it can be mapped at sub-milli-arc-second resolution by Very Long Baseline Interferometry (VLBI), providing a powerful tool to probe spatial and kinematic distribution of the molecular gas at distances below 1 pc from the central black hole. The resolved image of the emission allows for the measurement of the spacial distribution of the emission, and the wavelength shifts give the velocity, and it was shown already by Miyoshi et al (1995) that the measured radial profile corresponds to the Keplerian motion. Further measurement of the proper motion, or acceleration, thus opens a way to the measurement of the geometrical distance. Subsequent long-term monitoring of this source (Argon et al, 2007, Humphreys et al, 2013b) allowed to obtain the distance to NGC 4258 with the accurracy of 3 %. New analysis of the same data by Riess et al (2016) gave the distance measurement to this source:
 |
(2) |
or, equivalently, magnitude distance of 29.39 ± 0.06 mag. Here the statistical error is the value coming directly from the Monte Carlo Markov Chain code, used for fitting the parameters, and the statistical error comes from the same code run for various initial values. This result, combined with a large number of Cepheid stars discovered in NGC 4258 (Fausnaugh et al, 2015) and in several hosts of SN Ia, opened a way to determine the local value of the Hubble constant H0 = 72.25 ± 2.38 km s−1 Mpc−1 with 2.4% accuracy (Riess et al, 2016).
The water maser in NGC 4258 is not the only one detected in an active galaxy, and not even the first one. The first water maser was detected in 1979 in NGC 4945 (Dos Santos and Lepine 1979), and a number of water masers are known till now, although none of those sources have such unprecedented data quality from the point of view of a distance measurement. However, statistical use of numerous sources (Megamaser Cosmology Project; Braatz et al, 2015) is expected to provide a measurement precision of ∼ 5 % on the Hubble constant.
It is widely thought that accretion onto the supermassive black holes in
bright AGN takes place via an optically thick, geometry thin accretion
disk described by
Shakura and Sunyaev
(1973).
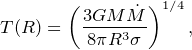
Each annulus within such a disk will emit like a blackbody with
temperature T at radius R. An accretion disk dominated by
heating from viscous dissipation which is around a black hole of mass
M accreting at a rate
 , has a temperature
profile given by:
, has a temperature
profile given by:
 |
(3) |
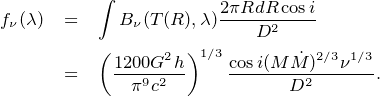
when the radius is much greater than the innermost stable circular orbit. The disk's absolute flux is then given by summing up blackbodies, Bν, over all disk annuli:
 |
(4) |
Therefore, if the temperature profile of the disk can be measured, the observed and expected fluxes can be compared in order to determine the distance. The key question, then, is how to determine the temperature profile of the disk. The accretion disk, expected to be a few light days across, is too small to be spatially resolved, and thus indirect techniques must be used. Reverberation mapping (Blandford and McKee 1982, Peterson 2014a) uses light travel time to measure spatial separations within a distant accretion flow. Much in the same way the continuum variability studies of AGN provide a means to probe the accretion disk around the central supermassive black hole and allow measurement of the temperature profile of the disk (for a detailed description see Collier et al, 1999, Cackett et al, 2007). High energy X-ray/EUV photons produced close to the compact object irradiate the surrounding gas which reprocesses this into UV/optical continuum, with the hotter inner regions emitting mainly UV photons and seeing variations in the irradiating flux before the cooler outer regions, which emit mainly optical photons. As the ionizing radiation varies erratically, so do the reprocessed components but with time delays due to light travel time within the system - the light travel time from source to reprocessing site to observer is longer than that on the direct path from source to observer. These observable delays provide indirect information on the size and structure of the surrounding accretion flows. This technique is a powerful probe of accretion flows in AGN.
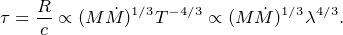
Thermal radiation from a disk annulus at temperature T(R) emerges with a range of wavelengths, λ ∼ hc / kT(R). Roughly speaking, each wavelength picks out a different temperature zone and the time delay τ = R/c measures the corresponding radius. Thus, in this reprocessing scenario the accretion disk reverberates and we expect to observe correlated variability between all continuum bands, with the shortest wavelength lightcurves varying first.
More specifically, the observed delays between different continuum wavelengths depend on the disk's radial temperature distribution T(R), its accretion rate, and the mass of the central black hole. A disk surface with T ∝ R−b will reverberate with a delay spectrum τ ∝ λ−1/b. For the temperature distribution of a steady-state externally irradiated disk, T(R) ∝ R−3/4 (as given above), thus the wavelength-dependent continuum time delays should follow
 |
(5) |
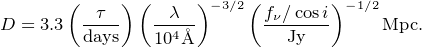
Accretion disk reverberation therefore allows the measurement of the disk temperature profile, and so can be used to determine the AGN distance (Collier et al, 1999) via:
 |
(6) |
Here, fν must be the accretion disk flux, which can be obtained by taking difference spectra to isolate the variable component of AGN light.
Over the past 20 years many studies have searched for the expected signatures and found good correlations between different UV and optical wavelength-bands, but the expected interband lags were never of high significance (e.g., Edelson et al, 1996, Wanders et al, 1997, Collier et al, 1998, 2001, Sergeev et al, 2005). Importantly, though, Sergeev et al (2005) found that in all the 14 nearby Seyferts in their sample the time-delays are present and show an increase in time delay with increasing wavelength, and the delays increase with greater absolute luminosity of the AGN as predicted by reprocessed disk models. The first attempt to apply this disk reverberation method to determine an AGN distance yielded an H0 value a factor of 1.66 smaller than any of the currently considered values (Collier et al, 1999). Cackett et al (2007) applied this model to fit the lags and fluxes from all 14 AGN in the Sergeev et al. sample, but again found a value of H0 a factor of 1.6 too small. One interpretation of this result is that the accretion disks are, on average, a factor of 1.6 larger than predicted by the standard model.
Over the last couple of years, significant progress has been made in better understanding the wavelength-dependent lags. Much improved sampling cadence and long baseline campaigns have allowed for significant lags from X-rays through to the near-IR to be measured in two objects, NGC 2617 and NGC 5548 (Shappee et al, 2014b, McHardy et al, 2014, Edelson et al, 2015, Fausnaugh et al, 2016). Both are consistent with the τ ∝ λ4/3 relation, however, the lags are a factor of ∼ 3 larger than expected based on the standard disk model (McHardy et al, 2014, Edelson et al, 2015, Fausnaugh et al, 2016). Figure 7 shows the wavelength-dependent lags from NGC 5548.
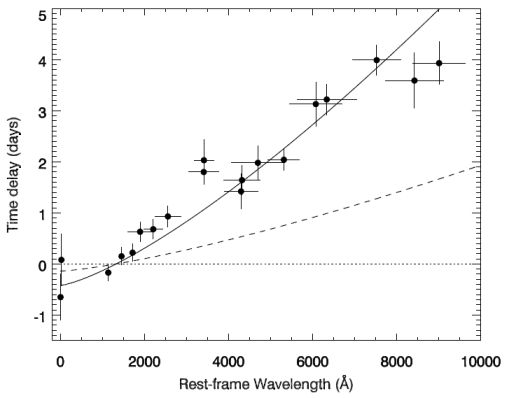 |
Figure 7. Time delay versus rest-wavelength for NGC 5548 (adapted from Fausnaugh et al, 2016). The solid line shows the best-fitting λ4/3 relation, while the dotted line shows the expected lags from a thin disk accreting at 10% of the Eddington rate. |
The challenge now lies in understanding the discrepancy with the disk model. Strong emission lines present in broadband filters can act to lengthen the measured continuum lag, since the broad emission line lag is longer than the continuum lag (Chelouche & Zucker 2013). However, in NGC 5548 this does not appear to be a large effect (Fausnaugh et al, 2016). Furthermore, continuum emission from diffuse gas in the broad line region will also act to lengthen the lag (Korista and Goad 2001), and hints of this effect are present in the NGC 5548 lags, where the u-band (where the Balmer diffuse continuum will peak) lag is an outlier in the otherwise smooth wavelength-dependent lags (Edelson et al, 2015, Fausnaugh et al, 2016). Alternatively, our understanding of disk accretion is incomplete, and other, more complex geometries occur (e.g. Gardner and Done 2016).
Future intense monitoring campaigns will help better understand these differences with the standard disk model. If these discrepancies can be understood, then this method of measuring distances has the potential to be very powerful given the AGN monitoring that will take place in the LSST-era.
Intense emission lines, most notably Balmer lines, with kinematic width of order of thousands km/s are the most characteristic features of AGN. The variability of the emission line intensity has been noticed already by Andrillat and Souffrin (1968), and the response of the lines to the variable intrinsic continuum opened a way to reverberation mapping of the Broad Line Region (e.g., Cherepashchuk and Lyutyi 1973, Gaskell and Sparke 1986, Kaspi et al, 2000; for a review, see Peterson 2014b, Bentz 2015). In the simplest approach, the time delay between the lines and the continuum measures the size of the BLR. Subsequent studies showed that the BLR clouds are predominantly in the Keplerian motion so their orbital velocity, measured through the line width, combined with the orbital radius allows to measure the black hole mass through the virial theorem. This application firmly established the importance of the BLR reverberation for cosmology.
The next important step has been made by Watson et al (2011) who suggested that BLR reverberation measurement can be also used to determine the distance to the source. AGN are clearly not standard candles, as their intrinsic luminosities span orders of magnitutes, but the reverberation studies showed a tight relation between the delay of the emission line (mosty Hβ) and the intrinsic luminosity flux (e.g., Peterson et al, 1999, Kaspi et al, 2000), most frequently measured at 5100 Å since the majority of the reverberation studies were done for low redshift AGN in the optical band. Line delay can be interpreted as a mean/effective radius of the BLR region. Thus this relation, after careful subtraction of the host galaxy reads
 |
(7) |
where L44 is the monochromatic λLλ flux expressed in units of 1044 erg s−1, and the coefficient values from the sample version Clean given in Tab. 14 of Bentz et al (2013) are K = 1.555 ± 0.024, α = 0.542 ± 0.027. The directly measured quantities are the line delay, τ, and the observed flux, Fλ so the value τ / Fλ1/2 provides the distance indicator (Watson et al, 2011).
The dispersion in the delay - luminosity relation is only 0.13 dex, as measured by Bentz et al (2013) in Clean variant. Thus, with a large number of objects and broader coverage of the redshift range the method offers a very interesting alternative to SNe Ia.
The unique aspect of the AGN Hubble diagram is that while SN distances are observationally restricted now to less than z ∼ 1.9 (Riess et al, 2001, Jones et al, 2013), AGN diagram can be extended to much larger redshifts thus covering the full range of distances with a single method. The additional advantage of the use of quasars is that those objects, on average, are not strongly affected by extinction (they clean efficiently their environment), and they do not show significant evolution of the metallicity with redshift so in principle no hidden evolutionary bias should be present in their BLR properties across the redshift space.
The number of AGN studied in the context of reverberation mapping is not yet large, about 60 objects were monitored in Hβ line (see Du et al, 2015, Du et al, 2016a for a recent compilation), and only a handful of sources have other line delays measured. The most distant quasar with tentative time delay, measured for CIV line, is still S5 0836+71 at z = 2.172 studied through 7-year monitoring by Kaspi et al (2007). However, many monitoring programs are under way (e.g., Czerny et al, 2013, King et al, 2015, Lira et al, 2016). The use of other lines than Hβ has the advantage that the measured time delay is then considerably shorter which is important for high z quasars, where the expected time delay is long due to large black hole mass as well as to the (1 + z) scaling of the intrinsic timescale to the observed one.
Covering the broad range of redshifts with the same probe is very important for distance determination, and for subsequent cosmological constraints. This is best illustrated by King et al (2014) where they analyze the expected results from the sample of 2000 AGN. If the dark energy is parametrized as
 |
(8) |
after Chevallier and Polarski (2001), then to get the strong constraints AGN must populate the broad redshift range 0.01 < z < 4, i.e. starting at very low redshifts (see Fig. 8). AGN can cover such a broad range while this is a problem for the methods based on gamma-ray bursts (see Sect. 8).
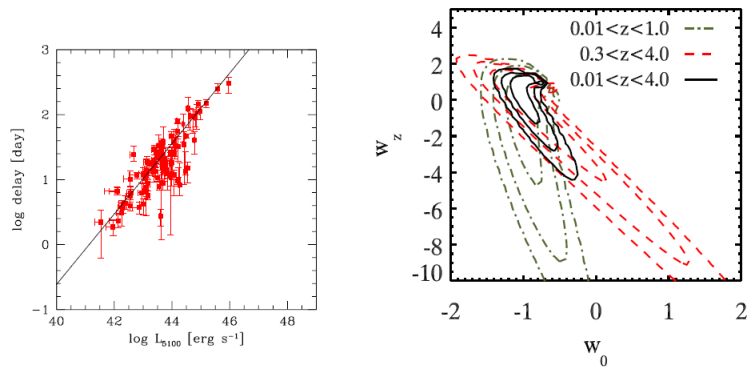 |
Figure 8. Left panel: the time delay of Hβ line as a function of monochromatic luminosity from current reverberation measurements as compiled by Du et al (2015, 2016a) (red points), and the best fit from Bentz et al (2013) (see text). Right panel: the expected constraints on dark energy parameters from reverberation-measured 2000 AGN strongly depend on their redshift coverage, and the sources at very low as well as at high redshifts are needed (Fig. 6 from ). |
Nearby AGN are currently monitored by several groups (e.g., Ilic et al, 2015, Barth et al, 2015, Fausnaugh et al, 2016, Bentz et al, 2016a, b, Du et al, 2016a). SDSS quasar sample has been recently monitored for six months within the frame of the SDSS-RM project (Shen et al, 2016) which allowed to provide preliminary estimate of nine Hβ langs and six Mg II lags for objects with redshifts above 0.3, and this program is being extended now, covering 849 sources in total, with cadence of 12 epochs per year. High redshift quasars do not need such a dense sampling but then the project requires at least 5 years of monitoring (Czerny et al. 2013) to measure lags in higher z sources, and such project is under way within the Oz-DES program (King et al, 2015). Selected sources (771 in the final sample) will be monitored for six years, with 25 measurements for each quasar, on average. Individual delay measurements are expected for half of them, after carefull subtraction of the Fe II and Fe III emission, host galaxy contamination and correction for the reddening. For fainter sources stack analysis will be performed in a number of luminosity bins. Monitoring of a few z ∼ 1 quasars with as large telescope as SALT will allow for better disentangling of the Mg II line from the underlying Fe II pseudo-continuum (Hryniewicz et al, 2014, Modzelewska et al, 2014).
Narrow-band and broad band reverberation measurements offer an interesting option since they can be done with smaller telescopes and in a more automatic way. In particular, the future Large Synoptic Sky Survey (LSST) will bring 10-year dense coverage of thousands of quasars in six photometric bands. The challenge is in disentangling the line and continuum variability but preliminary studies indicate this is possible (e.g., Chelouche et al, 2014).
However, before AGN monitoring can reach maturity in cosmological applications, several issues have to be addressed. First, the AGN Hubble diagram, like SNe Ia, currently requires calibration to obtain absolute distances. This is basically done by adopting the current value of the Hubble constant for nearby AGN. Direct comparison of AGN distances with another distance indicator is rare. One such example is through the detection of 11 Cepheid stars in a Seyfert 1 galaxy NGC 4395 (Thim et al, 2004). However, in principle the calibration issue can be avoided if the understanding of the BLR formation progresses. For example, the idea that the BLR forms as a dust-driven failed wind (Czerny and Hryniewicz 2011) combined with the theory of accretion disk sets the BLR onset at some specific value of Teff provided by the dust sublimation temperature (see Sect. 6.2). Thus if the hottest dust temperature can be independently measured for a number of AGN this could allow the reverberation method to move to the class of direct methods. Recent comparison of the standard calibration with dust temperature based calibration for a whole AGN sample implies dust temperature 900 K, lower than the hottest dust temperature generally measured in AGN although much higher temperature value was found using the same model from NGC 5548 (Galianni and Horne 2013).
Second aspect is the objective removal of outliers. Some systematic departure of very high Eddington ratio sources from the overall trend has been recently noted (Du et al, 2016b). If this conclusion is supported in further studies, such super-Eddington sources have to be removed from the general sample or corrected for the departure trend.
The third problem is related to possible systematic errors when we move towards more distant, brightest quasars. The extension of the power law dependence between RBLR and the monochromatic flux in a form of a simple power law has not been observationally tested. If the BLR formation is well explained by the failed dust model, expected departures from the linear trend are not strong but if the BLR radius mostly depend on the total ionizing flux then the decrease in ionizing photons with the black hole mass (larger at larger distances) may cause strong nonlinear behavior. The measured monochromatic flux is also affected by the viewing angle, usually unknown. This is not a large problem for nearby AGN since the viewing angles of type 1 AGN are limited to the range between 0 and ∼ 45 deg due to the presence of the dusty torus, and the lag independence on the viewing angle was demonstrated by Starkey et al (2016). However, if the torus opening decreases with redshift and/or with luminosity it may lead to some systematic errors. Recent studies imply some dependence of dust coverage on luminosity (e.g., Ichikawa et al, 2017) but the opposite conclusion has been reached by Mateos et al (2017), so more future studies along this line are still needed.
Therefore, the BLR reverberation method has not yet reached maturity. On the other hand, it has a large future potential. Large samples of reverberation-studied sources are coming. Extension of the method to photometric reverberation (Haas et al, 2011) opens a way for future use of the Large Synoptic Sky Survey (LSST) data for this purpose, which will bring 10 years of quasar monitoring, with the cadence of 100 observations per year in 6 photometric channels. In the meantime, systematic problems can be studied with increasing sample of individual, well spectroscopically monitored objects.
6.4. Extragalactic distances based on dust reverberation of AGNs
The inner radius of the dust torus in an active galactic nuclei (AGN) is considered to be determined by sublimation of dust and is proportional to the square-root of the accretion-disk luminosity. If its physical size can be measured by reverberation of dust emission, then the luminosity distance of an AGN can be obtained. The Hubble constant was estimated from the distances based on the dust reverberation for local AGNs as 73 km s−1 Mpc−1, which shows good agreement with its current standard estimates.
Near-infrared interferometry recently begins to be able to measure the angular scale of the innermost dust torus for brightest AGNs, and the angular diameter distance can be obtained by comparing the reverberation radius with it.
6.4.1. Luminosity distance based on the dust reverberation
Many observations have indicated that an obscuring dust torus surrounds an accretion disk and broad emission-line region (BLR) in the center of an active galactic nucleus (Antonucci 1993). Since dust is sublimated in the vicinity of the accretion disk by absorbing its strong UV-optical continuum emission, the inner radius of the dust torus is considered to be determined by sublimation of dust. The dust sublimation radius rd can be derived from the radiation-equilibrium equation for the dust grain,
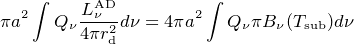 |
(9) |
where Tsub is the dust sublimation temperature, a is the dust grain size, Qν is the absorption efficiency of dust, and Bν is the Planck function (Barvainis 1987). The parameters Tsub and Qν at the innermost region of the dust torus would be common in AGNs, because only the dust grains with highest sublimation temperature can survive there and those parameters are determined by the properties of such dust grains. Therefore, the inner radius of the dust torus is expected to be proportional to the square-root of the accretion-disk luminosity. Inversely, the absolute luminosity can be estimated once the inner radius of the dust torus is obtained observationally, which could be used as a distance indicator for AGNs.
The dust reverberation enables us to obtain the inner radius of the dust torus by measuring the lag between the flux variation of the UV-optical continuum emission from the accretion disk and that of the near-infrared thermal emission from the dust torus. A possible application of the dust reverberation of AGNs to the cosmological distance measurement was proposed at the end of the 20th century (Kobayashi et al, 1998, Oknyanskij 1999, Yoshii 2002), and the group of the University of Tokyo started the Multicolor Active Galactic NUclei Monitoring (MAGNUM) project (PI: Yuzuru Yoshii) in 1995 to establish the distance indicator based on the dust reverberation of AGNs and to constrain the cosmological parameters (Yoshii 2002).
Figure 9 shows the radius-luminosity relation for the dust torus obtained by the largest systematic dust reverberation survey for 17 local Seyfert galaxies performed by the MAGNUM project (Koshida et al, 2014). The inner radius of the dust torus clearly correlates with the optical luminosity of AGNs as theoretically expected, which demonstrates the feasibility of the luminosity distance indicator based on the dust reverberation. Then, the dust sublimation model at the innermost dust torus was built to obtain the distances for the 17 AGNs without any distance ladder, and the distances were compared with the recession velocities to estimate the Hubble constant (Yoshii et al, 2014). Figure 10 shows the Hubble diagram. The Hubble constant was estimated approximately as H0 = 73 km s−1 Mpc−1, which shows good agreement with its current standard estimates. In addition, the distance calibration based on the dust sublimation model in (Yoshii et al, 2014) was consistent with that obtained from the distances of the SNe Ia occurred in the AGN host galaxies (Koshida et al, 2017). These results indicate that the distance indicator based on the dust reverberation is a promising new tool for investigating the expanding Universe.
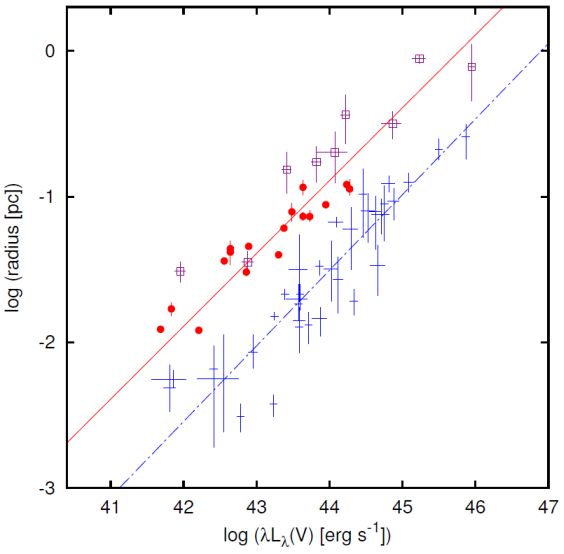 |
Figure 9. Radii of the innermost dust torus and the BLR plotted against the V-band luminosity (Koshida et al, 2014). The red filled circles represent the reverberation radii for the dust torus obtained by the MAGNUM project, and the red solid line represents the best-fit regression line for them. The blue crosses represent the reverberation radii for the BLR and the blue dot-dashed line represents the best-fit regression line for them (Bentz et al, 2009). The purple open squares represent the interferometric radii in near-infrared for the dust torus (Kishimoto et al, 2011, Weigelt et al, 2012). |
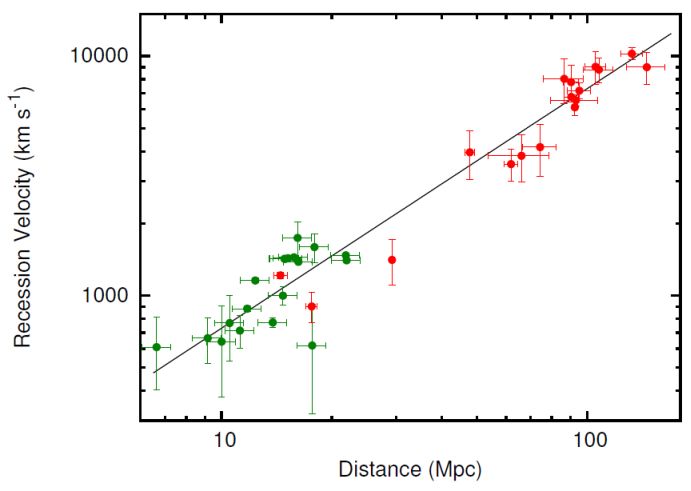 |
Figure 10. Hubble diagram for galaxies with the dust reverberation distance (red filled circles) and the Cepheid-variable distance (green filled circles) from Yoshii et al (2014). The solid line represents the best-fit regression line for the data based on the dust reverberation distance. |
6.4.2. Trigonometric parallax for the dust torus
When both the physical size and the angular size of a certain structure in an AGN can be obtained, the angular diameter distance can be estimated by trigonometry. Although usual imaging observations cannot resolve the inner structures of AGNs whose physical sizes are obtained by reverberation mapping, their angular size might be able to be obtained by future long-baseline interferometers in optical and near-infrared wavelengths. This trigonometric parallax for AGNs was first proposed for the BLR (Elvis and Karovska 2002), but actually, it has not been applied to any AGNs yet.
Since the dust torus is more extended than the BLR, the trigonometric parallax for the dust torus would be more feasible. Indeed, recent advancement of near-infrared interferometry makes it possible to measure the angular scale of the innermost dust torus for some brightest AGNs (Kishimoto et al, 2011, Weigelt et al, 2012), and the angular diameter distance of NGC 4151 was estimated by comparing the dust reverberation radius with the interferometric angular scale in near-infrared (Hönig et al, 2014). However, as shown in Figure 9, the interferometric radius was found to be systematically larger than the reverberation radius by about a factor of two (Koshida et al, 2014), whereas it is not the case for NGC 4151. Further studies on the structure of the dust torus are necessary to understand this systematic difference and to extend the use of the dust parallax distance of AGNs.
Reverberation methods are time-consuming, and much more efficient alternative is to design the method based just on a single spectrum. There are some options in consideration, but they are still in their infancy.
If Eddington ratio and black hole mass can be derived from some distance-independent measure it would be possible to derive distance-independent quasar luminosities. Sulentic et al (2014) suggest that quasars radiating close to the Eddington limit show distinct optical and UV spectral properties that can be recognized in spectra. They propose specific criteria based on the line ratios (Al IIIλ1860 / Si III]λ1892 ≥ 0.5, and (ii) Si III]λ1892 / C III]λ1909 ≥ 1.0) which lead to a source sample with dispersion of ∼ 0.13 dex in the Eddington ratio. Larger sample of such sources may give interesting constraints on cosmological parameters.
Wang et al (2014) proposed instead to use the basic prediction of the slim accretion disk theory (Abramowicz et al, 1988): the saturation of the luminosity for high Eddington ratio sources. In slim disks the radiative efficiency drops with the Eddington ratio, so effectively the rise of the total source luminosity is only logarithmic in accretion rate. Their preliminary tests of cosmological applications are attractive but the method still requires better analysis of the saturation level as well as efficient method of selecting such AGN in large AGN catalogs.
Quasars can be considered a reliable cosmological tools in a similar way as for Type Ia supernovae, provided that the quasar sample is large enough and there is a relation able to standardize the quasar emission. A non-linear relation between the optical and X-ray luminosity in quasars was discovered with the first X-ray surveys in the early '80s (Tananbaum et al, 1979, Zamorani et al, 1981, Avni and Tananbaum 1986), and it has been confirmed since with various samples of a few hundred quasars observed with the main X-ray observatories over a redshift range from 0 to ∼ 6.5 and about four decades in optical luminosity.
The largest samples published so far include (i) a compilation of 367 quasars from different optical surveys and observed by ROSAT, XMM-Newton and Chandra (333 from Steffen et al, 2006 and 34 from Just et al, 2007); (ii) 350 sources obtained from the Sloan Digital Sky Survey 5th quasar catalog with available XMM-Newton observations (Young et al, 2010); (iii) 545 objects from the XMM-COSMOS survey (Lusso et al, 2010); and (iv) 200 quasars with UV and X-ray observations from the Swift observatory archive (Grupe et al, 2010, Vagnetti et al, 2010). In all these works the LX - LUV relation is parametrized as a linear dependence between the logarithm of the monochromatic luminosity at 2500 Å (LUV) and the αOX parameter, defined as the slope of a power law connecting the monochromatic luminosity at 2 keV (LX), and LUV: αOX = 0.384 × log(LX / LUV). This relation implies that quasars more luminous in the optical are relatively less luminous in the X-rays. For instance, the increase by a factor of 10 in LUV implies an increase by only a factor of ∼ 4 in the X-ray luminosity. When expressed as a relation between X-ray and UV luminosities, the αOX - LUV relation becomes logLX = β + α logLUV. All the works cited above provide consistent values (within the uncertainties) of both normalization and slope, β ∼ 8−9 and α ∼ 0.6, with an observed dispersion that ranges between δ ∼ 0.35-0.40 dex. Luminosities are derived from fluxes through a luminosity distance (DL) calculated assuming a standard ΛCDM model with the best estimates of the cosmological parameters ΩM and ΩΛ at the time of the publications.
The potential use of this relation as a cosmological probe is obvious. The observed X-ray flux is a function of the observed optical flux, the redshift, and the parameters of the adopted cosmological model as
 |
(10) |
where β′ = β + (α − 1) log(4π). This relation can be then fitted to a set of optical and X-ray observations of quasars in order to estimate the cosmological parameters. However, none of the samples published so far had, on their own, the size and/or homogeneity to provide useful constraints for cosmological applications.
Recently, the relation above has been employed to build a Hubble diagram for quasars to obtain an independent measure of cosmological parameters. Risaliti and Lusso (2015) have shown that it is possible to build a sample large enough to estimate the cosmological parameters and to test the ΛCDM model over the whole redshift range z = 0-6.5 (back to an age of the Universe of only ∼ 0.8 Gyr). By using a dataset of ∼ 800 quasars from the literature (basically all the ones listed at the beginning of this Section) with optical and X-ray data, Risaliti and Lusso (2015) have demonstrated that the FX − FUV relation does not exhibit any dependence with redshift, which is a necessary condition to use it as a distance estimator. It has been therefore possible to build, for the first time, a quasar Hubble diagram in excellent agreement with that of Type Ia supernovae over the common redshift range (z ≤ 1.4), but extending it to much higher distances. Figure 11 (left panel) shows the Hubble diagram for quasars (small black points, while red points are averages in narrow redshift bins for visual purpose only), compared to the one of Type Ia supernovae samples (cyan points, from Suzuki et al, 2012). Interestingly, since the same physical quantity (i.e. the distance modulus) is involved, this analysis based on the distance modulus-redshift relation allows us to directly merge quasar and supernova data on the same diagram, where both are used as standardized candles. This method offers unique access to a region of the distance modulus-redshift plane where it is extremely unlikely (if not impossible) to observe any Type Ia supernovae.
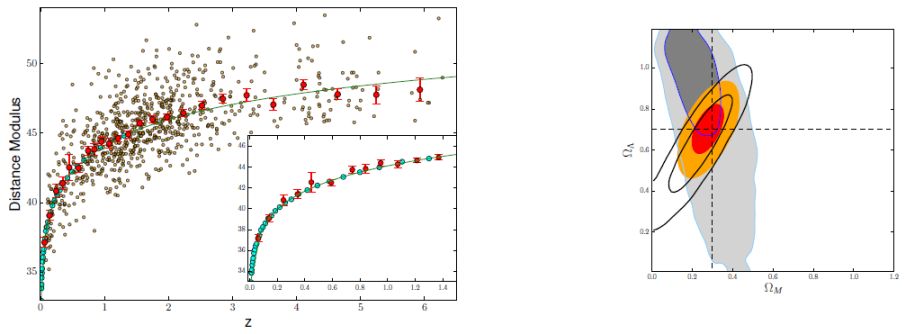 |
Figure 11. Left: Hubble diagram for the quasar sample ( ∼ 800 sources, orange points), and supernovae (cyan points) from Betoule et al. (2014). The large red points are quasar averages in narrow redshift bins. The inner box shows a zoom of the z = 0-1.5 range, in order to better visualize the match between the supernovae and quasar samples. The continuous line is obtained from a joint fit of the two samples assuming a standard ΛCDM cosmological model. Right: 68% and 95% contours for ΩM and ΩΛ as derived from the Hubble diagram of quasars (grey, Risaliti & Lusso 2015), from the Type Ia supernovae sample (empty black, Betoule et al. 2014), and from a quasar-supernovae joint fit (orange, red). It is the first time that this measurement has been done using quasars as cosmological distance probes. Adapted from Risaliti & Lusso 2015. |
The results for the determination of the cosmological parameters ΩM and ΩΛ are shown in the right panel of Fig. 11. The 68% and 95% contours for ΩM and ΩΛ, assuming a standard ΛCDM model, are derived from the analysis of the Hubble diagram of quasars only (grey contours), from the supernovae of the Union 2.1 sample (empty black contours; Suzuki et al, 2012), and from a quasars-supernovae joint fit (orange/red contours). The present data return ΩM = 0.22+0.08−0.10 and ΩΛ = 0.92+0.18−0.30 (ΩM = 0.28 ± 0.04 and ΩΛ = 0.73 ± 0.08 from a joint fit). The contour plot relative to the joint sample is not a statistical intersection of the two individual contours, but the result of a simultaneous fit of the distance modulus-redshift relation for the combined sample quasar/supernovae. This also provides a significantly improved measurement of ΩM and ΩΛ with pure distance indicators. When all the available cosmological indicators (CMB, BAO, weak lensing, supernovae) are considered, the sample of Risaliti and Lusso (2015) does not significantly improve the constraints on the cosmological parameters. The main limitation of this work is its small predictive power, mainly due to the still large dispersion of the logFX = β + α logFUV relation ( ∼ 0.30-0.35 dex). For comparison, the uncertainty in the distance of a supernova at low redshift is about 0.05 in the same units. This means that, in order to obtain the same constraints on a cosmological fit, roughly (0.35/0.05)2 ∼ 50 quasars per single supernova are needed.
The LX - LUV relation was recently analyzed on a sample of > 2,600 SDSS AGN, with X-ray data from XMM-Newton with the aim to understand the origin of the observed dispersion, and to evaluate the true intrinsic dispersion in this relation (Lusso and Risaliti 2016). This work shows that, even though the observed dispersion in the main quasar sample is ∼ 0.45 dex, most of this scatter is caused by the combination of X-ray variability, poor optical/UV and X-ray data quality, and the contamination from the host galaxy and/or AGN with red continua. Once all the contaminations above are taken into account, the real physical dispersion is found to be less than 0.21 dex over roughly 4 decades in luminosity, indicating a tight empirical coupling between disc (UV) and corona (X-rays), which puts the determination of distances based on this relation on a sounder physical grounds.
Although exploratory, the analysis presented in Risaliti and Lusso (2015) already provides important results: the validation of the UV to X-ray relation and the extension of the Hubble Diagram up to z ∼ 6. The constraints on the cosmological parameters are still loose compared with other methods, and the improvement on the measurement errors obtained by combining the quasar findings with those from supernovae, CMB, BAOs, and clusters is not significant. This work is mainly intended as a demonstration of the method, while most of its potential is still to be exploited in future work, with both available and forthcoming data (e.g. eROSITA, Euclid, Athena) that will significantly increase the number of quasars at z > 2 where the intrinsic power of this novel technique lies.
6.7 X-ray excess variance method
Another method based on a combination of X-ray observations has been proposed by La Franca et al (2014). The method requires a single optical spectrum (determination of FWHM of one of the strong AGN lines, preferentially Hβ) and determination of the X-ray excess variance. The basic idea is simple, it relies on a combination of two methods of the black hole mass determination and subsequent elimination of the mass. The first method, derived from the reverberation campaigns (e.g., Kaspi et al, 2000, Peterson et al, 2004) shows that the black hole mass can be determined from a single epoch spectrum, from the monochromatic absolute luminosity (a proxy for the BLR size, see Sect. 6.3) and the emission line width. The second method is based on the simple relation between the black hole mass and the high frequency tail of the X-ray power spectrum, or, more conveniently, the X-ray excess variance (e.g., Nikolajuk et al, 2004, Gierlinski et al, 2008). Combining the two and eliminating black hole mass one can determine the absolute luminosity from the X-ray excess variance and the FWHM. The difficulty lies in the high quality measurement of the X-ray excess variance: La Franca et al. argue that the launch of Athena X-ray Observatory (expected in 2028) will provide interesting number of measurements, and they expect more from the future generation X-ray telescopes with larger detector area, but this is not coming soon.