

An AGN is the observed manifestation of gas accretion onto a supermassive black hole (SMBH). In the broadly accepted view of AGN, the accretion of gas around the SMBH produces an optically thick disk of material (termed the “accretion disk”), which emits thermally due to viscosity within the disk (e.g., Shakura & Sunyaev, 1973, Rees, 1984). The gas within the accretion disk has a wide range of temperatures (with the temperature an inverse function of the distance from the SMBH) and, consequently, the emission is produced over a broad wavelength range (termed the spectral energy distribution; SED). 1 For the accretion disk of a typical AGN, the range of gas temperatures is likely to be T ≈ 104 – 105 K and, therefore, the majority of the emission from the accretion disk will be at ≈ 30–300 nm (i.e., at UV–optical wavelengths).
The SED of an AGN accretion disk is distinct from that of other astrophysical sources, making them comparatively easy to identify; see Figure 1 for the different SEDs between a star-forming galaxy and the accretion disk. This is fortuitious since the accretion disk is small and unresolved for even the closest and brightest AGN (i.e., light hours–light days in physical size). The accretion of gas onto a SMBH is an exceptionally efficient process ( ≈ 5–42% of the mass is ultimately converted into emission, depending on the spin of the SMBH; e.g., Kerr 1963, Shapiro & Teukolsky 1983) and thus large luminosities can be produced for a modest amount of accretion, allowing for luminous AGN to be detected out to high redshifts. Indeed, luminous AGN are the most powerful non-explosive objects in the Universe.
 |
Figure 1. Schematic representation of the spectral energy distribution (SED) of an unobscured AGN (black curve), separated into the main physical components (as indicated by the colored curves) and compared to the SED of a star-forming galaxy (light grey curve). Figure from Harrison (2014), courtesy of C. M. Harrison. |
The first systematic studies of AGN occured over 50 years ago and led to the definition of some of the main classes (e.g., Seyfert, 1943, Baade & Minkowski, 1954, Schmidt, 1963): Seyfert galaxies, radio galaxies, and quasars. It is not the objective of this review to describe the menagerie of different AGN classes, which has been extensively covered in Padovani et al. (2017). However, we note that in the current parlence, “Seyfert galaxies” is often used to indicate AGN of low–moderate luminosity (Lbol ≈ 1042 – 1045 erg s−1) while “quasars” is often used to indicate AGN of high luminosity (Lbol > 1045 erg s−1). Lbol is the bolometric luminosity of the AGN, which corresponds to the total luminosity produced (or inferred, for systems where the accretion disk emission is not directly detected) by the accretion disk.
1.1. A brief overview of obscured AGN
The focus of this review is obscured AGN. These are systems where the emission from the accretion disk is not directly detected due to the presence of material between the accretion disk and the observer. In a general sense, obscuration is defined as anything that absorbs emission and/or scatters a large fraction away from the line of sight of the observer. In astrophysical sources the obscuring medium is typically composed of dust and/or gas. Dust is the common term used to describe solid-state structures, which are typically carbonaceous grains and amorphous silicate grains (see Draine (2003) for a review). Gas is the term used to describe a broad range of gaseous states, from fully ionized gas, including electrons and protons, to neutral gas and molecular compounds. Dust dominates the source of obscuration at UV–infrared (IR) wavelengths, while gas dominates the absorption at X-ray energies. However, the impact of the obscuring material on the detection of the accretion-disk emission is dependent on wavelength. Physically this is referred to as the optical depth, which is the product of the opacity and density of the material (κλ; ρ) and the path length (s); for example, see Rybicki & Lightman (1979) for a general overview. A low optical depth indicates that a small fraction of the emission will be absorbed while a high optical depth implies the converse.
For many (probably the majority of) obscured AGN, the obscuration occurs in the close vicinity of the accretion disk and lies within the gravitational influence of the SMBH. In the favoured picture for the physical structure of AGN (termed the “unified model” of AGN ; e.g., Antonucci 1993, Urry & Padovani 1995, Netzer 2015), the accretion disk is surrounded by a geometrically and optically thick dusty and molecular “torus” (often referred to as the “dusty torus”); see Figure 2 for a schematic of the AGN physical model from Ramos Almeida & Ricci (2017). The torus is expected to be within the gravitational influence of the SMBH and could be considered, in a broad sense, the cool outer regions of the accretion disk where molecules and dust grains can form. The anisotropic nature of the torus means that for some lines of sight the accretion-disk emission is directly detected while for others it is obscured by the dust and gas within the torus. However, the obscuration can also come from the host galaxy (e.g., from dust-obscured star-forming regions; dust lanes) and is likely to be more significant for inclined and edge-on galaxies and for galaxies in gas-rich mergers since, on average, the typical optical depth along a given line of sight will be higher than for face-on normal galaxies (e.g., Goulding et al., 2012, Buchner & Bauer, 2017).
 |
Figure 2. Schematic representation of the AGN physical model, illustrating the broad scales of the key regions. The accretion disk, corona, broad-line region (BLR), and the dusty torus reside within the gravitational influence of the SMBH. The disk, corona, and torus (including polar dust clouds) are colored corresponding to the lines showing their contributions to the SED in Figure 1. The narrow-line region (NLR) is on a larger scale and under the gravitational influence of the host galaxy. Adapted from Ramos Almeida & Ricci (2017), courtesy of C. Ramos Almeida and C. Ricci. |
In addition to the accretion disk and torus there are two other key regions that we consider in this review for the identification of AGN: the broad line region (BLR) and the narrow line region (NLR). The BLR and NLR are defined based on the velocity width of the detected emission lines in AGN. Empirically, the BLR contains gas with a broader distribution of velocities than the NLR; the velocity width of the NLR is often constrained from the forbidden emission lines since the gas density in the BLR is too high for forbidden transitions. The typical range of velocity widths for the gas in the BLR is ≈ 1,000–10,000 km s−1 while for the NLR it is ≈ 100–500 km s−1 (e.g., Padovani et al., 2017). The different velocity widths of the BLR and the NLR are due to the relative location of the gas with respect to the SMBH. The gas in the BLR lies within the gravitational influence of the SMBH and, consequently, resides close to the accretion disk and is typically undetected in obscured AGN; see Figures 2 – 3. By comparison, the NLR gas lies under the gravitational influence of the host galaxy (e.g., Ho, 2009) and is produced on larger scales. The bulk of NLR emission generally originates within the central kpc (e.g., Humphrey et al., 2015, Villar-Martín et al., 2016), but for some systems emission from gas ionized by the AGN is observed on the scale of the entire galaxy, out to ∼10 kpc (e.g., Liu et al., 2013, Hainline et al., 2013, Hainline et al., 2014). Due to its extent, the NLR emission will generally not be obscured by the torus, although a large fraction of the emission could be obscured by dust in the galaxy.
The classical definition of an obscured AGN is the absence of emission from the BLR in the optical waveband (e.g., Antonucci, 1993). This corresponds to a typical obscuring screen (or “extinction”) from dust of ≈ 5–10 mags (typically defined in the V-band at 550 nm; i.e., AV = 5–10 mag; e.g., Burtscher et al. (2016), Schnorr-Müller et al. 2016). For typical dust-to-gas ratios (e.g., as measured in the Galaxy; Predehl & Schmitt 1995) this corresponds to an equivalent absorbing column density from gas measured in the X-ray band of NH > 1022 cm−2. The NLR can be detected in both obscured and unobscured AGN while the BLR is only expected to be detected in unobscured AGN; see Figure 3.
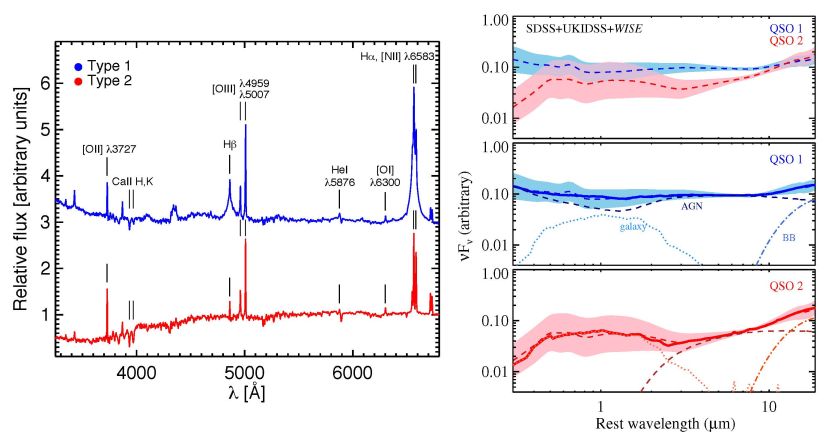 |
Figure 3. (Left) Composite optical spectrum of Type 1 (blue) and Type 2 (red) AGN from SDSS, adapted from DiPompeo et al. (2018), with the prominent emission lines highlighted. The primary differences between the spectra are the presence of bluer nuclear continuum and (by definition) broad permitted emission lines in the Type 1 AGN, while similar narrow AGN lines are observed in both spectra. (Right) Composite optical–MIR SEDs of Type 1 and Type 2 quasars selected from SDSS, using data from SDSS, UKIDSS, and WISE (Hickox et al., 2017). The composite SEDs are modeled with contributions from a (reddened) AGN (dashed lines), the host galaxy (dotted lines), and an empirical blackbody component representing emission from cooler dust (dot-dashed lines). The SEDs are dramatically different in the optical due to reddening of the AGN continuum, but are very similar in the mid-IR, highlighting the power of mid-IR observations to select obscured AGN. Figures modified from DiPompeo et al. (2018), courtesy of M. DiPompeo, and Hickox et al. (2017). |
The absence of direct emission from the accretion disk makes obscured AGN more challenging to identify than unobscured AGN for two key reasons:
The impact of these two effects is dependent on the wavelength, the amount of obscuration, and the relative ratio of the observed emission from the AGN and the host galaxy. This is illustrated in Figure 4, which shows schematic multi-wavelength images and SEDs for an AGN plus the host galaxy for varying levels of nuclear obscuration (parameterized by the hydrogen column density NH) and the strength of the AGN emission relative to the host galaxy (given by the fraction of the intrinsic emission from the AGN at 1 µm, fAGN). It is immediately clear that some AGN signatures are heavily suppressed due to obscuration or dilution from the host-galaxy emission, while others remain visible; however the precise observability of these signatures depends on many parameters including the AGN luminosity and the shape of its intrinsic spectrum, the characteristics of the host galaxy, and the geometry and physical nature of the obscuring material. The wavelength dependent impact of obscuration and host-galaxy dilution on the identification of obscured AGN are discussed in more detail in Section 2.
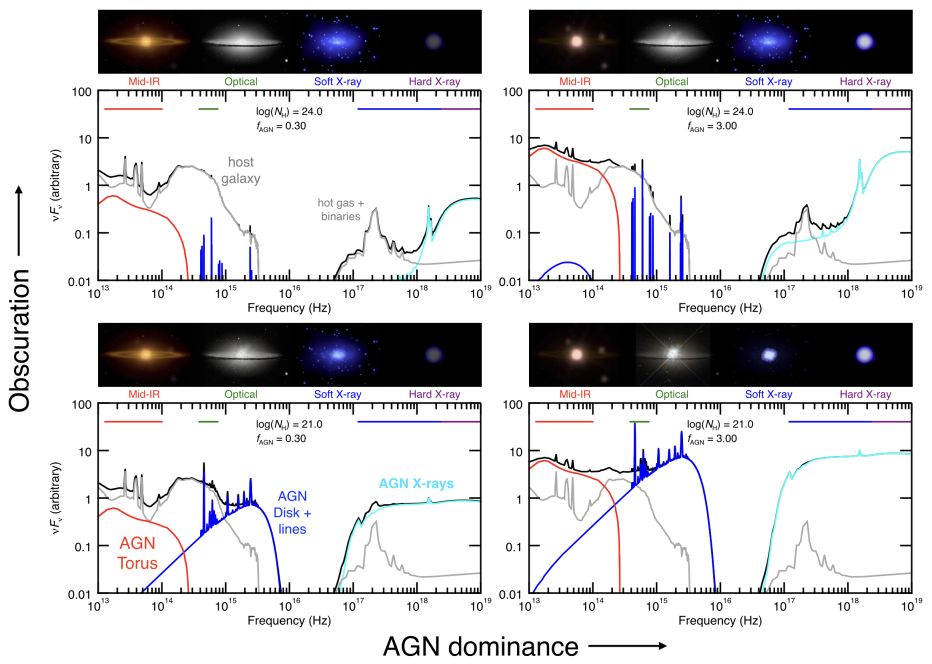 |
Figure 4. Schematic demonstrations of the multi-wavelength observational signatures of an AGN as a function of nuclear obscuration (increasing from bottom to top) and the relative luminosity of the AGN to the host galaxy (increasing from left to right). The nuclear obscuration is parameterised by NH and the relative luminosity of the AGN to the host galaxy is based on the fraction of the intrinsic emission from the AGN at 1 µm (fAGN). The bottom component of each panel shows the overall model SED (red: AGN component; green: host-galaxy component; black: combination of AGN and host galaxy), indicating the emission from the host galaxy and the AGN. IR and optical spectral components are taken from Harrison (2014) and (Assef et al., 2010), optical AGN lines from Vanden Berk et al. (2001), and X-ray spectra from Revnivtsev et al. (2008) and Baloković et al. (2018). The top component of each panel indicates the broad features predicted to be observed in imaging data in the mid-IR, optical, and X-ray bands on the basis of the model SED, based on images of the galaxy M104 and quasar 3C 273 (images courtesy NASA). An animation of this figure, showing the effects of continuous changes in NH and fAGN, is available at www.dartmouth.edu/~hickox/hickox_alexander_AGN.php. |
1.2. The importance of identifying obscured AGN
The identification of obscured AGN has broad implications for observational cosmology. The majority of the AGN population is obscured and therefore the construction of a complete census of AGN activity requires the identification of both obscured and unobscured sources. A complete census of AGN activity is required to reliably measure the cosmological buildup of SMBHs and to place fundamental constraints on the average radiative efficiency of SMBH growth; we explore this more in Section 5. In the unified AGN model the difference between an obscured and unobscured AGN is the orientation of the dusty torus with respect to the observer. Therefore, in some sense the identification of all obscured AGN may appear to be just a simple book-keeping exercise (i.e., just accounting for the fraction of the AGN population that are obscured and therefore not included in unobscured AGN selection approaches). However, the obscured AGN fraction is found to be a function of AGN luminosity and potentially redshift, and is therefore not simply a single value (see Section 3). Furthermore, obscured AGN are more likely to be found in more dust and gas rich environments than unobscured AGN and, therefore, the lack of a complete census of obscured AGN could give a skewed view of the host-galaxy and larger-scale environments in which AGN reside (see Sections 4 and 5).
This review aims to provide an overview of our observational and theoretical understanding of obscured AGN. In Section 2 we describe the challenges in identifying obscured AGN and assess the effectiveness of the most common techniques, emphasizing two key factors: how reliable and how complete a given technique is for the identification of obscured AGN. In Section 3 we present the overall demographics of obscured AGN activity. In Section 4 we discuss the physical nature of obscuration in AGN and consider the relative contributions of obscuration from the nuclear torus, nuclear starburst regions, and structures on the scale of the host galaxy. In Section 5 we assess the implications of obscured AGN for observational cosmology and explore the significance of obscured AGN for SMBH–galaxy growth and the cosmological radiative efficiency of SMBH growth. Finally in Section 6 we summarise our conclusions and discuss the prospects for future observations and theoretical models to advance the study of obscured AGN. We note that due to space limitations we have had to be selective in our choice of cited articles and we apologize in advance for the many significant studies that we have been been unable to include. We encourage the reader to also consult the following complementary reviews on the identification of AGN, the co-evolution of AGN and galaxies, and the unified model of AGN: Ho (2008), Alexander & Hickox (2012), Heckman & Best (2014), Brandt & Alexander (2015), Netzer (2015), Padovani et al. (2017), and Ramos Almeida & Ricci (2017).
1 We note that this model may only be appropriate for high-accretion rate AGN (typical L / LEdd > 10−3), which are the focus of this review. See Done, Gierliński & Kubota (2007) and Yuan & Narayan (2014) for discussions of low-accretion rate systems. Back.