


The idea of “tensions” has already come up. So let's take that particular bull by the horns right now. There are several different minor chinks in the armour of the SMC that are pointed to by various researchers. A list of some of them is given in Table IV. None are sufficiently significant to call them an actual discrepancy, hence the use of the word “tension” [21]. What should a skeptic make of an apparent disagreement between different data sets at the 2–3 σ level?
| The amplitude σ8 between CMB and cluster abundance |
| Galaxy cosmic shear versus CMB constraints on σ8 Ωm0.5 |
| H0 between traditional direct estimates and indirect CMB estimates |
| Planck versus WMAP TT power spectra |
| Planck high-ℓ versus low-ℓ data |
| Preference for AL > 1 (apparent lensing effect) in Planck data |
| Small-scale galaxy formation controversies |
Well, let's remember that today's CMB data contains more than 1000 σ worth of detection. We can ask how many 3 σ results there are in 1000 σ. Since signal-to-noise ratios add quadratically, the answer is the number of times that 32 goes into 10002, and the answer is more than 100,000. So why is there so much focus on specific issues that are barely at the 3 σ level?
Of course part of the answer is that we shouldn't accept that the SMC is the last word, but should keep an open mind to other possibilities. There's also a strong motivation to look for flaws that require revisions, since we're all hoping to find fundamentally new physics by further confronting the SMC with cosmological data. And there may be evidence of such things lurking in low S / N disparities. The trick of course is to find the hints of disparity that grow from mere “tensions” into genuinely significant differences.
However, concentrating on a few of the > 100,000 potential 3-ish σ effects seems like a misplaced kind of skepticism. Trying to find minor deficiencies in conventional wisdom seems to me to be a bit like chasing conspiracy theories. In any situation, you can always find something that doesn't seem to make sense – but you should be assessing the evidence carefully, bearing in mind the context. Here the context is: (1) that the model (the SMC) fits a number of observational phenomena very well; (2) that some of the uncertainties are of a systematic rather than statistical nature; and (3) that there are a very large number of potential tensions that could be selected from the > 1000 σ of measured information.
Let's look at a couple of aspects of the history of the development of the SMC in order to see if there are any lessons we can learn. Although the SMC was already in place by the early 1990s, there are some observations that have changed considerably since that time. In particular, determinations of the age of the Universe (from estimating the ages of the oldest globular clusters) and determinations of the baryon abundance (coming from Big Bang nucleosynthesis) changed in value in the mid-1990s. Figure 4 shows the situation for cluster ages. The values plotted come from a representative selection of papers by several of the groups working on this problem at that time. In the early 90s the oldest clusters were stated to be perhaps 17 billion years old, with lower limits at around the 15 billion year level. However, in hindsight it is clear that those estimates were incorrect because they were dominated by systematic uncertainties. As other cosmological measurements improved, and it became clear that the Universe had an age that was probably no more than 14 billion years, the cluster ages were revised to become consistent. One might imagine that the change could be traced to one particular effect that was fixed – but that really isn't the case. Instead there were several tweaks made over the years, most of which had the same sign and resulted in the ages of the oldest clusters coming down to around 12 billion years. The situation is really not very satisfying! But I suspect this is often the way things are when the uncertainties are to do with assumptions and approximations in the analysis, rather than just being statistical.
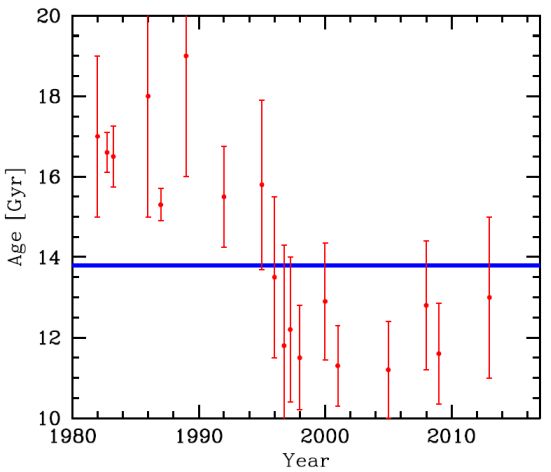 |
Figure 4. Estimated ages of the oldest globular clusters, taken from a representative set of review-like articles. The preferred value dropped dramatically in the mid-1990s. The blue band is the current best-fitting value for the age of the Universe, based on the 2015 Planck data (including uncertainty). |
The situation with baryon abundance is fairly similar. But here it is harder to make a plot of the values, since often there were no clear errors given! Instead it was common to write down some feasible range for the baryon-to-photon ratio, which was bracketed by different light-element abundances (with little effort made at that time to designate 95 % confidence ranges, or give ± 1 σ values, or the equivalent). Despite this difficulty in interpreting the uncertainties in the old results, what is clear is that the preferred value around 1990 was something like Ωbh2 ≃ 0.012, while 10 years later it was around 0.022. The change corresponded to a lot of σ (with whatever value of uncertainty you used). Again, there wasn't one reason for this change, but probably a list of things contributed to the increase (the availability of damped Ly α systems for deuterium abundance measurements being part of it).
The tension that perhaps attracts the most current attention is that some of the most recent and precise values for the Hubble constant, determined using standard distance-estimation techniques, appear higher than the value determined from the SMC parameters that best fit CMB data. Figure 5 shows a large collection of published H0 determinations from the period 1997–2010, including the error bars. The horizontal band gives an average of these data (using procedures developed to deal with apparently disparate nuclear and particle physics data [23]). The newer value from Riess et al. (2011) [24] is indicated, together with values coming from WMAP and Planck. Other recent values could be added, but wouldn't change the basic picture. Placed in this context we can see the systematics-dominated history of attempts to directly determine H0 (which certainly goes back earlier than 1997!). We have to assume that most sets of authors of historical values believed that their published uncertainties were a fair representation of their confidence in the data. And yet it's clear that at any given time the errors were being underestimated by most groups. Perhaps the situation is genuinely different now, and the new (smaller) error bars are correct. But it's hard not to be skeptical.
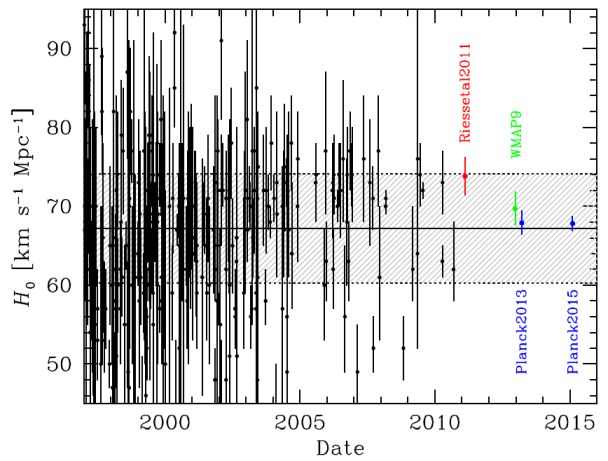 |
Figure 5. Estimates of the Hubble constant between 1997 and 2010, compiled by John Huchra (black points [22]). These values were combined into a best estimate (using practices for combining nuclear physics data) by Pritychenko [23], with this value and uncertainty represented by the hatched region. The new value published by Riess et al. in 2011 [24] is shown by the red point. The estimate derived from the full WMAP data set is shown in green [25]. The values obtained from the 2013 [7] and 2015 [3] Planck data releases are the two blue points. |
In any case, we know that measurement techniques are continuing to improve, and that if this CMB-versus-direct-determination tension in H0 arises from some genuinely new physics, then the statistical confidence in the differences will grow. Time will tell.
Turning to the example of Planck's large-scale versus small-scale constraints, there are some additional issues for the skeptic to keep in mind. As discussed in the Planck Collaboration Intermediate LI paper [26], this situation is not as simple as it might at first seem. There are certainly parameter shifts when one considers Planck low-ℓ versus Planck high-ℓ data, and these shifts may seem to be at the 2–3 σ level. However, the parameter space has six (or maybe five, considering that τ is hardly measured) dimensions, with many other directions in this space corresponding to particular parameter combinations. So one will see a 2 σ deviation in some direction more than 5 % of the time, and hence it's necessary to take into account the whole parameter set when assessing this kind of tension. When that is done, the differences of low-ℓ versus high-ℓ parameters have a probability to exceed above 10 % (i.e. nothing to write home about). On top of that, it's unclear how one is choosing the angular scale to look for a split. And there is also a difficulty in assessing how unlikely it might be for a data excursion to map onto a parameter shift. The conclusion is that Planck and WMAP are in spectacular agreement where they overlap, and the shifts seen at higher multipoles are just about as big as you'd expect the shifts to be. That's not to say that there might not also be problems with some of the foreground modelling, or indeed some physics missing from the SMC – it's just that the data don't require these things at the moment.