


In the previous section we discussed both empirical and physical models for the galaxy–halo connection, and the interplay between them. Here, we review the most important measurements that are currently used to inform the galaxy–halo connection: galaxy abundances (Section 3.1), galaxy clustering (Section 3.2), group and cluster catalogs (Section 3.3), weak gravitational lensing (Section 3.4), and additional observables including spatial statistics and scaling relations (Section 3.5). For a given cosmological model and galaxy formation model, the abundance of objects, the relationship between satellites and centrals, and the spatial distribution of galaxies are related through their galaxy–halo connection. This is true for any galaxy–halo connection, whether it derives from physical models or a parameterized functional form. In general, modeling approaches that make more physical assumptions (towards the left in Figure 1) are more predictive than more data-driven approaches. However, some empirical models make specific assumptions such that when we use them to describe one or a small set of observables, they immediately make predictions for a large set of other observables.
Given the assumption that galaxy properties and halo properties are closely connected, the most important constraint on the galaxy–halo connection for a given cosmological model (which in turn predicts the abundance of dark matter halos) is the abundance of galaxies as a function of stellar mass or luminosity, i.e., the stellar mass function (SMF) or the luminosity function. The SMF inferred from the measurements of galaxy abundance in the local universe is now a very statistically precise measurement (Bell et al., 2003, Li & White, 2009, Baldry et al., 2012, Bernardi et al., 2017), but there are still a number of important systematic issues that impact its normalization and mass scaling and can have consequences for the galaxy–halo connection and its interpretation. Constraints on the evolution of galaxy stellar mass functions have also improved significantly over the past decade (Pérez-González et al., 2005, Moustakas et al., 2013), leading to consequential improvements in the evolution of the galaxy–halo connection.
As discussed in Section 2, abundance matching can be done directly, in a non-parametric way that reproduces the observed galaxy SMF (or the luminosity function) by construction. Alternatively, it can be done parametrically, with a function that maps halo mass—or alternative halo properties—onto galaxy stellar mass. The free parameters are then constrained by the measurements of the SMF.
The relationship between galaxy abundance, galaxy clustering, the halo occupation, and the galaxy-to-halo mass ratio for this parameterized model is shown in Figure 3. The parameterization used here is taken from Behroozi, Conroy & Wechsler (2010), with the main features being characteristic mass scales for M∗ and Mh, which constitute the location of the pivot point in the SHMR, and power-law slopes above and below the pivot point. A model that describes the abundance data well is shown in Figure 3b. These data were measured independently for the present work. They represent the SMF at z = 0 based on data from SDSS DR7 (Abazajian et al. 2009) using the stellar masses of Chen et al. (2012). Other curves show models that have pushed the pivot point too high and too low. These models clearly fail to reproduce the abundance of galaxies: moving the pivot point too low yields too many low-mass galaxies and fails to produce any at the high mass end, while a pivot point too high has the opposite effect. The filled circles on each SHMR curve show the halo mass scale at which the galaxy mass is M* = 1011 M⊙, on average. In all of these models, we have set the log-normal scatter in logM∗ at fixed Mh to be 0.2 dex. Modifying the power-law slopes of the SHMR will have a similar effect: altering the SMF slope at the high or low mass end will change the slope of the SHMR. The general shape and amplitude of the fit produced in Figure 3 echoes the compilation of results shown in Figure 2 — a pivot point at Mh ∼ 1012 M⊙, a steep slope at lower masses and a shallower slope at higher masses. We note that at low masses (stellar masses below ∼ 109 M⊙), there is evidence of a break in the SMF power law to produce more galaxies than a fixed slope would produce, leading to an increasing SHMR at the low mass end.
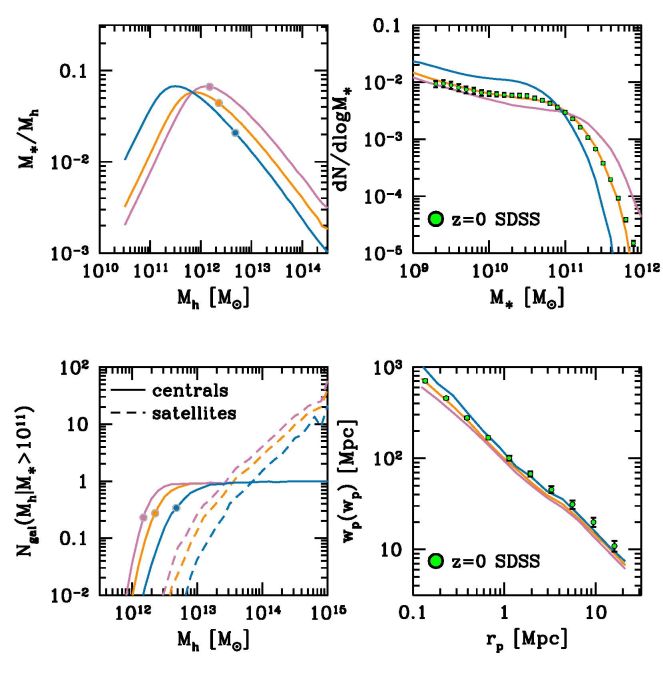 |
Figure 3. Examples of the SHMR. Upper left: The M∗ / Mh ratio for three parameterized SHMRs. The middle (orange) curve is constrained to match the stellar mass function at z = 0 (Upper Right), whereas the other models (blue and green curves) show the sensitivity of the mass function to changes in the SHMR. The filled circles in each curve indicate the halo mass at which the mean M∗ is 1011 M⊙. Bottom left: The mean halo occupation function for galaxies with M∗ > 1011 M⊙ predicted by each SHMR model. Here, the filled circles show the same halo mass as the circles in the upper left. Bottom right: Predictions for the projected correlation function of these galaxies, with SDSS measurements for comparison. All model calculations are performed using the public halo catalogs from the Bolshoi-Planck simulation (Klypin et al. 2016). Abbreviations: SDSS, Sloan Digital Sky Suryve; SHMR, stellar-to-halo mass relation. |
3.2. Two-point galaxy clustering
Because the abundance of dark matter halos is connected to their clustering properties, a given abundance matching or parameterized SHMR model makes a prediction for the clustering of galaxies. Once the parameters of the model have been set — the scatter, the abundance matching variable — there is no more freedom in the model after fitting for the galaxy abundance. The bottom panels of Figure 3 show the predictions each of the SHMR models make for the mean occupation function and clustering of galaxies with M∗ ≥ 1011 M⊙. The filled circles in the bottom left correspond to the same Mh as the filled circle in the top left panel. Although these are non-parametric estimates of the HOD, the shapes are well-matched by the functional forms for central and satellite galaxies discussed earlier. Increasing or decreasing the halo mass scale at M∗ = 1011 M⊙ increases and decreases the overall mass scale of the HOD. This has the impact of increasing and decreasing the clustering of galaxies.
For HOD and CLF models, abundances alone cannot constrain the parameters of the models. This is because the number of satellites within a halo is a parameterized function, rather than mapped onto the substructure in a simulation. Thus, measurements that provide information about the halo mass are necessary to constrain the parameters of the HOD and CLF. Galaxy clustering is perhaps the most commonly used; galaxy clustering at r < 1 Mpc is highly sensitive to the fraction of galaxies that are satellites because the number of pairs within a halo increases with the square of the number of satellites. Clustering at larger scales is most sensitive to the overall halo mass scale and the scatter between halo mass and the observable quantity by which galaxies are selected. The halo occupation framework predicts a transition scale in the clustering of galaxies at r ∼ 1 Mpc. This transition scale naturally explains the deviations from a power-law measured in the clustering of galaxies (Zehavi et al., 2004, Zehavi et al., 2005), as well as its evolution as a function of galaxy luminosity and redshift (Conroy, Wechsler & Kravtsov, 2006). A convenient way to quantify large-scale clustering of a sample of objects is by their bias relative to dark matter. Bias generically is related to the ratio between the clustering of the objects and that of the dark matter: b2 = ξ / ξm, where ξ is the two-point correlation function of galaxies and the subscript m denotes matter. Bias is usually quantified at large scales, i.e., r > 10 Mpc. The bias of dark matter halos has a non-linear dependence on Mh — low mass halos have a roughly constant bias, while at higher masses bias rises rapidly with increasing Mh. Thus, for the three different models presented in Figure 3, the bias of the model increases monotonically with the characteristic halo mass indicated by the filled circles.
This does not mean that clustering has no information to offer for abundance-matching models. As we discuss in Section 4, models with different assumptions regarding how galaxies are matched to halos can change the relative rank-ordering of halos and subhalos, thus shifting the relative populations of central and satellite galaxies. Scatter can also not be constrained by abundances alone. The only way to discriminate between these models is to bring in information other than galaxy abundances, from clustering or one or more of the other observables described below (see further discussion in Section 4.3).
3.3. Group and cluster catalogs
An alternative method to constrain the galaxy–halo connection is to find individual dark matter halos observationally and measure the galaxy content within them. Galaxy clusters are relatively easy to find in observational data owing to their large mass and the large number of galaxies contained within them. Figure 2 includes measurements of the SHMR at the cluster mass scale from Kravtsov, Vikhlinin & Meshcheryakov (2018) using X-ray observations to detect clusters and Hansen et al. (2005) using optical imaging data. Optical cluster catalogs can now also be extended to very large volumes and to significantly higher redshift, for example using red sequence techniques like RedMaPPer (Rykoff et al., 2014, Rykoff et al., 2016); given the statistical power of these data sets, the primary challenge in using these to infer the galaxy–halo connection is a full modeling of systematics in the mass–observable relation.
Modern day galaxy group catalogs are able to probe much lower halo mass scales. The group-finding algorithm of Yang et al. (2005) uses a variation of the abundance matching ansatz to assign dark matter halo masses statistically to all galaxies within a given sample. After an initial guess about which galaxies belong to groups and which do not, abundance matching is performed on the total group stellar mass and the host dark matter halo mass function. Each galaxy is assigned a probability of being within a given dark matter halo, using these updated halo masses, and the process is iterated until convergence. The resulting halo occupation statistics that are derived from the final group catalog are in general agreement with those inferred from an HOD analysis of clustering (Yang, Mo & van den Bosch 2008, Tinker, Wetzel & Conroy 2011, Campbell et al. 2015). The application of this algorithm to SDSS data in Yang, Mo & van den Bosch (2009) is also presented in Figure 2. Groups can also be used in combination with two-point clustering (Sinha et al. 2017).
3.4. Weak gravitational lensing
It is straightforward to extend implementations of the galaxy–halo connection from models of the two-point clustering of galaxies to the cross-correlation between galaxies and matter (e.g. Tasitsiomi et al., 2004, Yoo et al., 2006, Cacciato et al., 2009, Leauthaud et al., 2012). Generally, the observational quantity being modeled is ΔΣ(Rp), the excess surface mass density at a projected distance Rp away from a galaxy, which is related to the galaxy-mass correlation function ξgm. If all galaxies were central, then ΔΣ(Rp) would simply be a measure of the projected dark matter halo profiles of all the galaxies in the sample being modeled. Satellite galaxies complicate the interpretation of the lensing signal, requiring a full model of the galaxy–halo connection.
Lensing generally has lower signal-to-noise than two-point clustering, but the constraints offered by a lensing analysis are complementary to that of an analysis only using clustering. Lensing directly measures the mass of the dark matter halos around galaxies, whereas in a clustering analysis the masses are inferred indirectly from the relationship between halo mass and clustering, as well as the constraints on the abundance of halos in a given cosmological model. As we discuss in Section 4.4, properties other than halo mass may influence clustering. Thus, a cross comparison of constraints on halo occupation from clustering and lensing is a necessary check on possible systematic errors or secondary parameters compared to using clustering alone.
Although the abundance of galaxies and their two-point clustering are the methods that have been most commonly used to statistically constrain the galaxy–halo connection, there is information on this relationship from nearly any measure of the spatial distribution of galaxies. Within the literature, these include satellite kinematics (van den Bosch et al. 2004, More et al. 2011), galaxy voids (Sheth & van de Weygaert 2004, Furlanetto & Piran 2006, Tinker et al. 2008a), counts-in-cells (Benson et al. 2000, Berrier et al. 2011), and three-point statistics (Marín et al., 2008, Guo et al., 2015). Measurements of the intracluster light around clusters and groups of galaxies can also provide important constraints that distinguish the merging and growth history of galaxies (Conroy, Wechsler & Kravtsov, 2007).
Scaling relations of the internal properties of galaxies, such as Tully-Fisher and Faber-Jackson (Tully & Fisher, 1977, Faber & Jackson, 1976), also offer information to the extent that dark matter influences the dynamics of visible matter (Dutton et al., 2010, Cappellari et al., 2013, Desmond & Wechsler, 2015, Desmond & Wechsler, 2017). At low masses, where large samples with observable spatial statistics are not yet available, these scaling relations provide the primary information about the galaxy–halo connection (McConnachie, 2012). Strong lensing can provide additional information about the masses of elliptical galaxies, at least in their inner regions (Sonnenfeld et al., 2015).