


To date, FRBs have only been detected in the radio band 5; no contemporaneous optical, X-ray or gamma-ray flash has been detected (e.g., Scholz et al., 2017, Hardy et al., 2017). This currently leaves us in the situation where we need to maximize what we can learn from the properties of the radio pulses themselves.
In Section 2, we presented the basic observed properties of FRBs – i.e. the parameters we use to characterize individual bursts. Propagation effects in the intervening material between source and observer lead to many of the important observed properties of FRBs, as well as their derived properties, and we discuss them in more detail here.
The signal from an extragalactic FRB will pass through material in the direct vicinity of the source (e.g., a supernova remnant or pulsar/magnetar wind nebula in some models), the interstellar medium of its host galaxy (ISMHost), the intergalactic medium (IGM), and finally through the interstellar medium of our own galaxy (ISMMW) before reaching our radio receivers 6. This intervening material can be ionized, magnetized, and clumpy on a range of scales.
Radio waves can be diffracted, refracted, absorbed and have their polarization state changed by the material along the line-of-sight between observer and astronomical source. Such propagation effects play an important role in our understanding of FRBs.
While searching a range of trial DMs increases the computational load of FRB surveys (Section 4.1), without this dispersive delay it would be even more challenging to separate astrophysical signals from human-generated RFI (which itself already presents significant limits to survey sensitivity). As already discussed, DM is also a vital – though nevertheless rough – proxy for estimating Galactic distances and the redshift to extragalactic sources. Indeed, this was the original – and for all but one published FRB, the only – evidence that FRBs originate at extragalactic distances; first and foremost, it is what separates them observationally from sporadically emitting pulsars (e.g. Fig. 2).
Beyond dispersive delay, and as with radio pulsars, FRB pulses can also show other propagation effects: e.g., scintillation, scattering and Faraday rotation. All of these effects carry important clues about the local environments and galactic hosts of FRBs. At the same time, we need to disentangle these effects to recover information about the intrinsic signal produced by the FRB source itself.
We record FRB data using the widest possible range of radio frequencies (a bandwidth, Δν), in order to improve sensitivity. Nominally, the sensitivity scales as √Δν, but a wider frequency range has the added advantage of detecting signals that peak in brightness at particular frequencies, as opposed to following a broadband power-law (e.g., Spitler et al., 2016, Gajjar et al., 2018, Hessels et al., 2018). Additionally, these propagation effects have strong frequency dependencies (becoming much stronger at lower radio frequencies), and mapping their evolution across the widest-possible range can help in disentangling extrinsic propagation effects from the intrinsic signal properties.
Here we outline these various propagation effects, paying particular attention to how they are relevant to FRB observations and the scientific interpretation of the signals. A much more detailed and fundamental description of propagation effects in radio astronomy, in general, can be found in reviews such as Rickett (1977), Rickett (1990). An overview in the context of pulsar observations can be found in Cordes and Lazio (2002) and Chapter 4 of the Pulsar Handbook (Lorimer and Kramer, 2012), where – presumably unlike FRBs – the velocity of the source produces significant proper motion and leads to changing propagation effects with time.
In a dispersive medium, the velocity of light is frequency dependent. The ionized interstellar and intergalactic media are dispersive, and for a typical FRB DM = 500 cm−3 pc (Eq. 2) and observing frequency of 1.4 GHz this delays the signal by approximately one second compared with infinite frequency:
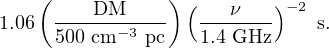 |
(14) |
When considering the observed DM of an FRB, the contributions from different components along the line of sight from Eq. 7 can be further separated as:
 |
(15) |
where the contributions to the DM from these various ionized regions are summarized in Table 1. Note that the expected DMHost and DMLocal depends strongly on host galaxy type and local environment, and thus can serve to distinguish between progenitor models.
| Variable | Type | DM contribution (cm−3 pc) |
| DMIono | Earth ionosphere | ∼ 10−5 |
| DMIPM | Interplanetary medium of Solar System | ∼ 10−3 |
| DMISM | Galactic interstellar medium | ∼ 100−103 |
| DMIGM | Intergalactic medium | ∼102−103 |
| DMHost | Host galaxy interstellar medium | ∼100−103 |
| DMLocal | Local FRB environment | ∼100−103 |
Unfortunately, since the observed DMFRB is the sum of these contributions, it is only possible to estimate the separate contributions by using models of the Galactic and extragalactic contribution, along with complementary information about the properties of the host galaxy and the FRB’s local environment (e.g., Tendulkar et al., 2017, Bassa et al., 2017b). Ultimately, the accuracy of these models and assumptions will likely limit our ability to use FRBs as probes of the intergalactic medium, unless such complicating factors can be overcome by having statistics from a very large population of observed sources (Macquart et al., 2015, and references therein).
Unlike with Galactic pulsars, cosmological redshift corrections are also relevant (see Section 2). At a more subtle level, determining an accurate FRB DM can be more challenging if the pulse shape changes with radio frequency. Metrics that aim to maximize pulse structure as opposed to band-averaged peak signal to noise will lead to different conclusions about the DM and the finest-time-scale pulse structure (Gajjar et al., 2018, Hessels et al., 2018). While pulsars show DM variations, this is dominated by the source's proper motion, which is expected to be negligible in the case of the much more distant FRBs. Nonetheless, in the case of repeating FRBs, DM variations could be expected in a dense, dynamic environment like that of a surrounding, expanding supernova remnant (Yang and Zhang, 2017, Piro and Gaensler, 2018).
Given their implied small emitting regions and large distances (Michilli et al., 2018a, Tendulkar et al., 2017), FRBs should be perfect point sources, and thus scintillate (unless there is significant angular broadening of the source).
Scintillation is caused by refractive and diffractive effects as the signal passes through the clumpy and turbulent intervening material, which has electron density variations on a variety of length scales. Delays imparted on the signal can cause destructive or constructive interference when these waves come back together. In the plane of the observer, this creates a complex frequency structure that varies with time. The relative motion between observer, source, and scattering medium dominates the time variability of the scintillation pattern observed at Earth. Examples of such dynamic spectra showing scintillation in pulsars can be found in many places, e.g. in Fig. 3 of Dolch et al. (2014). The characteristic frequency scale is called the scintillation bandwidth, while the characteristic timescale for a scintle to persist is called the scintillation time. The scintillation bandwidth scales strongly with radio frequency:
 |
(16) |
Although scintillation is expected, care is needed when interpreting spectral features in an FRB to differentiate which signal effects are plausibly due to propagation, and which might be intrinsic to the emission mechanism. The presence of RFI can also complicate the interpretation of fine-scale frequency structure.
Apparent scintillation 7 has been detected in bright FRBs like FRB 150807 (Fig. 4; and Ravi et al., 2016), where its origin is plausibly from weak scattering in the IGM or host galaxy. In the case of FRB 121102, fine-scale frequency structure has been ascribed to scintillation from the Milky Way (Gajjar et al., 2018) because the observed scintillation bandwidth matches well with the prediction from the Galactic electron density model NE2001 (Cordes and Lazio, 2002). If so, this means that the source was not significantly angularly broadened (Marcote et al., 2017) and still appeared point-like when it arrived at the Milky Way.
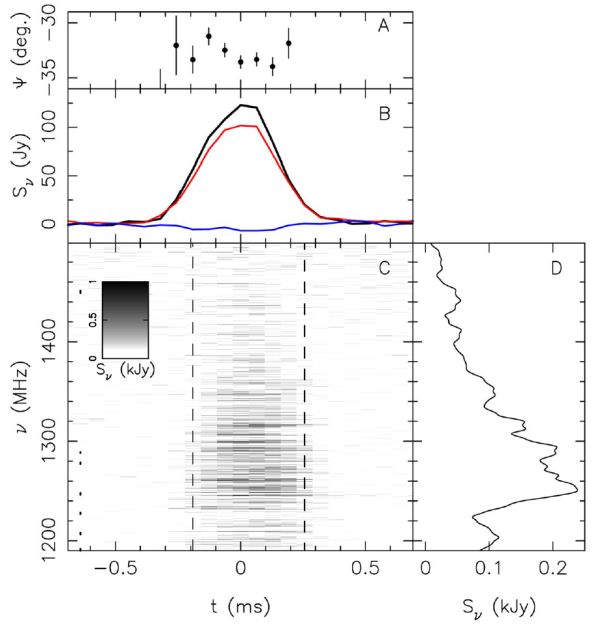 |
Figure 4. Apparent scintillation seen in FRB 150807. Panel C shows a dedispersed dynamic spectrum of the burst at 390-kHz spectral resolution. The inferred scintillation bandwidth is 100 ± 50 kHz. Panel B shows the frequency-averaged burst profile with total intensity (black), linearly polarized signal (red), and circularly polarized signal (blue). Panel A shows the polarization angle across the burst, and Panel D shows a smoothed version of the burst spectrum. Fig. 1 from Ravi et al. (2016). |
It is also interesting to consider whether scintillation has a significant influence on the detectability of FRBs and the overall inferred event rate. Macquart and Johnston (2015) invoked Galactic scintillation as a possible explanation for an apparent Galactic-latitude dependence in the FRB rate (Petroff et al., 2014), but this has been debated. Given that typical FRB search experiments record several hundred megahertz of bandwidth, and the expected Galactic scintillation bandwidth is ≲ 10 MHz (at 1.4 GHz) for most lines of sight, it is likely that Galactic scintillation is always averaged out and will not be a deciding factor in whether an FRB is detectable.
For FRBs with very high signal-to-noise ratios, it may be possible to study the time-frequency structure using the secondary spectrum method in which scintillation arcs are visible (Stinebring et al., 2001). Though this is unlikely to provide much insight into the FRB itself, it may be an interesting method for probing the properties of the intervening material.
While the picture we sketch above is typically termed ‘diffractive scintillation’, refraction associated with larger scales in the scattering screen could also cause broad focusing and defocusing of the FRB signal and result in smaller-amplitude intensity variations. This may be relevant for understanding the periods of apparent activity and quiescence in repeating FRBs, where refractive scintillation could play a role in pushing the source brightness above the instrumental detection level on timescales of weeks to months (Scholz et al., 2016).
FRBs can be temporally broadened by scattering, which induces multi-path propagation and thus a later arrival time for parts of the signal that travel along longer path lengths. In the simple case of a thin, and infinitely extended scattering screen this effectively convolves the FRB pulse with a one-sided exponential decay. In this simple picture, the decay time of this exponential tail scales strongly with frequency, as:
 |
(17) |
Scattering can also cause a detectable angular broadening of the source, which is observable using Very Long Baseline Interferometry (VLBI) (Marcote et al., 2017). One of the clearest examples of temporal scattering in an FRB is FRB 110220 (Fig. 5), where an exponential tail increasing as ν−4.0 ± 0.4 was measured (Thornton et al., 2013). While DM quantifies the column density of free electrons along the line-of-sight, the scattering measure (SM) describes their distribution:
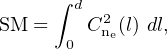 |
(18) |
where Cne2(l) indicates the strength of the fluctuations along the line-of-sight.
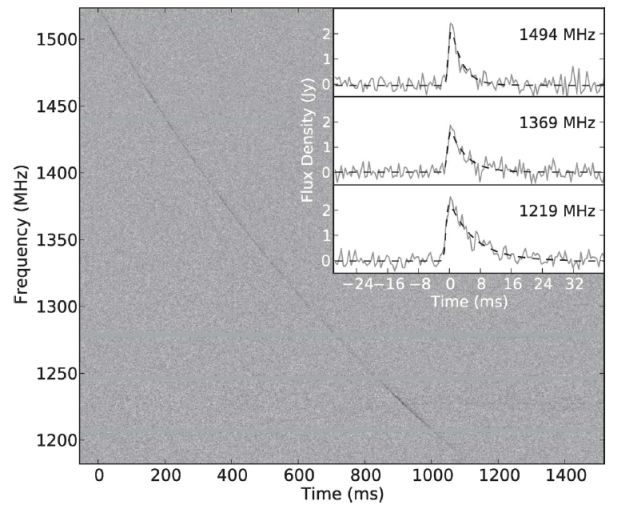 |
Figure 5. Scattering seen in FRB 110220. The main panel shows the dynamic spectrum of the burst and its dispersive sweep. The inset shows how the burst becomes asymmetrically broadened towards lower radio frequencies. Fig. 2 from Thornton et al. (2013). |
The SM can be determined empirically using scintillation measurements, pulse broadening from scattering, and angular broadening. However, these different methods can lead to disparate SMs because of different line-of-sight weighting for Cne2(l).
If one considers a transverse electromagnetic wave decomposed into right- and left-hand circularly polarized components, then electrons interacting with a magnetic field component along the direction of the traveling wave will cause the right-hand component to propagate faster. A polarized signal will have a linear polarization position angle Θ that changes with wavelength as:
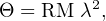 |
(19) |
where RM is the Faraday rotation measure. The relation between RM and physical parameters along the line of sight is given by:
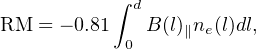 |
(20) |
where B(l)∥ is the magnetic field parallel to the line of sight. This is particularly nicely illustrated in Fig. 6, which shows the change in linear polarization angle for pulses from FRB 121102, an FRB with an extremely large (∼ 105 rad m−2) rotation measure. The sign of the RM gives the direction, where a positive RM indicates a magnetic field directed towards the observer. In a situation where the Faraday rotation is believed to originate predominantly in the local environment of the source and its distant host galaxy (e.g., Masui et al., 2015, Michilli et al., 2018a), then a redshift correction should also be made:
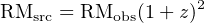 |
(21) |
As Eq. 20 shows, the measured RM is the sum of all contributions along the line of sight, and different Faraday regions along the way can have different directionality and add to or cancel each other out. Disentangling these various contributions is non-trivial, though it is likely that any observed RM variability (in the absence of equivalent DM variability) is from material local to the source (Michilli et al., 2018a). The RM contribution from the IGM may be very small (< 10 rad m−2) in many cases (Ravi et al., 2016), though if the burst passes through the hot medium of a galaxy cluster this can introduce a more sizable (∼ 50 rad m−2) contribution (Akahori et al., 2016). Like DM, there is a Galactic foreground that should be considered, and models exist to estimate this contribution for any particular line-of-sight (Oppermann et al., 2015).
 |
Figure 6. Faraday rotation seen in FRB 121102. Panels a and b show the values of the Stokes Q and U parameters across the measured frequency range, normalized to the total linear intensity. Panel c shows the residuals compared to a best-fit Faraday rotation model. The various colors represent measurements from separate bursts detected in the same observing session. Fig. 2 from Michilli et al. (2018a). |
Given that FRBs are likely produced in small emission regions viewed behind a number of distinct Faraday regions, it is reasonable to expect that – like pulsars (e.g., Sobey et al., 2019) – they will have Faraday thin spectra (the burst is a single pierce point through these regions). Rotation measure synthesis (Brentjens and de Bruyn, 2005) combined with the ‘rmclean’ deconvolution method (e.g., Heald et al., 2009) can indicate whether there is more complicated Faraday structure due to emission at a range of Faraday depths (for an application see, e.g., Michilli et al., 2018a). Furthermore, it has been proposed that Faraday conversion – in which linear polarization can convert to circular polarization (and vice versa) as a function of radio frequency – may be detectable in FRBs (Vedantham and Ravi, 2019, Gruzinov and Levin, 2019). If so, this could provide a powerful diagnostic of the magnetic field structure and medium surrounding the source.
If both DM and RM are measured, then one can infer the average line-of-sight magnetic field strength, weighted by electron density:
 |
(22) |
However, care is required here because the DM and RM need to be associated with the same region of magneto-ionic material, which may not be the case for many FRBs.
Any refractive medium can act as a lens, including plasma. Radio waves passing through a plasma are bent; in the plane of the observer these rays can overlap, causing bright caustic spots (Clegg et al., 1998). The effect is highly chromatic, meaning that the brightening occurs in specific frequency ranges, and can be time variable given that the source, lens, and observer are all moving with respect to each other and small relative motion can produce large brightness variations.
As dispersion demonstrates, FRBs travel through plasma in many distinct regions on their way to Earth, but there are also reasons to expect that there may be local, high-density plasma associated with FRBs. For example, if FRBs originate from particularly young neutron stars, then they may be embedded in nebulae or supernova remnants. As the Crab pulsar has demonstrated, plasma prisms or dense linear filaments can alter the shape of the observed pulse profiles, creating highly chromatic echoes (Backer et al., 2000, Graham Smith et al., 2011). More recently, plasma lensing has been convincingly demonstrated in the original Black Widow pulsar B1957+20, where the individual pulses can be amplified by factors up to 70 (Main et al., 2018). This effect is again highly chromatic, and the observed spectra of the pulses can vary on timescales comparable to the 1.6-ms pulse period. PSR B1957+20 is eclipsed by intra-binary plasma that has been blown off the companion star by the pulsar’s wind. The lensing events seen in PSR B1957+20 occur specifically around eclipse ingress and egress, suggesting that it is clumps in this intra-binary material that are acting as lenses.
Cordes et al. (2017) consider the relevance of plasma lensing for understanding both the spectra and apparent luminosities of FRBs. Plasma lensing could explain the highly variable radio spectra seen in the repeating FRB 121102, and in a more general sense it could potentially decrease the required energy per burst. The time-frequency pulse structure seen in FRB 121102 (Hessels et al., 2018) is also potentially explained by plasma lensing, which can create multiple images that will interfere with each other if the differential delay is within a wavelength.
These ideas will be best tested by ultra-wide-band observations that can map the spectra of FRB from ∼ 0.1 − 10 GHz. Plasma lensing may be occurring at some level, but the question remains how relevant this effect is for interpreting the properties of individual FRBs and the distribution of the population as a whole.
Dispersive delay is instrumental to the argument that FRBs are extragalactic in origin. Without a precise localization of the burst, it is the only proxy for distance that we have. Like for Galactic pulsars, measuring Hi absorption can provide complementary information to DM. It could conceivably also provide an independent confirmation of an FRB's extragalactic nature. Hi absorption comes from fine structure in the hydrogen atom’s quantum states, where the electron and proton spins can be aligned or anti-aligned. The corresponding absorption feature occurs at 1420.4 MHz, and frequency shifts of this line encode valuable kinematic information about the intervening gas.
Fender and Oosterloo (2015) consider Hi absorption in FRB bursts imparted by the Galactic spiral arms or extragalactic clouds. Detection of Hi absorption can set a firm lower limit on distance. However, Hi absorption is only detectable for very high signal-to-noise bursts passing through a high column density of neutral hydrogen. Existing telescopes might just barely be able to detect Hi absorption for bright FRBs at low Galactic latitudes. If we ever hope to detect absorption from extragalactic Hi clouds, then much higher sensitivities (like those provided by SKA) are going to be necessary. Because the Hi line is intrinsically very narrow and only somewhat broadened by kinematic effects, very high spectral resolution (ideally baseband) data will be needed to detect this signature in FRB data. It is likely worth the effort: Margalit and Loeb (2016) find that there is a ∼ 10% chance that neutral material in an FRB host galaxy will produce a detectable Hi absorption signature that can be used to infer the redshift directly from the FRB pulse.
If FRBs are found in dense environments (like a supernova remnant or active star-forming region), then their detectability at low radio frequencies (< 1 GHz) may be limited by free-free absorption. For fixed temperature and electron density, the opacity of an Hii region scales as ν−2.1.
The large event rate of FRBs, coupled with the large fields-of-view of low-frequency radio telescopes – especially aperture arrays like LOFAR and MWA – led to some early predictions that these should be phenomenal FRB-finding machines (Hassall et al., 2013). However, as yet no FRB has been detected below ∼ 400 MHz (CHIME/FRB Collaboration et al., 2019b), despite concerted efforts with GBT (Chawla et al., 2017), Arecibo (Deneva et al., 2016), LOFAR (Coenen et al., 2014, Karastergiou et al., 2015), and MWA (Sokolowski et al., 2018). While the intrinsic spectra of FRBs or temporal broadening from scattering may explain the dearth of detected FRBs at low frequencies, free-free absorption is potentially another contributing factor. Early detections from CHIME down to 400 MHz indicate that FRBs may indeed be detectable at lower frequencies, but a larger sample at these frequencies is needed to clarify the relevance of temporal scattering and free-free absorption, and whether the observed rate is lower at longer wavelengths.
5 DeLaunay et al. (2016) claim the detection of a contemporaneous gamma-ray counterpart to FRB 131104. However, given the low signal-to-noise and the fact that they needed to search a large positional uncertainty region, the association appears only tentative. Back.
6 Here we ignore any potential effects from the interplanetary medium of our Solar System or the Earth's ionosphere, both of which produce only very subtle effects compared to those imparted in the ISMHost, IGM and ISMMW. Back.
7 There are also other possible interpretations for fine spectral structure; e.g., see Ravi et al. (2016). Back.