
| © CAMBRIDGE UNIVERSITY PRESS 1999
| |


1.7.4 Numerical Simulations to Probe Smaller Scales
``Standard''  = 1 Cold Dark
Matter (SCDM) with h
= 1 Cold Dark
Matter (SCDM) with h  0.5
and a near-Zel'dovich spectrum of primordial fluctuations
(Blumenthal et
al. 1984)
until a few years ago seemed to many theorists to be the
most attractive of all modern cosmological models. But although SCDM
normalized to COBE nicely fits the amplitude of the large-scale flows
of galaxies measured with galaxy peculiar velocity data
(Dekel 1994),
it does not fit the data on smaller scales: it predicts far too many
clusters
(White,
Efstathiou, & Frenk 1993)
and does not account for their large-scale correlations (e.g.
Olivier et al. 1993,
Borgani et al. 1997),
and the shape of the power spectrum P (k) is wrong
(Baugh &
Efstathiou 1994,
Zaroubi et al. 1996).
But as discussed above,
variants of SCDM can do better. Here the focus is on CHDM and
0.5
and a near-Zel'dovich spectrum of primordial fluctuations
(Blumenthal et
al. 1984)
until a few years ago seemed to many theorists to be the
most attractive of all modern cosmological models. But although SCDM
normalized to COBE nicely fits the amplitude of the large-scale flows
of galaxies measured with galaxy peculiar velocity data
(Dekel 1994),
it does not fit the data on smaller scales: it predicts far too many
clusters
(White,
Efstathiou, & Frenk 1993)
and does not account for their large-scale correlations (e.g.
Olivier et al. 1993,
Borgani et al. 1997),
and the shape of the power spectrum P (k) is wrong
(Baugh &
Efstathiou 1994,
Zaroubi et al. 1996).
But as discussed above,
variants of SCDM can do better. Here the focus is on CHDM and
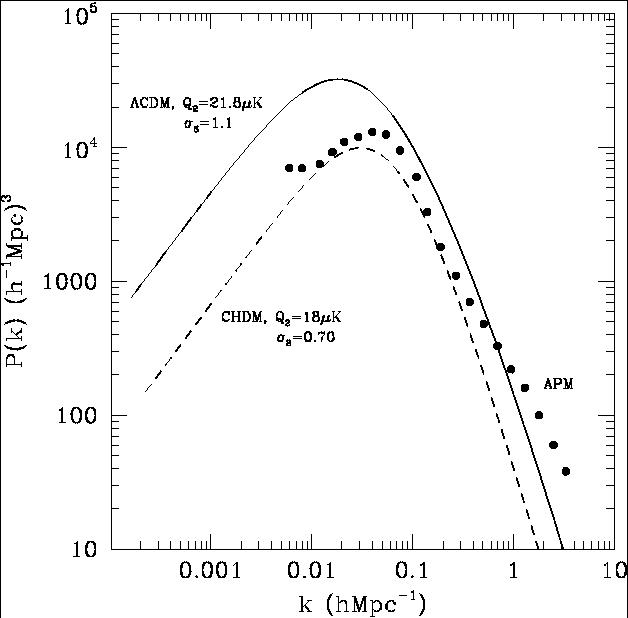
 CDM. The
linear matter power spectra for these two models are compared in
Fig. 1.8 to the real-space galaxy power
spectrum obtained from
the two-dimensional APM galaxy power spectrum
(Baugh &
Efstathiou 1994),
which in view of the uncertainties is not in serious
disagreement with either model for 10-2
CDM. The
linear matter power spectra for these two models are compared in
Fig. 1.8 to the real-space galaxy power
spectrum obtained from
the two-dimensional APM galaxy power spectrum
(Baugh &
Efstathiou 1994),
which in view of the uncertainties is not in serious
disagreement with either model for 10-2
 k
1 h
Mpc-1. The CDM and
CHDM models essentially bracket the range
of power spectra in currently popular cosmological models that are
variants of CDM.
k
1 h
Mpc-1. The CDM and
CHDM models essentially bracket the range
of power spectra in currently popular cosmological models that are
variants of CDM.
|
Figure 1.8. Power spectrum of dark matter
for |
The Void Probability Function (VPF) is the probability
P0(r) of
finding no bright galaxy in a randomly placed sphere of radius r.
It has been shown that CHDM with  = 0.3
predicts a VPF larger than observations indicate
(Ghigna et al. 1994),
but newer results based on our
= 0.2 simulations in which the
neutrino mass is shared equally between N = 2 neutrino species
(PHKC95)
show that the VPF for this model is in excellent
agreement with observations
(Ghigna et al. 1997),
as shown
in Fig. 1.9. However, our simulations
(Klypin, Primack,
& Holtzman 1996,
hereafter KPH96) of COBE-normalized
CDM with h = 0.7 and
0 = 0.3 lead to a
VPF that is too large to be compatible with a
straightforward interpretation of the data. Acceptable
CDM models
probably need to have 0 > 0.3 and h < 0.7, as discussed
further below.
= 0.3
predicts a VPF larger than observations indicate
(Ghigna et al. 1994),
but newer results based on our
= 0.2 simulations in which the
neutrino mass is shared equally between N = 2 neutrino species
(PHKC95)
show that the VPF for this model is in excellent
agreement with observations
(Ghigna et al. 1997),
as shown
in Fig. 1.9. However, our simulations
(Klypin, Primack,
& Holtzman 1996,
hereafter KPH96) of COBE-normalized
CDM with h = 0.7 and
0 = 0.3 lead to a
VPF that is too large to be compatible with a
straightforward interpretation of the data. Acceptable
CDM models
probably need to have 0 > 0.3 and h < 0.7, as discussed
further below.
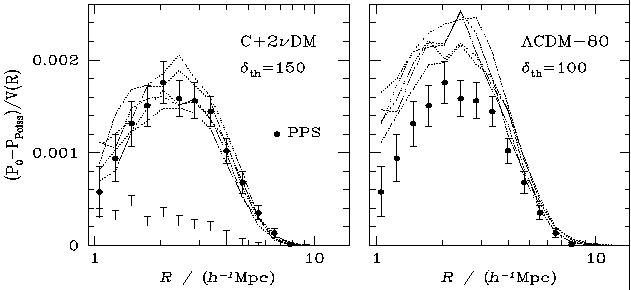
|
Figure 1.9. Void Probability Function
P0(R) for (left panel) CHDM with
h = 0.5 and |
Another consequence of the reduced power in CHDM on small scales is
that structure formation is more recent in CHDM than in
CDM. As
discussed above (in Section 1.4.7), this
may conflict with observations of damped Lyman
 systems in
quasar spectra, and other observations of protogalaxies at high
redshift, although the available evidence does not yet permit a clear
decision on this (see below). While the original
= 0.3 CHDM model
(Davis, Summers, &
Schlegel 1992,
Klypin et al. 1993)
certainly predicts far less neutral hydrogen in damped Lyman
systems
(identified as protogalaxies with circular velocities
Vc
systems in
quasar spectra, and other observations of protogalaxies at high
redshift, although the available evidence does not yet permit a clear
decision on this (see below). While the original
= 0.3 CHDM model
(Davis, Summers, &
Schlegel 1992,
Klypin et al. 1993)
certainly predicts far less neutral hydrogen in damped Lyman
systems
(identified as protogalaxies with circular velocities
Vc  50 km s-1) than is observed, as discussed already, lowering the hot
fraction to
0.2 dramatically improves this
(Klypin et al. 1995).
Also, the evidence from preliminary data of a
fall-off of the amount of neutral hydrogen in damped Lyman
systems for z
50 km s-1) than is observed, as discussed already, lowering the hot
fraction to
0.2 dramatically improves this
(Klypin et al. 1995).
Also, the evidence from preliminary data of a
fall-off of the amount of neutral hydrogen in damped Lyman
systems for z  3
(Storrie-Lombardi
et al. 1996)
is in accord
with predictions of CHDM
(Klypin et al. 1995).
3
(Storrie-Lombardi
et al. 1996)
is in accord
with predictions of CHDM
(Klypin et al. 1995).
However, as for all = 1
models, h 0.55
implies t0
12 Gyr, which conflicts
with the pre-Hipparcos
age estimates from globular clusters. The only way to accommodate both
large h and large t0 within the standard FRW
framework of General
Relativity, if in fact both h 0.65 and t0
13 Gyr,
is to introduce a positive cosmological constant
( > 0).
Low-0 models with
= 0 don't help much
with t0, and anyway are disfavored by the latest
small-angle cosmic microwave anisotropy data
(Netterfield et
al. 1997,
Scott et al. 1996,
Lineweaver &
Barbosa 1997;
cf. Ganga, Ratra,
& Sugiyama 1996
for a contrary view).
CDM flat cosmological models
with 0 = 1 -
0.3, where
 /
(3H02), were discussed as an alternative to
= 1 CDM since the beginning
of CDM
(Blumenthal et
al. 1984,
Peebles 1984,
Davis et al. 1985).
They have been advocated more recently (e.g.,
Efstathiou,
Sutherland, & Maddox 1990;
Kofman, Gnedin, &
Bahcall 1993;
Ostriker &
Steinhardt 1995;
Krauss & Turner 1995)
both because they can solve the
H0 - t0
problem and because they predict a larger fraction of baryons in
galaxy clusters than = 1
models (this is discussed in
Section 1.4.5 above).
/
(3H02), were discussed as an alternative to
= 1 CDM since the beginning
of CDM
(Blumenthal et
al. 1984,
Peebles 1984,
Davis et al. 1985).
They have been advocated more recently (e.g.,
Efstathiou,
Sutherland, & Maddox 1990;
Kofman, Gnedin, &
Bahcall 1993;
Ostriker &
Steinhardt 1995;
Krauss & Turner 1995)
both because they can solve the
H0 - t0
problem and because they predict a larger fraction of baryons in
galaxy clusters than = 1
models (this is discussed in
Section 1.4.5 above).
Early galaxy formation also is
often considered to be a desirable feature of these models. But early
galaxy formation implies that fluctuations on scales of a few Mpc
spent more time in the nonlinear regime, as compared with CHDM models.
As has been known for a long time, this results in excessive
clustering on small scales. It has been found that a
typical CDM model with
h= 0.7 and 0 = 0.3, normalized
to COBE on large scales (this fixes  8 1.1
for this model), is compatible with the number-density of galaxy clusters
(Borgani et al. 1997),
but predicts a power spectrum of galaxy
clustering in real space that is much too high for wavenumbers
k = (0.4-1)h / Mpc
(KPH96).
This conclusion holds if we assume
either that galaxies trace the dark matter, or just that a region with
higher density produces more galaxies than a region with lower
density. One can see immediately from
Fig. 1.7 and
Fig. 1.8 that there will
be a problem with this CDM
model, since the APM power spectrum is
approximately equal to the linear power spectrum at wavenumber k
0.6 h
Mpc-1, so there is no room for the extra power
that nonlinear evolution certainly produces on this scale -
illustrated in Fig. 1.10 for
CDM and in
Fig. 1.11 for CHDM. The
only way to reconcile the
0= 0.3
CDM model considered here
with the observed power spectrum is to assume that some mechanism
causes strong anti-biasing - i.e., that regions with high dark
matter density produce fewer galaxies than regions with low density.
While theoretically possible, this seems very unlikely; biasing rather
than anti-biasing is expected, especially on small scales (e.g.,
Kauffmann, Nusser,
& Steinmetz 1997).
Numerical hydro + N-body
simulations that incorporate effects of UV radiation, star formation,
and supernovae explosions
(Yepes et al. 1997)
do not show any antibias of luminous matter relative to the dark matter.
8 1.1
for this model), is compatible with the number-density of galaxy clusters
(Borgani et al. 1997),
but predicts a power spectrum of galaxy
clustering in real space that is much too high for wavenumbers
k = (0.4-1)h / Mpc
(KPH96).
This conclusion holds if we assume
either that galaxies trace the dark matter, or just that a region with
higher density produces more galaxies than a region with lower
density. One can see immediately from
Fig. 1.7 and
Fig. 1.8 that there will
be a problem with this CDM
model, since the APM power spectrum is
approximately equal to the linear power spectrum at wavenumber k
0.6 h
Mpc-1, so there is no room for the extra power
that nonlinear evolution certainly produces on this scale -
illustrated in Fig. 1.10 for
CDM and in
Fig. 1.11 for CHDM. The
only way to reconcile the
0= 0.3
CDM model considered here
with the observed power spectrum is to assume that some mechanism
causes strong anti-biasing - i.e., that regions with high dark
matter density produce fewer galaxies than regions with low density.
While theoretically possible, this seems very unlikely; biasing rather
than anti-biasing is expected, especially on small scales (e.g.,
Kauffmann, Nusser,
& Steinmetz 1997).
Numerical hydro + N-body
simulations that incorporate effects of UV radiation, star formation,
and supernovae explosions
(Yepes et al. 1997)
do not show any antibias of luminous matter relative to the dark matter.

|
Figure 1.10. Comparison of the nonlinear
power spectrum in the
|
Our motivation to investigate this particular CDM model was to
have H0 as large as might possibly be allowed in the
CDM class
of models, which in turn forces
0 to be rather small
in order to have t0
13 Gyr. There is little
room to lower the
normalization of this CDM
model by tilting the primordial power
spectrum Pp(k) =
Aknp (i.e., assuming np
significantly
smaller than the ``Zel'dovich'' value np = 1), since
then the fit to
data on intermediate scales will be unacceptable - e.g., the number
density of clusters will be too small
(KPH96).
Tilted CDM models
with higher 0, and
therefore lower H0 for t0
13 Gyr, appear to have a
better hope of fitting the available
data, based on comparing quasi-linear calculations to the data
(KPH96,
Liddle et al. 1996c).
But all models with a cosmological constant
large enough to help
significantly with the
H0 - t0
problem are in trouble with the observations summarized above
providing strong upper limits on : gravitational lensing, HST
number counts of elliptical galaxies, and especially the preliminary
results from measurements using high-redshift Type Ia supernovae.
It is instructive to compare the 0 = 0.3, h = 0.7 CDM model
that we have been considering with standard CDM and with CHDM. At
k = 0.5 h Mpc-1, Figures 5 and 6 of
Klypin,
Nolthenius, & Primack (1997)
show that the = 0.3 CHDM
spectrum and that of a biased CDM model with the same
8 = 0.67 are both in good
agreement with the values indicated for the power spectrum P (k) by
the APM and CfA data, while the CDM spectrum with
8 = 1 is
higher by about a factor of two. As Fig. 11
shows, CHDM with
= 0.2 in two neutrino species
(PHKC95)
also gives nonlinear P (k) consistent with the APM data.
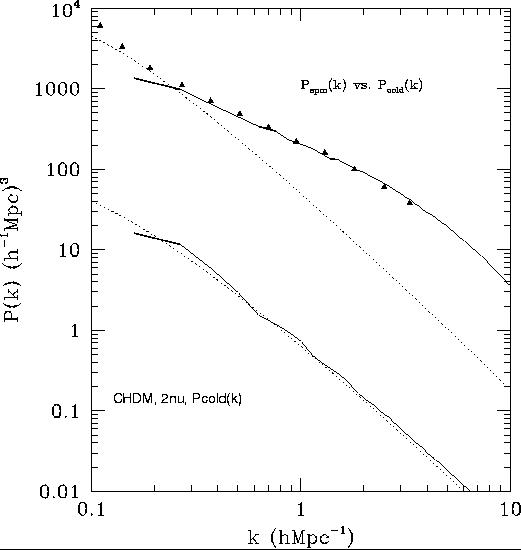
|
Figure 1.11. Comparison of APM galaxy power spectrum (triangles) with nonlinear cold particle power spectrum from CHDM model considered in this paper (upper solid curve). The dotted curves are linear theory; upper curves are for z = 0, lower curves correspond to the higher redshift z = 9.9. (From Primack & Klypin 1996.) |
 R3 / 3. Each plot shows also
P0(R) for five typical different locations in
the simulations
(dotted lines) to give an indication of the sky variance. Data points
are the VPF from the Perseus-Pisces Survey, with 3
R3 / 3. Each plot shows also
P0(R) for five typical different locations in
the simulations
(dotted lines) to give an indication of the sky variance. Data points
are the VPF from the Perseus-Pisces Survey, with 3 th for which the
P0 of each model best approaches the
observational data. In the top-left panel, the heavy ``T'' symbols at
the bottom sets the boundary of the region where the signal is
indistinguishable from Poissonian. They are obtained from the
3
th for which the
P0 of each model best approaches the
observational data. In the top-left panel, the heavy ``T'' symbols at
the bottom sets the boundary of the region where the signal is
indistinguishable from Poissonian. They are obtained from the
3