


There are a number of systematic uncertainties that affect the determination of H0 for all of the relative distance indicators discussed in the previous sections. These errors differ from the statistical and systematic errors associated with each of the individual secondary methods, and they cannot be reduced by simply combining the results from different methods. Significant sources of overall systematic error include the uncertainty in the zero point of the Cepheid PL relation, the effect of reddening and metallicity on the observed PL relations, the effects of incompleteness bias and crowding on the Cepheid distances, and velocity perturbations about the Hubble flow on scales comparable to, or larger than, the volumes being sampled. Since the overall accuracy in the determination of H0 is constrained by these factors, we discuss each one of these effects in turn below. For readers who may wish to skip the details of this part of the discussion, we refer them directly to Section 8.7 for a summary.
8.1. Zero Point of the PL Relation
It has become standard for extragalactic Cepheid distance determinations to use the slopes of the LMC period-luminosity relations as fiducial, with the zero point of the Cepheid period-luminosity relation tied to the LMC at an adopted distance modulus of 18.50 mag (e.g., Freedman 1988). However, over the past decade, even with more accurate and sensitive detectors, with many new methods for measuring distances, and with many individuals involved in this effort, the full range of the most of distance moduli to the LMC remains at approximately 18.1 to 18.7 mag (e.g., Westerlund 1997, Walker 1999, Freedman 2000a, Gibson 2000), corresponding to a range of 42 to 55 kpc.
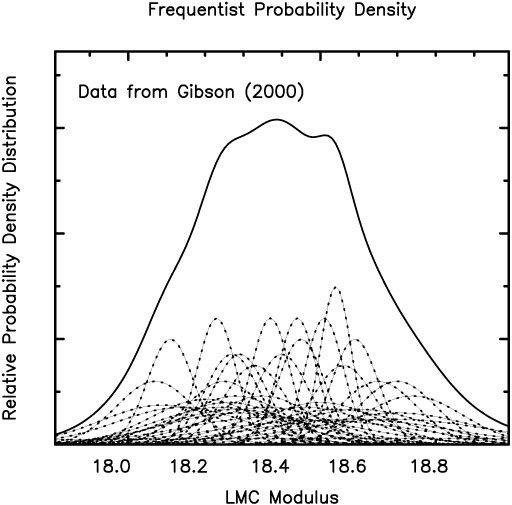
For the purposes of the present discussion, we can compare our adopted LMC zero point with other published values. We show in Figure 5, published LMC distance moduli expressed as probability density distributions, primarily for the period 1998-1999, as compiled by Gibson (2000). Only the single most recent revision from a given author and method is plotted. Each determination is represented by a Gaussian of unit area, with dispersions given by the published errors. To facilitate viewing the individual distributions (light dotted lines), these have been scaled up by a factor of 3. The thicker solid line shows the cumulative distribution.
|
Figure 5. The distribution of LMC distance moduli as compiled by Gibson (2000) plotted as a continuous probability density distribution built up from the sum of individual unit-area gaussians centered at the quoted modulus, and broadened by the published internal random error. |
It is clear from the wide range of moduli compared to the quoted internal errors in Figure 5 that systematic errors affecting individual methods are still dominating the determinations of LMC distances. Some of the values at either end of the distribution have error bars that do not overlap (at several sigma) with other methods. At the current time, there is no single method with demonstrably lower systematic errors, and we find no strong reason to prefer one end of the distribution over the other. For example, while systematics in the Cepheid period-luminosity relation have been subjected to scrutiny for many decades, no accurate photometric zero point has yet been established based on astrometric distances and the zero point is still in debate (e.g., Feast & Catchpole 1997; Madore & Freedman 1998; Groenewegen & Oudmaijer 2000). The absolute astrometric calibration is statistically more reliable for the red clump method, but compared to many other methods, this method is still relatively new, and the systematics have not been studied in as much detail (Udalski 2000; Stanek et al. 2000).
In addition to the frequentist probability distributions, we have computed Bayesian probability distributions, assuming a uniform prior. The Bayesian and median or average frequentist methods yield excellent agreement at 18.45 and 18.47 mag, respectively. Another way of estimating the overall uncertainty is simply to estimate the overall average and the standard error of the mean, based on a mean distance for different methods, and giving each technique unit weight. An advantage of this procedure is that it simply averages over all of the inherent systematic uncertainties that affect any given method. There are 7 independent methods for measuring distances that are commonly applied to the LMC; these include Cepheids, the red clump, eclipsing binaries, SN1987A light echoes, tip of the red giant branch (TRGB), RR Lyraes, and Miras. The mean values of the LMC distance moduli and the standard error of the mean for each technique are given in Table 13, for the Gibson (2000) and Westerlund (1997) compilations. For the Gibson compilation, these averaged distance moduli range from 18.27 to 18.64 mag, with an overall mean of 18.45 mag, and an rms dispersion of ±0.15 mag. The standard error of the mean therefore amounts to ±0.06 mag. The mean based on the Westerlund data is in excellent agreement at 18.46 ± 0.05 mag.
From the above discussion, it can be seen that there still remains a range in distance moduli to the LMC based on a wide range of methods. However, our adopted Cepheid modulus of 18.50 ± 0.10 mag agrees with the mean and median of the distribution for other methods at the 2.5% level. (20) Given the remaining uncertainties, and the good agreement with other methods, we do not believe that a change in zero point is warranted at the current time. However, we note that the uncertainty in the distance to the LMC is one of the largest remaining uncertainties in the overall error budget for the determination of H0 . We note that if the distance modulus to the LMC is 18.3 mag, there will be a resulting 10% increase in the value of H0 to 79 km/sec/Mpc.
It would be extremely useful to have a calibration that is independent of the distance to the LMC. Very recently, a new distance has been independently measured to the maser galaxy, NGC 4258, a nearby spiral galaxy also useful for calibrating the extragalactic distance scale, which can provide an external check on the adopted LMC zero-point calibration. We briefly summarize the distance determination to NGC 4258 and its implications below.
8.1.1. NGC 4258: Comparison of a Maser and Cepheid Distance
Given the current uncertainties and systematics affecting the local distance scale, it would be highly desirable to have geometric methods for measuring distances, independent of the classical distance indicators. A very promising new geometric technique has recently been developed and applied to the galaxy, NGC 4258, a galaxy with an inner disk containing H2O masers (Herrnstein et al. 1999). Five epochs of measurements are now available for these masers, and both radial and transverse motions of the maser system have been measured. Assuming a circular, Keplerian model for the disk, Herrnstein et al. derive a distance to the galaxy of 7.2 ± 0.3 Mpc, with the error increasing to ± 0.5 Mpc allowing for systematic uncertainties in the model.
To provide a comparison with the maser distance,
Maoz et al. (1999)
used HST to discover a sample of 15 Cepheids in NGC 4258. Adopting a
distance modulus for the LMC of 18.50 mag, these authors determined a
Cepheid distance to NGC 4258 of 8.1 ± 0.4 Mpc, or 12% further
than the maser distance. These authors noted that the difference was
not highly significant, amounting to only
1.3 . However, with
the new LMC PL relations given in equations 1 and 2, and the
correction to the WFPC2 zero point discussed in
Section 2.5, the
revised Cepheid distance is in somewhat better agreement with the
maser distance at 7.8 ± 0.3r ± 0.5s Mpc
(Newman et
al. 2000).
Allowing for a metallicity correction of -0.2 mag/dex results
in a Cepheid distance of 8.0 Mpc. Based on the new calibration, the
Cepheid distance agrees to within
1.2- of the maser
distance. Unfortunately, however, the situation remains that there is
currently only one maser galaxy with which to make this comparison.
For the future, increasing the sample of maser galaxies for which
distance measurements can be made (for example, with ARISE, a proposed
radio interferometer in space) would be extremely valuable
. However, with
the new LMC PL relations given in equations 1 and 2, and the
correction to the WFPC2 zero point discussed in
Section 2.5, the
revised Cepheid distance is in somewhat better agreement with the
maser distance at 7.8 ± 0.3r ± 0.5s Mpc
(Newman et
al. 2000).
Allowing for a metallicity correction of -0.2 mag/dex results
in a Cepheid distance of 8.0 Mpc. Based on the new calibration, the
Cepheid distance agrees to within
1.2- of the maser
distance. Unfortunately, however, the situation remains that there is
currently only one maser galaxy with which to make this comparison.
For the future, increasing the sample of maser galaxies for which
distance measurements can be made (for example, with ARISE, a proposed
radio interferometer in space) would be extremely valuable
8.1.2. Resolving the Cepheid Zero-Point Discrepancy
Given the range of published LMC distance moduli (Figure 5), and the subtle systematic errors that must be affecting some (or all) of the distance methods, it appears unlikely that this zero-point uncertainty will be resolved definitively any time soon. Upcoming interferometry (NASA's SIM and ESA's GAIA) missions will deliver a few microarcsec astrometry, reaching fainter limits than Hipparcos (~ 20 mag); NASA's FAME will reach 50 microarcsec accuracy. These missions are capable of delivering 1% distances to many Galactic Cepheids. They will be critical for establishing a more accurate extragalactic distance scale zero point, and should provide accurate parallaxes for statistically significant samples of many distance indicators currently in use (e.g., Cepheids, RR Lyrae stars, red giant stars, red clump stars). In addition, SIM (currently scheduled for launch in 2008) may provide rotational parallaxes for some of the nearest spiral galaxies, thereby allowing the calibration to bypass the LMC altogether.
As described in Section 3.1, the standard approach to correcting Cepheid magnitudes for reddening by dust is to use a combination of bandpasses (V and I in the case of the H0 Key Project), and solve for the reddening using a Galactic extinction law (Freedman 1988). For a value of the LMC reddening appropriate to the Cepheid sample considered of E(V-I) = 0.13 mag, the reddenings in the HST Cepheid target fields range from E(V-I) = 0.04 to 0.36 mag, with an average of 0.19 mag (Table 4). As a check on possible systematic errors in the reddening determinations, recent H-band (1.6µm) photometry has been obtained for a total sample of 70 Cepheids in 12 galaxies, including IC 1613, M31, M81, M101, NGC 925, NGC 1365, NGC 2090, NGC 3198, NGC 3621, NGC 4496A, NGC 4536, and IC 4182 (Macri et al. 2001; Freedman et al. 2001). The Galactic reddening law of Cardelli et al. (1989) predicts E(V-H) = 1.98±0.16 E(V-I). For the galaxies with both NICMOS H-band and optical VI data (from the ground or HST), the slope of the correlation between the optical and near-infrared reddenings yields E(V-H) = [2.00 ± 0.22 E(V-I)] + 0.02 ± 0.04. This relation is based on the same VI Udalski et al. (1999) data used in the current paper. Hence, the IR data confirm the reddenings derived from the optical data alone, ruling out a significant systematic error in the reddening determinations.
As discussed in Section 3.2, recent empirical results suggest that there is a small dependence of the Cepheid period-luminosity relation on metallicity. In this paper, we have adopted a correction of -0.2 mag (10% in distance) for a factor of 10 in abundance (O/H). The observed fields in Cepheid-calibrating galaxies have a range in (O/H) abundance of about a factor of 30 (Ferrarese et al. 2000b). These abundances are those of HII regions in the Cepheids fields, calibrated on the scale of Zaritsky et al. (1994). The mean abundance of this sample (12 + log(O/H)) is 8.84 ±0.31 dex. This is higher than the LMC abundance of 8.50 dex (Kennicutt et al. 1998). The mean offset between the metallicity-corrected, and the uncorrected Cepheid moduli in Table 4 amounts to 0.07 mag or 3.5% in distance. We adopt this difference as the uncertainty due to metallicity. The effect is systematic, and with the exception of type II supernovae (Section 6.5), if no correction for metallicity is applied, the value of H0 is increased by ~ 4% (~ 3 km/sec/Mpc). Conversely, if the slope of the metallicity relation is -0.4 mag/dex, then the value of H0 is decreased by 3 km/sec/Mpc. We show in Figure 6, histograms of abundance distributions for the Cepheid calibrators for the secondary methods.

|
Figure 6. Histograms for the distributions of oxygen abundances (12 + log (O/H) ) from Ferrarese et al. (2000b) for the galaxies with Cepheid distances that calibrate type Ia supernovae, the Tully-Fisher relation, the fundamental plane, and surface brightness fluctuations. The metallicity of the LMC in these units is 8.50 dex. The total distribution is also shown. In the mean, most of the Cepheid fields observed have higher abundances than the LMC. |
8.4. Completeness / Bias Effects
An issue of recurring concern regarding the application of distance indicators is the extent to which incompleteness in the observed samples could lead to a bias in the derived distances. This effect has been discussed extensively in the literature, particularly in the context of the Tully-Fisher relation (e.g., Schechter 1980, Willick 1994; Giovanelli et al. 1997; Tully & Pierce 2000). For Cepheids, the concern derives from the fact that magnitude cut-offs in the Cepheid samples (imposed by the decreasing signal-to-noise ratios at faint magnitudes) will tend to select against the faintest variables thereby leading to systematically small (biased) moduli. The fact that the bias operates most strongly at the shortest periods will also tend to produce a flattening of the observed PL relation (e.g., see Sandage 1988); elimination of the shortest-period Cepheids from a sample will generally result in increased mean moduli, less affected by this bias.
This effect is illustrated in Figure A1 in Appendix A, along with an analytic derivation of the size of the bias. As more distant objects are observed, a brighter intrinsic magnitude cutoff will occur for the same apparent magnitude. The observed erroneous flattening of the PL slope extends to longer and longer periods including more and more of the available Cepheid sample. Similar biases occur for any standard candle possessing an intrinsic dispersion in luminosity: the larger the intrinsic dispersion of the relation being truncated, and the shallower the range of apparent magnitude being sampled, the larger the bias will be. For the Key Project application of the Tully-Fisher relation (Sakai et al. 2000), we adopted corrections for this incompleteness bias, based on simulations similar to those undertaken by Giovanelli et al. (1998). For Type Ia supernovae, the observed dispersion in the Hubble diagram amounts to only ~ 0.15 mag (e.g., Riess et al. 1998; Hamuy et al. 1996); hence, incompleteness biases are very small for this technique.
In the case of Cepheids, incompleteness biases are expected to be small for the methodology that we have adopted here. First, the intrinsic scatter is small, and second, as discussed in Section 3.4, we have applied a period cutoff above the limiting magnitude cutoff at the short-period end to reduce the incompleteness bias (Freedman et al. 1994b; Kelson et al. 1994; Ferrarese et al. 1996, 2000b). The scatter in the observed V-band PL relation amounts to ±0.16 mag (equation 1); the scatter in the I-band PL relation amounts to ±0.11 mag (equation 2); however, much of this scatter is physically correlated between bandpasses, so that the scatter in the W PL relation is small. After correcting for reddening, the correlated scatter in the combined relation for the true distance modulus (or equivalently, W: Section 3.1) is smaller, and amounts to only ±0.08 mag (equation 3). Hence, the resulting bias on the final distance modulus is negligible for most of the galaxies in the sample. As can be seen from the differences between columns 5 and 7 in Table 3, typically, the size of the bias corrections amounts to only a few hundredths of a mag in the reddening-corrected (true) modulus; in 2 cases (M81 and NGC 4414) they are as large as 0.08 and -0.08 mag (4% in distance), respectively, but the mean correction for the sample is only +0.01 mag.
8.5. Crowding / Artificial Star Tests
One of the most direct ways of assessing the quantitative effects of chance superpositions on the photometry is by adding artificial stars with known input magnitudes and colors into the actual HST images, and then recovering those stars using exactly the same techniques used to perform the original analysis (i.e., ALLFRAME and DoPHOT). While these experiments cannot provide numerical crowding corrections to the real Cepheids in the frames, they are powerful in quantifying the vulnerability of the photometric methods to crowding under each individual set of circumstances.
Artificial star tests for two Key Project galaxies have been carried out by Ferrarese et al. (2000c). Their analysis indicates that the bias due to crowding in individual WFPC2 frames, can be significant, ranging from 0.05 mag in a relatively uncrowded field of NGC 2541 (at 12 Mpc), to 0.2 mag for a crowded field in one of the most distant galaxies, NGC 1365. We note that the artificial stars in these frames were not inserted with random positions. Each field was divided up into a 10×10 array of cells each 65 pixels on a side; the probability that an artificial star would be added within a given cell was therefore proportional to the number of real stars in the cell. The measured bias goes in the expected sense of resulting in recovered magnitudes that are too bright, and it is a direct function of the stellar density in the field. However, when using the multi-epoch, V and I-band observations, and then imposing the same criteria on variable star selection as for the actual Cepheid sample (e.g., same error flags for deviant data points, same magnitude range applicable to the period range for the known Cepheids, the same procedure for reddening correction, etc.), the effect of this bias on the final determination of distances drops significantly, amounting to only 1% for ALLFRAME, and 2% for DoPHOT.
The Ferrarese et al. (2000c) results are consistent with an independent study by Saha et al. (2000), who have investigated the effects of crowding in the galaxy NGC 4639 (at a distance of ~ 25 Mpc, the largest distance measured by either the Key Project or Type Ia supernova teams). For this galaxy, the crowding bias in single epoch observations is found to be 4% (0.07 mag). Saha et al. do not explicitly extend their results to multi-epoch observations of Cepheids, for which, as noted above, the effect would be reduced even further. A different approach to placing limits on crowding effects comes from Gibson et al. (2000) and Ferrarese et al. (2000c), who have looked for a correlation with distance of residuals in the Tully-Fisher relation. No significant effect is found. Gibson et al. also see no systematic effects as would be expected for type Ia supernova peak magnitudes, nor a difference in the PC- versus WFC-based Cepheid distance moduli.
Very different conclusions have been reached recently by Stanek & Udalski (1999) and Mochesjska (2000). These authors have specifically investigated the influence of blending on the Cepheid distance scale. Blending is the close association of a Cepheid with one or more intrinsically luminous stars. Since Cepheids are young stars, they may be preferentially associated near other young stars. Stanek & Udalski conclude that this effect ranges from a few percent for nearby galaxies to ~ 15-20% for galaxies at 25 Mpc. However, the Stanek & Udalski results are based on an extrapolation from high-surface brightness regions in the bar of the LMC, and they do not make use of photometric reduction programs (like DoPHOT and ALLFRAME), which are designed for photometry in crowded fields. These authors simply sum additional contributions to the total flux to simulate crowding. Moreover, they do not allow for underlying background contamination, which become increasingly important for galaxies at larger distances. Hence, at present, it is not possible to compare these results directly to the analysis of H0 Key Project data.
In a comparison of ground based images of M31 with HST images, Mochejska et al. (2000) found that the median V-band flux contribution from luminous companions was about 12% of the flux of the Cepheid. They argued that ground based resolution in M31 corresponds to HST resolution at about 10 Mpc, and that blending will lead to systematically low distances for galaxies at such distances. A more recent study by this group for the galaxy M33, which has a much larger sample of stars, indicates that this effect amounts to only about 7% (Mochejska et al. 2001).
The exact size of this effect will depend on the true underlying distribution of stars in the frame, and the extent to which the actual Cepheids being measured are affected. We note that the galaxies with HST Cepheid distances for which blending effects are likely to be most severe are the inner field of M101, the high surface brightness galaxy NGC 3627, and the most distant galaxies searched, for example, NGC 4639.
To assess quantitatively the impact of unresolved blending effects on the final Cepheid distances would require simulations based on the distribution of Cepheids in a galaxy field unaffected by blending. This distribution could be scaled with distance and inserted at the same surface brightness levels encountered in each of the Cepheid target frames, and then recovered using the same techniques as used originally to analyse the original data frames. Ideally, several input distributions could be tested. Such a study is beyond the scope of the present paper, but is being applied, for example, to the Cepheids observed in M101 with NICMOS (Macri et al. 2001).
Naive tests, which, for example, assume constant surface brightness
between the Cepheid fields in nearby and distant galaxies, will not,
in general, correctly simulate the Key Project, where generally
low-surface-brightness fields were deliberately selected.
Examination of the statistics of the number densities of stars in the
vicinity of Cepheids in the Key Project frames bear this out. For the
present time, we view the 2% effect measured by
Ferrarese et
al. (2000c)
as a lower limit on the effects of crowding and blending, and,
adopt a conservative uncertainty of +5-0%
(1-).
8.5.1. Contamination from Companion Stars
We note that Cepheids can be located in binary systems, and the presence of true, physical companions has been established for Cepheids in both the Galaxy and the LMC. For Cepheids in the Galaxy, as well as for early (B-type) stars, the mass distribution of companions has been studied intensively, and is strongly peaked toward low masses (e.g., Evans 1995). The presence of binaries will add increased scatter to the underlying period-luminosity relation, including that for the LMC, where the binaries are unresolved. However, unless the frequency of Cepheid binaries varies significantly from galaxy to galaxy, the relative distances to galaxies will be unaffected.
8.6. Does the Measured Value of H0 Reflect the True, Global Value?
Locally, variations in the expansion rate due to large-scale velocities make measurement of the true value of H0 problematic. Thus, for an accurate determination of H0, a large enough volume must be observed to provide a fair sample of the universe over which to average. How large is large enough? Both theory and observations can provide constraints.
A number of theoretical studies have addressed this question recently.
Given a model for structure formation, and therefore a predicted power
spectrum for density fluctuations, local measurements of H0
can be compared with the global value of H0
(Turner, Cen
& Ostriker 1992;
Shi & Turner
1997;
Wang, Spergel
& Turner 1998).
Many variations of
cold dark matter (CDM) models have been investigated, and issues of
both the required volume and sample size for the distance indicator
have been addressed. The most recent models predict that variations
at the level of 1-2% in <
( H/H0)2
> 1/2) are to be
expected for the current (small) samples of Type Ia supernovae which
probe out to 40,000 km/sec, whereas for methods that extend only to
10,000 km/sec, for small samples, the cosmic variation is predicted to
be 2-4%.
H/H0)2
> 1/2) are to be
expected for the current (small) samples of Type Ia supernovae which
probe out to 40,000 km/sec, whereas for methods that extend only to
10,000 km/sec, for small samples, the cosmic variation is predicted to
be 2-4%.
There are also observational constraints that can test the possibility
that we live in an underdense region locally. These include the
observational determinations that the expansion is linear on 100 to
1000 Mpc scales, and measurements of temperature fluctuations in the
cosmic microwave background. The linearity of the Hubble diagram has
been established by many means, including work by
Sandage &
Hardy (1973) and
Lauer &
Postman (1992)
on brightest cluster galaxies,
recent studies of supernovae at velocity-distances out to 30,000
km/sec
(Zehavi et al
1998),
and extension of the Tully Fisher relation to 15,000 km/sec
(Giovanelli et
al. 1999;
Dale et al. 1999).
These results limit the difference between the global and local values of
the Hubble constant to a few percent. For example, Giovanelli et al.
provide limits to the amplitude of a possible distortion in the Hubble
flow within 70 h-1 Mpc of
H / H = 0.010 ± 0.022. The
rarity of low density bubbles is also attested by the microwave dipole
anisotropy on degree scales.
Wang et
al. (1998)
find a robust upper
limit on the global deviation from the local 104 km/sec sphere of
10.5% in H0 with 95% confidence.
A stronger constraint will come from galaxy counts in redshift shells.
If the local density were deficient within 150 Mpc by
n / n =
 /
/
 -0.2, the effect on
H0 would be
-0.2, the effect on
H0 would be
|
For example, for  m = 0.2, this is consistent with 1.0 >
H(global) / H(local)
m = 0.2, this is consistent with 1.0 >
H(global) / H(local)
 0.97. These results
limit the difference
between the global and local values of the Hubble constant to a few
percent. This is consistent with the results cited above. (For
comparison, with m
= 1, it is consistent with 1.0 > H(global) / H(local)
0.93).
0.97. These results
limit the difference
between the global and local values of the Hubble constant to a few
percent. This is consistent with the results cited above. (For
comparison, with m
= 1, it is consistent with 1.0 > H(global) / H(local)
0.93).
There are two sources of data on
n / n. The slope of galaxy
counts versus magnitude is a relatively weak constraint, as excellent
knowledge of the luminosity function of galaxies is required in order
to infer a density. Redshift survey data is superior; however,
selection effects must be well-understood before
n / n can be
determined. Improved constraints will soon be forthcoming from the
2dF, Sloan, 2MASS, and 6dF surveys.
The overall conclusion derived from these studies is that uncertainties due to inhomogeneities in the galaxy distribution likely affect determinations of H0 only at the few percent level. This must be reflected in the total uncertainty in H0; however, the current distance indicators are now being applied to sufficiently large depths, and in many independent directions, that large errors due to this source of uncertainty are statistically unlikely. These constraints will tighten in the near future as larger numbers of supernovae are discovered, when all-sky measurements of the CMB anisotropies are made at smaller angular scales, and when deeper redshift surveys have been completed.
8.7. Overall Assessment of Systematic Uncertainties
We now briefly summarize the sources of systematic error discussed in the previous section. The standard error of the mean for the zero point of the LMC PL relation is ±0.06 mag, and is currently set by an average over several independent methods. Conservatively, we adopt a value of ±0.1 mag, corresponding to ±5% in the uncertainty for the distance to the LMC. Systematic errors in the reddening determinations are small, amounting to less than 1%. Both observational and theoretical studies of Cepheids suggest that there is a small metallicity dependence of the PL relation. Cepheid galaxies have a range of metallicities that are in the mean, a few tenths of a dex greater that of the LMC. Adopting a metallicity correction results in values of H0 that are lower in the mean by 4%. We take this difference between corrected and uncorrected distances to be indicative of the uncertainty due to metallicity. Cepheid distances can be affected by incompleteness biases at the few percent level, but these are minimized by adopting a conservative choice for the lower period limit, and by the fact that the dispersion in the reddening-corrected PL relation is only ±0.08 mag. Ultimately this sample bias effect contributes less than ±1% uncertainty to the final results. Based on artificial star experiments, crowding effects on the final distances also contribute at a 1-2% level. Allowing for unresolved blending effects, we adopt an overall uncertainty of +5, 0%. Finally, based on a number of both empirical and theoretical studies, bulk motions on very large scales are likely to contribute less than ±5%.
Correcting for the effects of bias and metallicity decrease H0 by 1% and 4%, respectively, whereas the effect of the new WFPC2 zero point is to increase H0 by 3.5%. The effect of adopting the new Udalski et al. (1999) PL slopes differs from galaxy to galaxy (and therefore differs in the magnitude of the effect on the zero point for each secondary method). Adopting the new slopes results in a mean decrease in distance from the Madore and Freedman calibration (1991) of 7% for the galaxies listed in Table 3, but each individual method is impacted slightly differently depending on what subset of calibrators is applicable to that method. The sign of the uncertainty due to a possible bulk flow component to the velocity field is, of course, unknown. In this paper, we have not applied a correction for crowding, but incorporate this uncertainty into the final error budget. These corrections individually amount to a few percent, but with differing signs so that the overall impact on the mean value of the Hubble constant agree at the 1% level with those in Mould et al. (2000a) and Freedman (2000b).
We list the major identified systematic uncertainties in Table 14; these can be combined in quadrature to yield an overall systematic uncertainty of ±10% (or 7 km s-1 Mpc-1.) Our current H0 value incorporates four refinements discussed in detail above: (a) adopting the slopes of the PL relations as given by Udalski et al. (1999), (b) using the WFPC2 photometric zero-point calibration of Stetson (1998), (c) applying a metallicity correction of -0.2 ± 0.2 mag/dex, and (d) correcting for bias in the PL relation. Applying the resulting Cepheid calibration to 5 secondary methods gives H0 = 72± 3r ± 7s km s-1 Mpc-1.
|
20 In two recent Key Project papers,
we adopted a
distance modulus uncertainty to the LMC of ± 0.13 mag
(Mould et
al. 2000a,
and Freedman
2000b).
This value defined the 1-
dispersion based on a histogram of the distance moduli compiled by
Gibson (2000).
However, the standard error of the mean is the
relevant statistic in this case.
Back.