


3.1. X-ray Measurements of AGN Evolution and the Growth of Supermassive Black Holes
Optical studies of AGN evolution have historically focused on luminous
quasars (e.g.,
Hewett & Foltz 1994;
Osmer 2004).
These have been known to evolve positively with redshift since
 1968
(Schmidt 1968),
having a comoving space density at z
2 that is
1968
(Schmidt 1968),
having a comoving space density at z
2 that is
 100 times higher
than at z
0. Pure luminosity evolution (PLE) models provide acceptable fits
to large optically selected samples such as
16, 800 luminous AGN
from a combination of the recent 2dF and 6dF surveys out to z = 2.1
(Croom et al. 2004).
At z 2.7,
the space density of luminous quasars
selected in wide-field optical multicolor and emission-line surveys shows
a strong decline with redshift (e.g.,
Schmidt, Schneider &
Gunn 1995;
Fan et al. 2001).
Deep optical AGN surveys, such as COMBO-17,
have recently discovered significant numbers of moderate-luminosity AGN
(with MB > - 23) at
z 1-4
(Wolf et al. 2003).
Like luminous quasars, the moderate-luminosity AGN
found in these surveys also appear to peak in comoving space density
around z
2. Although a careful merging of the COMBO-17 data
with a large sample of higher luminosity AGN has yet to be published, there
are hints that the comoving space density of moderate-luminosity AGN
peaks at smaller redshift (L. Wisotzki, pers. comm.).
100 times higher
than at z
0. Pure luminosity evolution (PLE) models provide acceptable fits
to large optically selected samples such as
16, 800 luminous AGN
from a combination of the recent 2dF and 6dF surveys out to z = 2.1
(Croom et al. 2004).
At z 2.7,
the space density of luminous quasars
selected in wide-field optical multicolor and emission-line surveys shows
a strong decline with redshift (e.g.,
Schmidt, Schneider &
Gunn 1995;
Fan et al. 2001).
Deep optical AGN surveys, such as COMBO-17,
have recently discovered significant numbers of moderate-luminosity AGN
(with MB > - 23) at
z 1-4
(Wolf et al. 2003).
Like luminous quasars, the moderate-luminosity AGN
found in these surveys also appear to peak in comoving space density
around z
2. Although a careful merging of the COMBO-17 data
with a large sample of higher luminosity AGN has yet to be published, there
are hints that the comoving space density of moderate-luminosity AGN
peaks at smaller redshift (L. Wisotzki, pers. comm.).
As described in Sections 1.3 and
2.3,
deep X-ray surveys efficiently select
AGN significantly less luminous than those found in optical surveys out to
high redshift. Deep plus wide X-ray surveys can therefore cover an
extremely broad range of luminosity. Contrary to the PLE model for
optically selected luminous quasars, the moderate-luminosity
AGN selected in the 0.5-2 keV and 2-10 keV bands require
luminosity-dependent density evolution (LDDE; e.g.,
Miyaji, Hasinger &
Schmidt 2000;
Cowie et al. 2003;
Fiore et al. 2003;
Steffen et al. 2003;
Ueda et al. 2003;
Hasinger, Miyaji &
Schmidt 2005).
Figure 7 shows the X-ray luminosity function
based on 950 AGN
selected in the 0.5-2 keV band from deep Chandra and
XMM-Newton surveys as well as deep plus wide ROSAT surveys
(Hasinger, Miyaji &
Schmidt 2005).
Strong positive evolution from
z 0-2 is
only seen at high luminosities; lower luminosity AGN
evolve more mildly. The evolutionary behavior measured
in the 2-10 keV band is similar. These results are robust to incompleteness
of the spectroscopic follow up, although clearly they are still dependent
upon the completeness of AGN X-ray selection (see
Section 2.4).
At a basic level, LDDE is not unexpected as simple PLE and pure density
evolution (PDE) models have physical difficulties (see, e.g.,
Weedman 1986 and
Peterson 1997).
Simple PLE models tend to overpredict the number of
1010
M black holes
in the local universe,
while simple PDE models tend to overpredict the local space density
of quasars and the CXRB intensity.
black holes
in the local universe,
while simple PDE models tend to overpredict the local space density
of quasars and the CXRB intensity.
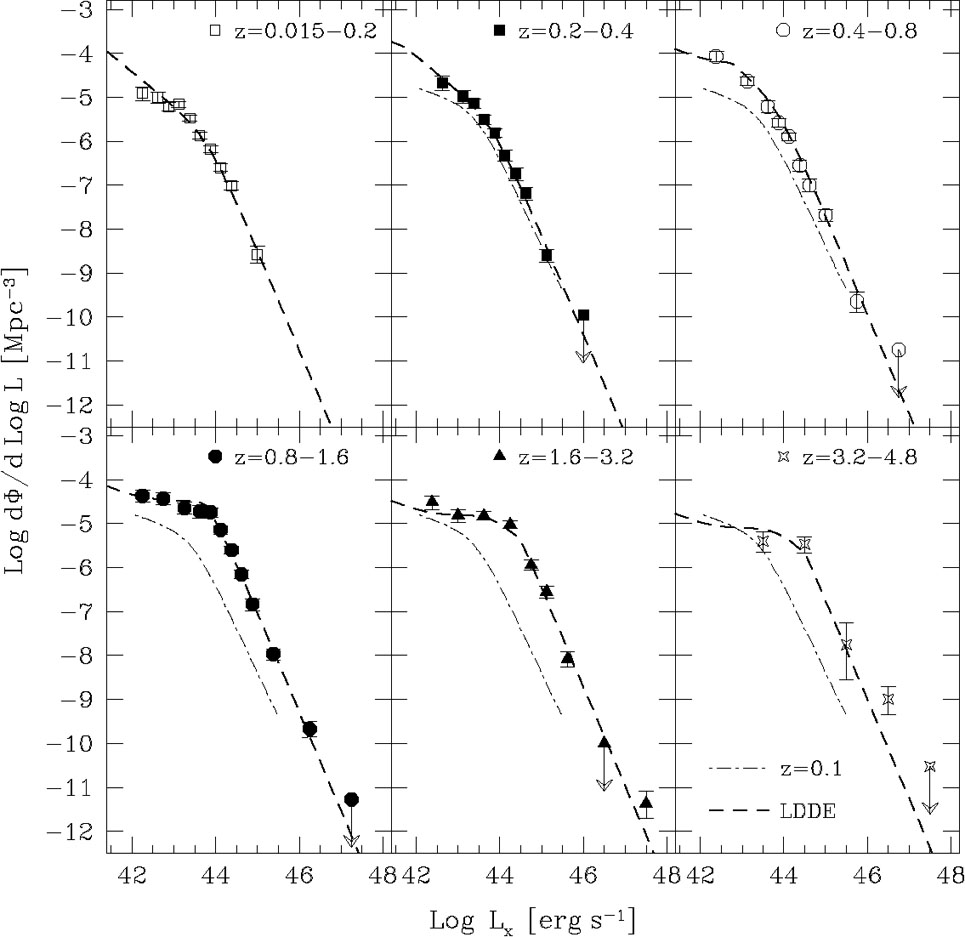 |
Figure 7. The 0.5-2 keV luminosity function for type 1 AGN in six redshift shells. The dashed curves show the best LDDE fit to the data. For ease of comparison, the dot-dashed curves in each panel show the best-fit model for the z = 0.015-0.2 redshift shell. Adapted from Hasinger, Miyaji & Schmidt (2005). |
Figure 8 shows estimates of the comoving space
density of AGN in different X-ray luminosity ranges as a function of
redshift. Figure 8a has been constructed for the
0.5-2 keV band using the
Hasinger, Miyaji &
Schmidt (2005)
sample. Figure 8b is for the 2-10 keV band,
utilizing a combination of Chandra, ASCA, and 1 surveys
with 247 AGN in total
(Ueda et al. 2003).
These plots illustrate that (1) the AGN peak space density moves to smaller
redshift with decreasing luminosity, and (2) the rate of evolution from the
local universe to the peak redshift is slower for less-luminous AGN.
It appears that SMBH generally grow in an "anti-hierarchical" fashion:
while the 107.5 - 109
M SMBH
in rare, luminous AGN could grow efficiently at
z 1-3, the
106 - 107.5
M SMBH in
more-common, less-luminous AGN had to wait longer to grow (z
 1.5).
In the 0.5-2 keV band the sensitivity and statistics are good
enough to detect a clear decline of the AGN space density toward higher
redshifts (also see
Silverman et al. 2004);
such a high-redshift decline is also hinted at in some 2-10 keV band
analyses
(Fiore et al. 2003;
Steffen et al. 2003).
1.5).
In the 0.5-2 keV band the sensitivity and statistics are good
enough to detect a clear decline of the AGN space density toward higher
redshifts (also see
Silverman et al. 2004);
such a high-redshift decline is also hinted at in some 2-10 keV band
analyses
(Fiore et al. 2003;
Steffen et al. 2003).
 |
Figure 8. (a) The comoving space density of AGN selected in the 0.5-2 keV band as a function of redshift. Results are shown for five luminosity ranges; these are labeled with logarithmic luminosity values. Adapted from Hasinger, Miyaji & Schmidt (2005). (b) The same for AGN selected in the 2-10 keV band using three luminosity ranges. Adapted from Ueda et al. (2003). |
The AGN luminosity function can be used to predict the masses of remnant
SMBH in galactic centers. This is done using the ingenious
Soltan (1982)
continuity argument, adopting an AGN mass-to-energy conversion
efficiency and bolometric correction factor.
The local mass density of SMBH in dormant quasar
remnants originally predicted by
Soltan (1982) was

 > 0.47
 0.1-1 × 10⁵
M
Mpc-3, where
0.1 is
the mass-to-energy conversion efficiency of
the accretion process divided by 0.1. For a Schwarzschild black hole,
is expected to be
0.054 or larger, depending upon the accretion-disk torque at the
marginally stable orbit around the black hole (e.g.,
Agol & Krolik 2000).
For a rapidly rotating Kerr black hole,
can be as high as
0.36. More recent
determinations of from optical quasar luminosity functions are around
2 0.1-1 × 10⁵
M
Mpc-3 (e.g.,
Chokshi & Turner 1992;
Yu & Tremaine 2002).
Estimates from the CXRB spectrum, including obscured accretion power,
originally obtained even larger values: 6-9
(Fabian & Iwasawa
1999) or 8-17
(Elvis, Risaliti &
Zamorani 2002)
in the above units. However, these were derived assuming that the
evolution of moderate-luminosity AGN is the same as that of quasars
(i.e., that moderate-luminosity peak in number density at
z 2),
and they need to be revised downward by a factor of
3 in
light of the currently observed evolution of CXRB sources
(Fabian 2004).
Values derived from the infrared band
(Haehnelt & Kauffmann
2001)
or multiwavelength observations
(Barger et al. 2001b)
are high (8-9 in the above units). Arguably the
most reliable determination comes from an integration of the
Ueda et al. (2003)
hard X-ray luminosity function
including a revised bolometric correction (which ignores infrared emission
to avoid the double counting of luminosity) and a plausible
correction for missed Compton-thick AGN:
3.5
0.1-1 × 10⁵
M
Mpc-3
(Marconi et al. 2004).
0.1-1 × 10⁵
M
Mpc-3, where
0.1 is
the mass-to-energy conversion efficiency of
the accretion process divided by 0.1. For a Schwarzschild black hole,
is expected to be
0.054 or larger, depending upon the accretion-disk torque at the
marginally stable orbit around the black hole (e.g.,
Agol & Krolik 2000).
For a rapidly rotating Kerr black hole,
can be as high as
0.36. More recent
determinations of from optical quasar luminosity functions are around
2 0.1-1 × 10⁵
M
Mpc-3 (e.g.,
Chokshi & Turner 1992;
Yu & Tremaine 2002).
Estimates from the CXRB spectrum, including obscured accretion power,
originally obtained even larger values: 6-9
(Fabian & Iwasawa
1999) or 8-17
(Elvis, Risaliti &
Zamorani 2002)
in the above units. However, these were derived assuming that the
evolution of moderate-luminosity AGN is the same as that of quasars
(i.e., that moderate-luminosity peak in number density at
z 2),
and they need to be revised downward by a factor of
3 in
light of the currently observed evolution of CXRB sources
(Fabian 2004).
Values derived from the infrared band
(Haehnelt & Kauffmann
2001)
or multiwavelength observations
(Barger et al. 2001b)
are high (8-9 in the above units). Arguably the
most reliable determination comes from an integration of the
Ueda et al. (2003)
hard X-ray luminosity function
including a revised bolometric correction (which ignores infrared emission
to avoid the double counting of luminosity) and a plausible
correction for missed Compton-thick AGN:
3.5
0.1-1 × 10⁵
M
Mpc-3
(Marconi et al. 2004).
The SMBH masses measured in local galaxies are correlated with the
velocity dispersions and luminosities of their host bulges (e.g.,
Kormendy & Gebhardt
2001
and references therein). Using these
correlations with velocity dispersion functions or luminosity functions for
local galaxies, the total SMBH density in galactic bulges can be estimated.
Scaled to the same assumption for the Hubble constant (see
Section 1),
several recent papers arrive at different values of
, mainly
depending on assumptions about the SMBH-galaxy correlations. For example,
Yu & Tremaine (2002)
derive (2.9 ± 0.5) × 105
M
Mpc-3 while
Marconi et al. (2004)
derive (4.6-1.4+1.9) × 105
M
Mpc-3.
These values are plausibly consistent with the current best estimates
of accreted mass density for
0.1.
Marconi et al. (2004) and
Shankar et al. (2004)
also demonstrate that the observed accretion can plausibly explain the
measured distribution function of local SMBH masses.