


13.3.6. Source Dynamics and Superluminal Motion
Not unexpectedly, the compact variable radio sources show changes in their angular structure on time scales corresponding to the intensity variations: The observed motions can usually be described as an increase in separation between the core and one or more components which make up the jetlike feature. Of those sources which have been studied in any detail over a period of time, well over half show an apparent velocity of separation which appears to be five to ten times the speed of light (e.g., Cohen and Unwin 1984). This phenomenon is usually referred to as superluminal motion. In fact, there are very few sources where it has been clearly established that the transverse velocity is less than the speed of light. For one of these, the nucleus of NGC 1275 (3C84), there is a well-established subluminal motion with an apparent transverse velocity of about half the speed of light (Romney et al. 1984). NGC 1275 shows the same core jet morphology seen in the superluminal sources. One of the most intensively observed superluminal sources is 3C273, shown in Figure 13.7.
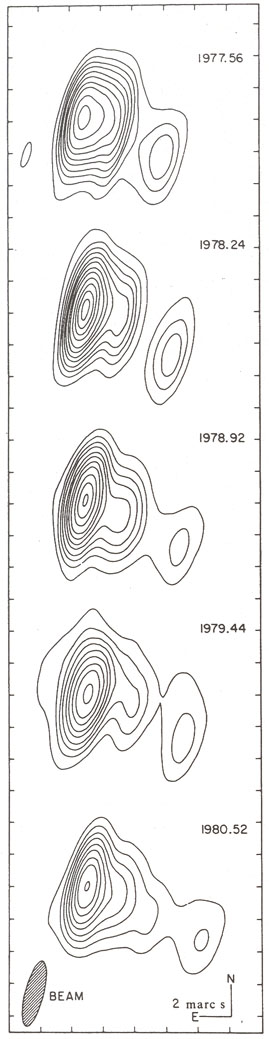 |
Figure 13.7. Changes in the structure of the quasar 3C273 observed between 1977 and 1981 (Pearson et al. 1981. Reprinted by permission from Nature, Vol. 290, No. 5805, pp. 365. Copyright(c) 1981, Macmillan Magazines Ltd.) |
For some years there was considerable debate about whether to take the observations of superluminal motion seriously. Today the situation is very much improved. Multielement interferometer systems are used together with sophisticated image-restoring algorithms, and there is now little doubt about the reality of superluminal motion. The observed properties of the superluminal sources may be summarized as follows (e.g., Cohen and Unwin 1984, Kellermann 1985):
Superluminal motion is observed primarily in asymmetric sources with extended jet features and a strong core. Most are identified with bright quasars, but a few with relatively nearby AGNs.
Only increases in overall separations are observed, never decreases. However, in several sources there are both stationary and moving components, and in these sources, the separation of some component pairs may decrease.
Typical transverse velocities are of the order of 4c to 10c (e.g., Figure 13.7).
Component separations are typically in the range of 10 to 50 pc.
The cores superluminal sources show "flat" or inverted radio spectra and variable flux densities. Since the core features are more opaque than the moving components, they have flatter or more inverted spectra and are more prominent at shorter wavelengths.
Close to the core, the structure is often curved through an angle of several tens of degrees or more.
In many cases, large-scale jets also extend hundreds of kiloparsecs from the core and are continuous with the much smaller superluminal features. These large-scale jets always lie on the same side of the core as the superluminal features.
Different components in the same source may show different velocities. The individual components fade with time and their spectra steepen as they move away from the core.
In general, each component moves with a constant velocity, although there is evidence in the quasar 3C345 that one component has accelerated.
The motion is generally radial, except possibly in 3C345 where either the origin is displaced from the core or the direction of motion has changed.
Extrapolation back to the time of zero component separation often coincides with the beginning of a flux density outburst.
The observations of course give only the angular separation and its rate of
change. The linear velocity is calculated from
v = R(d
 / dt)(1 +
z) where R is the
"angular size" distance and the factor (1 + z) corrects for the
relativistic time dilation due to the cosmological redshift. It has been
argued that if the quasars are much closer than indicated by their
redshift, then of course the linear velocities may
be less than c. Moreover, the apparent inverse Compton catastrophe
implied by the rapid flux density variations is then no longer a
problem. However, this argument
does not effect the discrepancy between the observed inverse Compton
flux and the distance-independent value predicted from Equation (13.20)
and the measured brightness temperature (e.g.,
Marscher 1983).
/ dt)(1 +
z) where R is the
"angular size" distance and the factor (1 + z) corrects for the
relativistic time dilation due to the cosmological redshift. It has been
argued that if the quasars are much closer than indicated by their
redshift, then of course the linear velocities may
be less than c. Moreover, the apparent inverse Compton catastrophe
implied by the rapid flux density variations is then no longer a
problem. However, this argument
does not effect the discrepancy between the observed inverse Compton
flux and the distance-independent value predicted from Equation (13.20)
and the measured brightness temperature (e.g.,
Marscher 1983).
At least one superluminal source, the AGN 3C120, is found in a relatively low redshift galaxy (z = 0.03). Several others are identified with quasars associated with nebulosities which have measured redshifts; thus, interpretations based on noncosmological redshifts appear unsatisfactory unless noncosmological redshifts are accepted for galaxies as well as quasars.
Many models have been considered to explain superluminal motion including:
Appropriately phased intensity variations in fixed components-the so-called "Christmas Tree" or "Movie Marquee" model.
Noncosmological redshifts.
Gravitational lenses or screens.
Variations in synchrotron opacity.
Synchrotron curvature radiation in a dipole magnetic field.
Light echoes.
Real tachyonic motion.
Geometric effects of relativistically moving sources.
Bulk relativistic motion along the line of sight.
For one reason or another, all but the last of these have been shown to be unsatisfactory (e.g., Marscher and Scott 1980) and most of the discussion in the literature centers around models based on bulk relativistic motion.