

We are living in an era in which we are able to see the light of galaxies at or close to redshift 10. Many galaxies above a redshift of 3 are already known, and we are starting to discover their clustering properties. These galaxies must undergo an evolution which leads to the galaxies we see around us, of which we have catalogues containing millions of individuals. Understanding how this evolution has taken place is a major task that the current generation of astronomers will have to address. A major tool needed to study galaxy evolution is stellar population synthesis. At high redshift galaxy are not more than point sources of which we can measure the flux in one or more bands, or a spectrum, if we are lucky. The information contained in such a spectrum can, however, be very powerful. It can tell us how old the stars are that emit the light that we see, and give us some clues about their internal composition. This information, together with spatial information about the distribution of galaxies, and information about the gas content of these objects, is crucial input for large galaxy formation simulations, which try to simulate the formation and evolution of galaxies in the Universe.
To interpret the fluxes and spectra of high redshift galaxies, we need models that tell us how stellar populations evolve as a function of time. With them, we can then use the fact that astronomers can look back in time, to determine a 3D movie of the evolution of galaxies in the Universe. Even some predictions can be made about the future. Such models are best made using the detailed information around us, from the Sun, which shows us in detail how one particular star evolves, to other stars, to galaxies in the Local Group, which we can resolve into individual stars, to galaxies in the local Supercluster, for which we can obtain important spatial information. Stellar population models have been built on knowledge from many different fields, and are continuously improving in quality, as our understanding of many physical processes improves, the capacity of our computers increases, and our instruments and telescopes become larger and better.
Research on stellar populations is relatively old. In the beginning of the 20th century the Hertzsprung-Russell diagram was discovered, i.e., the relation between the color and luminosity of stars. The HR diagram showed that stars evolve in an ordered way. Shapley (1918) could show from Cepheids that globular clusters are large systems of stars at several kpc from us centered around a point which later became known as the center of our Galaxy. Soon afterwards, it was found that nebulae such as M31 were even larger systems than globular clusters (galaxies) much further away. It was realized by Baade (1944) that some regions of M31 were similar to our Galactic disk as far as the kind of stars present were concerned, and that the bulge of M31 looked like our Galactic halo. As a result, one realized that the variation of properties along Hubble's galaxy classification sequence was strongly connected with star formation in galaxies. Early works studying galaxy colors to derive information about their stellar contents were by Stebbins, Whitford, Holmberg, Humason, Mayall, Sandage, Morgan, and de Vaucouleurs (see Whitford 1975 for a summary of the early work in this field). A nice review about the known galaxy properties is given by Roberts (1963). Roberts' analysis established the basic elements of our current picture of the Hubble sequence as a monotonic sequence in present-day SFRs and past star formation histories.
To go further than recognizing differences between galaxies, and to be
able to give quantitative predictions for stellar populations in
galaxies that can be tested with real data, a paradigm of evolutionary
stellar population models was developed by
Tinsley (1968,
1980,
etc.). In
Kennicutt (1999)
the importance of Tinsley's stellar
population work has been summarized. She developed a methodology for
constructing evolutionary synthesis models for colors, gas contents and
chemical abundances with time, heavily influenced by the ideas about
galaxy formation published in 1963 by
Eggen, Lynden-Bell &
Sandage (1962).
This evolutionary synthesis paradigm, which is still
being used by our current, most sophisticated models, needs input from
stellar evolution calculations, nucleosynthesis models, and cosmological
models, and is made to fit the observed colors and magnitudes of stars
and galaxies, as well as their line strengths. An important result of
her models was that she was able to describe the evolution of colors and
magnitudes along the Hubble Sequence as a function of one parameter,
which could be M/L ratio, gas fraction or age. A second result was that
the luminosity evolution of passive galaxies was much larger than had
been estimated earlier. Before her work it was claimed that one could
constrain q0 and  from the evolution of magnitudes and colors.
However, nowadays one knows that the evolution due to aging and other
population effects is so large compared to effects of cosmological
signatures that this method is not very useful. Because she was able to
indicate the importance of stellar population research, Tinsley became
the focal point of galaxy evolution research and a role model for
younger scientists. The conclusion from her work was that galaxy
evolution was an observable phenomenon (see
Kennicutt 1999).
from the evolution of magnitudes and colors.
However, nowadays one knows that the evolution due to aging and other
population effects is so large compared to effects of cosmological
signatures that this method is not very useful. Because she was able to
indicate the importance of stellar population research, Tinsley became
the focal point of galaxy evolution research and a role model for
younger scientists. The conclusion from her work was that galaxy
evolution was an observable phenomenon (see
Kennicutt 1999).
Tinsley's ideas were incorporated into the models of Faber (1972), and of Searle, Sargent & Bagnulo (1973), who also added a parameterization for the Star Formation History. For a number of years people seriously tried to compete with there evolutionary models using empirical models that did not need any input from theory (e.g. O'Connell 1980, Bica 1988), but these efforts have died out, since it is hard to learn much about the evolution of stellar populations in this way.
Since the time of Tinsley, our observing capacity has improved enormously. We have CCDs, linear devices that make it possible to record accurately images and spectra of galaxies. Telescopes have increased in size, but, more importantly, the Hubble Space Telescopes has caused a revolution in the field of stellar populations. The high spatial resolution, the long integrations, and the changing paradigm to work with sometime very large, surveys, has made it possible to obtain high S/N data of very far away galaxies, and at the same time very high quality, detailed images of nearby objects. Such images become even more powerful in the presence of the large SDSS survey, which makes it possible to carefully select galaxies for detailed studies using HST. Also very important, compared to Tinsley's time, is that we have started to explore most of the electromagnetic spectrum, and also non-baryonic matter. Knowing about the huge presence of dark matter completely changes our idea about the expansion of the Universe and the interactions between galaxies, and is therefore crucial to understand galaxy evolution.
Fig. 1.1, from Brinchmann (2010) indicates some very basic problems in our field, which will hopefully be solved in the coming decades. On the left the morphology-density relation by Dressler (1980). Understanding why in clusters in the local Universe the fraction of early-type galaxies, both dwarfs and giants, is so much larger than in the field, is a fundamental question, which needs full attention of our community. Then in the middle the mass metallicity relation. This relation is one of the most fundamental relations in the field of galaxy formation and evolution. The solution depends on how a galaxy is formed from the primordial gas, on feedback at all times, on interaction with its environment, and on many other things. And on the left the dichotomy in the mass - D4000 relation, which loosely can be called the mass - age relation. It is clear that smaller galaxies form their stars later. Why is this, and why is there a distinct break?
 |
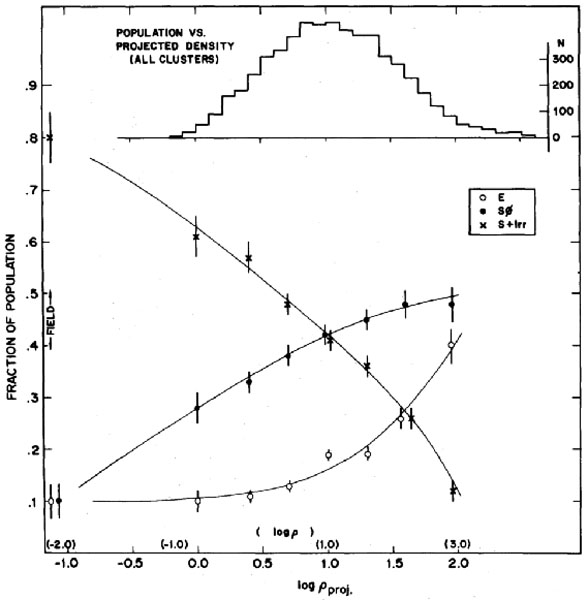 |
Figure 1.1. On the top left is shown the mass-metallicity relation for SDSS DR6 (Tremonti et al. 2004). Top right: The relation between stellar mass and the 4000Å break in the SDSS DR7 (Kauffmann et al. (2003)). These figures have been reproduced from Brinchmann (2010). Bottom panel: On the left the Morphology-Density relation (Dressler 1980), showing the strong relation between the galaxy density and the fraction of early-type galaxies. |
The contents of this review will be the following. I will start with a quick look at galaxy images, so that the reader can get a feeling of the different stellar populations (Section 1.2). After that I will discuss various aspects of Stellar Population Models (Section 1.3), such as stellar evolution theory, stellar libraries, the Initial Mass Function and abundance ratios. In the next Section (1.4) I will discuss stellar population analysis of individual galaxies, using colors and spectra, in the optical and elsewhere. I will discuss obtaining star formation histories, and end this section with a few words on surface brightness fluctuations. Following this, in Section 1.5 I will discuss stellar population analysis using scaling relations with ensembles of galaxies. In Section 1.6 radial gradients in the galaxies will be discussed. I will end with some prospects for the future.