Copyright © 2013 by Annual Reviews. All rights reserved
| Annu. Rev. Astron. Astrophys. 2013. 51:
207-268 Copyright © 2013 by Annual Reviews. All rights reserved |


The distance of even the nearest galaxies renders CO the primary tracer of molecular gas outside the Milky Way, a situation that will improve but not reverse with ALMA. Other galaxies therefore represent the key application of XCO. They also offer a wider range of environments than the Milky Way and a simpler mapping between local ISM conditions, especially metallicity, and line of sight. As a result, for more than two decades observations of the nearest galaxies have been used to test and extend calibrations of XCO as a function of metallicity and other local ISM properties. Here we review the techniques available to derive XCO in "normal" galaxies, meaning star-forming dwarf, spiral, or elliptical galaxies. We discuss specific efforts to understand the behavior of XCO as a function of metallicity in Section 6 and the special case of overwhelmingly molecular starburst galaxies, such as the local luminous and ultraluminous infrared galaxies, in Section 7. Section 8 considers XCO in galaxies at high redshift.
Only a subset of the techniques used to determine XCO in the Milky Way can be applied to other galaxies. In each case, the limited sensitivity and resolution of millimeter, submillimeter, and infrared facilities complicate the calculation. Direct estimates rely almost exclusively on the use of virial mass measurements (Section 4.1), dust emission employed as an optically thin tracer of the total gas reservoir (Section 4.2), or modeling of multiple CO lines. Ideally such modeling includes optically thin isotopologues, but studies of high redshift systems must often make due with a few, or only one, 12CO line ratios (Section 8).
5.1. Extragalactic Virial Mass Estimates
Since the late 1980s, millimeter telescopes have been able to resolve CO emission from nearby galaxies into discrete molecular clouds. From such observations, one can estimate the line width, size, and luminosity of these objects and proceed as in Section 4.1 (see the recent review by Fukui & Kawamura 2010).
Resolution and sensitivity have limited virial mass measurements to the nearest galaxies, those in the Local Group and its immediate environs. The Magellanic Clouds (d ~ 50 kpc) are close enough that single dish telescopes resolve individual clouds (e.g., Rubio, Lequeux & Boulanger 1993, Israel et al. 2003, Mizuno et al. 2001, Fukui et al. 2008, Hughes et al. 2010, Wong et al. 2011). Millimeter-wave interferometers resolve populations of GMCs in other Local Group galaxies — M 31, M 33, NGC 6822, and IC 10 (d ~ 1 Mpc, e.g., Vogel, Boulanger & Ball 1987, Wilson & Scoville 1990, Wilson 1995, Rosolowsky et al. 2003, Leroy et al. 2006, Blitz et al. 2007, Fukui & Kawamura 2010).
Early measurements beyond the Local Group focused on very nearby dwarf galaxies (d ~ 3 Mpc, Taylor et al. 1999, Walter et al. 2001, Walter et al. 2002, Bolatto et al. 2008) or considered structures more massive than GMCs in more distant galaxies (Giant Molecular Associations, or GMAs, e.g., Vogel, Kulkarni & Scoville 1988, Rand & Kulkarni 1990). The nearest spiral galaxies tend to be more distant (d ~ 6 Mpc), so that ~ 1 resolution is required to resolve massive GMCs. Only recently mm-wave interferometers have begun to achieve this resolution with the requisite sensitivity, by investing large amounts of time into dedicated observations of bright regions of the nearest massive spiral galaxies (Donovan Meyer et al. 2012, Donovan Meyer et al. 2013, Rebolledo et al. 2012). This has allowed the first cloud-scale virial mass measurements of populations of clouds in spiral galaxies beyond the Local Group.
5.1.1. XCO From Extragalactic Virial Mass Analyses
Broadly, virial mass measurements across a wide range of environments
yield XCO,20
 1-4, consistent with
Milky Way results and very similar to XCO derived from
dust-based techniques applied to high mass nearby galaxies.
Bolatto et
al. (2008)
find XCO,20
3.5-1.2+1.8 in 12 nearby systems. In the highest
resolution studies of the Large Magellanic Cloud (LMC) to date,
Israel et
al. (2003),
Hughes et
al. (2010),
Wong et al. (2011),
and
Pineda et
al. (2010)
all find XCO,20
4. Considering
NGC 6946, one of the nearest molecule-rich spiral
galaxies,
Donovan
Meyer et al. (2012)
report XCO,20
1.2 and
Rebolledo et
al. (2012)
find XCO,20 ~ 2. In M 33,
Rosolowsky et
al. (2003)
show XCO,20 ~ 2 independent of radius and
metallicity. In M 31,
Rosolowsky
(2007)
calculate XCO,20
4 assuming virial equilibrium.
1-4, consistent with
Milky Way results and very similar to XCO derived from
dust-based techniques applied to high mass nearby galaxies.
Bolatto et
al. (2008)
find XCO,20
3.5-1.2+1.8 in 12 nearby systems. In the highest
resolution studies of the Large Magellanic Cloud (LMC) to date,
Israel et
al. (2003),
Hughes et
al. (2010),
Wong et al. (2011),
and
Pineda et
al. (2010)
all find XCO,20
4. Considering
NGC 6946, one of the nearest molecule-rich spiral
galaxies,
Donovan
Meyer et al. (2012)
report XCO,20
1.2 and
Rebolledo et
al. (2012)
find XCO,20 ~ 2. In M 33,
Rosolowsky et
al. (2003)
show XCO,20 ~ 2 independent of radius and
metallicity. In M 31,
Rosolowsky
(2007)
calculate XCO,20
4 assuming virial equilibrium.
Figure 6 shows the relationship between virial mass and CO luminosity for a subset of these measurements. A good correlation extends across three orders magnitude in luminosity and roughly a dozen systems. As in the Milky way, there may be evidence for a slightly sub-linear slope (see Section 2.1 and Section 4.1 and Figure 2), though this may also reflect methodological or environmental differences among the galaxies studied. Across the ensemble of points we plot the median XCO,20 = 2.9 with 0.4 dex scatter (slightly larger than a factor of 2).
 |
Figure 6. Relation between virial mass
(y-axis) and CO luminosity
(x-axis) for extragalactic GMCs. We show virial masses measured from
selected high spatial resolution CO observations of nearby galaxies:
the compilation of
Bolatto et
al. (2008),
including M 31, M 33, and nine dwarf
galaxies), high resolution studies of the LMC by
Pineda et
al. (2009)
and
Wong et
al. (2011),
and high resolution studies of the nearby spiral NGC 6946 by
Donovan
Meyer et al. (2012)
and
Rebolledo et
al. (2012),
as well as NGC 4826 and NGC 4736 by
Donovan
Meyer et al. (2013).
Dashed lines show fixed XCO, with the
typical Milky Way value XCO,20 = 2 and ± 30%
indicated by the gray region. Virial mass correlates with luminosity,
albeit with large scatter, across more than three orders of magnitude
in extragalactic systems. The median across all displayed data is
XCO,20 = 2.8 with 0.4 dex scatter and the best fit
relation has a power law index 0.90 ± 0.05, reflecting that most
Local Group clouds show XCO,20 ~ 4
while both studies of the bright spiral NGC 6946 find a lower
XCO,20
|
Surprisingly at first, these "Galactic" XCO values
obtained from
virial masses extend to low metallicity, irregular galaxies. In the
low metallicity Small Magellanic Cloud (SMC, with 12 + log[O/H]
8.0,
Dufour, Shields
& Talbot 1982),
Bolatto et
al. (2003)
and
Israel et
al. (2003)
find XCO,20
4,
consistent with the Milky Way value.
Rosolowsky et
al. (2003)
find no dependence of XCO on metallicity in M 33.
Leroy et
al. (2006)
find an approximately Galactic XCO in the Local Group
dwarf IC 10 ([12 + log[O/H]
8.17,
Lequeux et
al. 1979).
Wilson (1994)
found XCO,20
 6.6 in NGC 6822
(12 + log[O/H] 8.20,
Lequeux et
al. 1979).
Most of the galaxies studied by the aforementioned
(Bolatto et
al. 2008)
are dwarf irregulars with subsolar metallicity.
In each case we highlight the results for the
highest resolution study of the galaxy in question. We discuss the
effects of varying spatial resolution in the next section. Overall,
these studies show that high spatial resolution virial mass
measurements suggest roughly Galactic XCO irrespective of
metallicity.
6.6 in NGC 6822
(12 + log[O/H] 8.20,
Lequeux et
al. 1979).
Most of the galaxies studied by the aforementioned
(Bolatto et
al. 2008)
are dwarf irregulars with subsolar metallicity.
In each case we highlight the results for the
highest resolution study of the galaxy in question. We discuss the
effects of varying spatial resolution in the next section. Overall,
these studies show that high spatial resolution virial mass
measurements suggest roughly Galactic XCO irrespective of
metallicity.
Virial masses have also been measured for very large structures, GMAs or superclouds (Vogel, Kulkarni & Scoville 1988, Wilson et al. 2003), although it is unclear the degree to which they are virialized or even bound. Wilson et al. (2003) consider ~ 500 pc-scale structures in the Antennae Galaxies and find the XCO to be approximately Galactic (see also Ueda et al. 2012, Wei, Keto & Ho 2012), but this conflicts with results from spectral line modeling (see Section 7). Phrasing their results largely in terms of boundedness, Rand & Kulkarni (1990) and Adler et al. (1992) find XCO,20 ~ 3 and XCO,20 ~ 1.2 to be needed for virialized GMAs in M 51. Studies of other galaxies, for example M 83 (Rand, Lord & Higdon 1999), suggest that not all GMAs are gravitationally bound and that the mass spectrum of GMAs varies systematically from galaxy to galaxy or between arm and interarm regions (Rand & Kulkarni 1990, Rand, Lord & Higdon 1999, Wilson et al. 2003), complicating the interpretation of these large-scale measurements.
5.1.2. Caveats on Virial Mass-Based XCO Estimates
As we will see in Section 5.2, the approximately constant Galactic XCO implied by virial masses on small scales at low metallicity appears to contradict the finding from dust-based measurements and other scaling arguments (for example Blanc et al. 2013), which consistently indicate that XCO increases with decreasing metallicity. This discrepancy most likely arises because virial mass measurements sample the gas that is bright in CO, while dust-based measurements include all H2 along the line-of-sight. As discussed below (Section 6), decreasing dust shielding at low metallicities causes CO to be preferentially photodissociated relative to H2, creating a massive reservoir of H2 in which C+ and C rather than CO represent the dominant forms of gas-phase carbon. Because this reservoir is external to the CO emitting surface it will not be reflected in the CO size or its line width (unless the surface pressure term is important). Thus, we expect that high resolution virial mass measurements preferentially probe XCO in the CO-bright region.
The range of values discussed above, XCO,20 ~ 1-4, is significant. Does it indicate real variations in XCO? Measuring cloud properties involves several methodological choices (Section 4.1). Different methods applied to the same Milky Way data shift results by ~ 30%, and biases of ~ 40% are common in extragalactic data (e.g., Rosolowsky & Leroy 2006). As we discuss below, the XCO obtained by virial mass analysis seems to depend on the physical resolution of the observations. Ideally, results will be compared to "control" measurements that have been extracted and analyzed in an identical way, ideally at matched spectral and spatial resolution and sensitivity (e.g., Pineda et al. 2009). Many studies now employ the CPROPS algorithm (Rosolowsky & Leroy 2006), which is designed to account for sensitivity and resolution biases in a systematic way, allowing ready cross-comparison among data sets. This is not a perfect substitute, however, for matched analyses. Our assessment is that in lieu of such careful comparison, differences of ± 50% in XCO should still be viewed as qualitatively similar.
We raised the issue of spatial scale in the discussion of systematics
and implicitly in the discussion of GMAs. Virial mass-based
XCO
exhibit a complex dependence on the spatial scale of the
observations. For dwarf galaxies it seems that even using similar
methodology and accounting for resolution biases, studies with finer
spatial resolution systematically return lower XCO
than coarser resolution studies. For example,
Hughes et
al. (2010)
find XCO,20
4 in the LMC (as do
Israel et
al. 2003,
Pineda et
al. 2009,
Wong et al. 2011)
compared to XCO,20
7 found by
Fukui et
al. (2008)
using similar methodology but with ~ 3 times
coarser linear resolution. In the SMC,
Mizuno et
al. (2001)
find XCO,20
14, while higher
resolution studies find XCO as low
as XCO,20 ~ 2-4 for the smallest resolved objects
(Israel et
al. 2003,
Bolatto et
al. 2003).
Contrasting the interferometer measurements of
Wilson (1994)
and the coarser single-dish observations of
Gratier et
al. (2010)
reveals a similar discrepancy in
NGC 6822. In one of the first studies to consider
this effect,
Rubio, Lequeux
& Boulanger (1993)
explicitly fit a dependence for XCO in the
SMC as a function of spatial scale, finding
XCO
 R0.7
(see also the multiscale analyses in
Bolatto et
al. 2003,
Leroy et
al. 2009).
R0.7
(see also the multiscale analyses in
Bolatto et
al. 2003,
Leroy et
al. 2009).
This scale dependence may reflect one of several scenarios. First, low resolution observations can associate physically distinct clouds that are not bound, causing a virial mass analysis to overpredict XCO. Alternatively, the ensemble of clouds conflated by a coarser beam may indeed be bound. In the case of a heavily molecular interstellar medium like the Antennae Galaxies or the arm regions of M 51, most of the material in the larger bound structure may be molecular and a virial mass measurement may yield a meaningful, nearly Galactic conversion factor for objects much bigger than standard GMCs. For a low metallicity irregular galaxy, the best case for low resolution virial mass measurements is that large complexes are virialized and that the low AV gas between the bright clouds is H2 associated with [CII]. We caution, however, that this is only one of many possible scenarios.
We suggest that the sensitivity of virial mass measurements to extended CO-free envelopes of H2 is ambiguous at best. In that sense, the uniformity in XCO derived from virial masses probably reflects fairly uniform conditions in CO-bright regions of molecular clouds (Bolatto et al. 2008). The spatial scale at which virialized structures emerge in galaxies is unclear. Given these ambiguities and the assumptions involved in the calculation of virial masses, we emphasize the need for careful comparison to matched data to interpret virial results.
5.2. Extragalactic Dust-Based Estimates of XCO
Dust is expected and observed to be well-mixed with gas, and dust
emission remains optically thin over most regions of normal
galaxies. Following the approach outlined in
Section 4.2, dust
emission offers a tool to estimate XCO. Modeling
infrared or millimeter emission yields an estimate of the dust optical
depth,  d. Using
Eq. 23, XCO can be
estimated from d,
HI, CO, and the dust emissivity per H atom (Eq. 22). Conventions in the
literature vary, with
d sometimes
combined with a dust mass absorption coefficient and used as a dust
mass, and
d. Using
Eq. 23, XCO can be
estimated from d,
HI, CO, and the dust emissivity per H atom (Eq. 22). Conventions in the
literature vary, with
d sometimes
combined with a dust mass absorption coefficient and used as a dust
mass, and  DGR
alternately cast as the emissivity per H atom or a dust-to-gas mass
ratio. Regardless of convention, the critical elements are a linear
tracer of the dust surface density and a calibration of the relation
between this tracer and gas column density.
DGR
alternately cast as the emissivity per H atom or a dust-to-gas mass
ratio. Regardless of convention, the critical elements are a linear
tracer of the dust surface density and a calibration of the relation
between this tracer and gas column density.
Thronson et
al. (1988)
and
Thronson
(1988b)
first suggest and apply variations on this technique to nearby galaxies.
Israel (1997)
uses data from IRAS to carry out the first comprehensive dust-based
extragalactic XCO study. He considers
individual regions in eight (mostly irregular) galaxies and derives
d from a
combination of 60 and 100µm continuum data.
Israel (1997b)
estimates DGR,
the dust emissivity per H atom, from comparison of
d and HI in
regions within the galaxy of interest but chosen to lie well away from
areas of active star formation, thus assumed to be
atomic-dominated. This internally derived estimate of
DGR
represents a key strength of the approach:
DGR is
derived self-consistently from comparison of HI and
d, and does not
rely on assuming a dust-to-gas ratio. This
leads to the cancellation of many systematic errors (e.g., see
Israel 1997b,
Leroy et
al. 2007),
leaving only variations in
DGR and
d within the
target to affect the determination of XCO in Eq. 23.
5.2.1. Dust-Based Estimates in Normal Disk Galaxies
Spitzer and Herschel allowed the extension of the dust
approach to more massive, more distant, and more "normal" galaxies.
Draine et
al. (2007)
compare galaxy-integrated infrared
spectral energy distribution (SED) modeling to CO and HI
luminosities for a large sample. They argue that
XCO,20
4 (over entire galaxies) yields the most sensible gas-to-dust ratio
results in their sample.
Leroy et
al. (2011)
perform a self-consistent treatment of the Local Group galaxies M 31, M 33, LMC, NGC 6822, and SMC. They find
XCO,20
1-4.5 for regions of
M 31, M 33, and the LMC (the higher metallicity galaxies in the sample).
Smith et
al. (2012)
use Herschel observations to solve for XCO
finding XCO,20
2 in M 31.
Other dust tracers such as mm-wave continuum emission and visual
extinction have been used to arrive at XCO estimates,
although usually by assuming or scaling a Galactic calibration with the
associated systematic uncertainties.
Guelin et
al. (1993)
use 1.2 mm continuum observations of the edge-on spiral NGC 891 to
estimate XCO,20 ~ 1. Both
Nakai & Kuno
(1995)
and
Guelin et
al. (1995)
study XCO in M 51, the first using extinction
estimates from H / H
/ H , the
second millimeter-wave continuum emission.
Nakai & Kuno
(1995)
arrive at XCO,20
0.9 ± 0.1 with
a factor of ~ 2 variation with galactocentric radius, while
Guelin et
al. (1995)
finds XCO,20 ~ 0.6.
Zhu et al. (2009)
employs 850 µm data to check the
XCO derived from spectral line modeling in NGC 3310
and NGC 157, finding good agreement with
XCO,20
1.3-3.0 in the disks of
their targets and a much lower XCO in the center of
NGC 157.
, the
second millimeter-wave continuum emission.
Nakai & Kuno
(1995)
arrive at XCO,20
0.9 ± 0.1 with
a factor of ~ 2 variation with galactocentric radius, while
Guelin et
al. (1995)
finds XCO,20 ~ 0.6.
Zhu et al. (2009)
employs 850 µm data to check the
XCO derived from spectral line modeling in NGC 3310
and NGC 157, finding good agreement with
XCO,20
1.3-3.0 in the disks of
their targets and a much lower XCO in the center of
NGC 157.
Sandstrom et
al. (2012)
carry out the most comprehensive
extragalactic study of XCO to date. They combine
high-quality CO
J = 2 → 1 maps with Herschel and Spitzer dust
continuum, and high-resolution HI data. Building on the method of
Leroy et
al. (2011),
they break apart galaxies into regions
several kpc2 in size and within each region they
simultaneously solve for
DGR and
XCO. This yields resolved,
self-consistent XCO
measurements across 22 galaxy disks. Their methodology requires good
S/N CO detections and so restricts robust XCO
measurements to
reasonably CO-bright parts of galaxies, typically half of the optical
disks. There, the authors find XCO,20
1.4-1.8
2
with a 1 scatter among
individual solutions of 0.4 dex.
scatter among
individual solutions of 0.4 dex.
The top panel of Fig. 7 shows XCO derived by Sandstrom et al. (2012) as a function of galactocentric radius for their whole sample. The bottom panel shows XCO for each region normalized to the average value for the galaxy, highlighting the internal radial structure. This study finds clear central XCO depressions for a number galaxies. The value of XCO in galaxy centers relative to their disks spans a range from no change to a factor of five below the galaxy average. The authors note that these low central XCO values tend to coincide with high stellar masses and enhanced CO brightness, suggesting that the effects discussed for starbursts in Section 7 may also be at play in the central parts of many galaxies, including the Milky Way (Section 4).
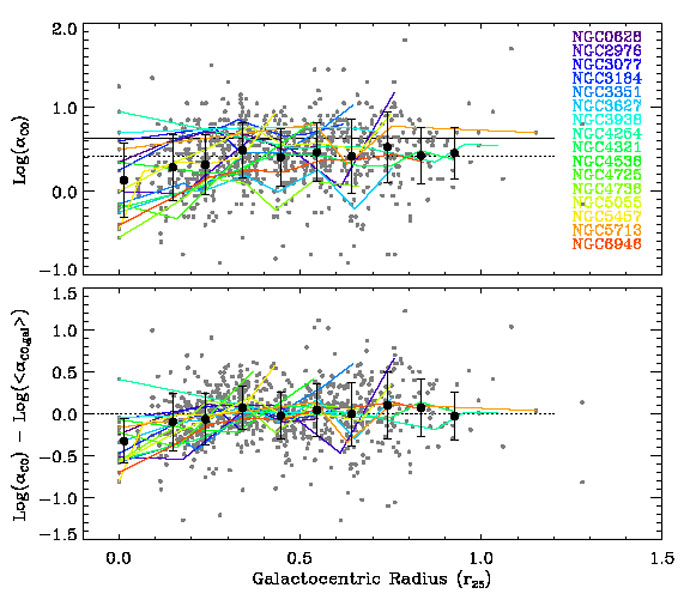 |
Figure 7. Dust-based
|
Thus in the disks of normal star-forming galaxies, a dust-based
approach yields XCO,20
1-4 on kpc
scales. For comparison, in
the Milky Way extinction yields XCO,20
1.7-2.3 and dust
emission yields XCO,20
1.8-2.5
(Section 4.2,
Table 1). Thus, broadly dust
analyses strongly
support a Milky Way conversion factor in the disks of normal, massive
disk galaxies but methodological differences and, presumably, real
changes in XCO with environment produce a factor of 2
spread among studies and galaxies.
5.2.2. Dust-Based Estimates in Dwarf Irregular Galaxies
Dust-based determinations of XCO in low metallicity
dwarf irregular galaxies consistently yield values much higher than
Galactic, and also generally higher than virial estimates.
Israel (1997)
finds in the SMC, the lowest metallicity target, a notably high
XCO,20
120 ± 20.
Boselli, Lequeux
& Gavazzi (2002)
carry out a similar calculation and also find systematically higher
XCO at low metallicity. Subsequent studies leveraging
the sensitivity, resolution, and wavelength coverage of Spitzer
and Herschel qualitatively support this conclusion. Leroy et al.
(2007,
2009),
and
Bolatto et
al. (2011)
follow
Israel (1997)
and
Stanimirovic
et al. (2000)
in analyzing the SMC. They find XCO,20
40-120
using measurements that isolate individual clouds and estimate
DGR locally.
Gratier et
al. (2010)
considers NGC 6822 using a similar
technique, also finding high XCO,20
40 on large
scales. Attempting to minimize systematics and making very
conservative assumptions,
Leroy et
al. (2011)
still find XCO,20
10 and 40 for NGC 6822 and the SMC, significantly higher than they find
for the higher metallicity M 31, M 33, and the LMC.
In the Magellanic Clouds, Herschel and millimeter-wave bolometer cameras have mapped individual molecular clouds. Roman-Duval et al. (2010) find an increase in XCO in the poorly shielded outer regions of LMC clouds. Rubio et al. (2004), Bot et al. (2007), and Bot et al. (2010) find unexpectedly bright millimeter-wave emission in SMC clouds. Bot et al. (2010) show that the emission suggests a factor of four higher masses than returned by a virial analysis, even on very small scales and even assuming a very conservative rescaled Milky Way dust mass emissivity coefficient.
Therefore, dust-based XCO estimates indicate high conversion factors in low metallicity, irregular systems. This agrees with some other methods of estimating XCO but not with virial mass results, particularly on small scales, as already discussed (Section 5.1). We discuss the discrepancy further below (Section 6). The simplest explanation is that virial masses based on CO emission do not sample the full potential well of the cloud in low metallicity systems, where CO is selectively photodissociated relative to H2 at low extinctions.
5.2.3. Caveats on Dust-Based XCO Estimates
Because dust traces the total gas in the system with little bias (at least compared to molecules), this technique represents potentially the most direct way to estimate XCO in other galaxies. We highlight two important caveats: the possibility of other "invisible" gas components and variations in the emissivity.
As described, the method will trace all gas not accounted for by HI 21 cm observations and assign it to H2. The good qualitative and quantitative association between H2 derived in this manner and CO emission suggests that H2 does represent the dominant component (e.g., Dame, Hartmann & Thaddeus 2001, Leroy et al. 2009), but opaque HI and ionized gas may still host dust that masquerades as "H2" using Eq. 23. Both components could potentially represent significant mass reservoirs. Their impact on dust-based XCO estimates depends on the methodology. Any smooth component evenly mixed with the rest of the ISM will "divide out" of a self-consistent analysis. Moreover, the warm ionized medium exhibits a large scale height compared to the cooler gas discussed here and may be subject to dust destruction without replenishment (e.g., see Draine 2009). Planck Collaboration et al. (2011b) find that dust associated with their ionized gas template represents a minor source of emission. On the other hand, absorption line experiments from our galaxy and others suggest that ~ 20% HI may be missed due to opacity effects (Heiles & Troland 2003) and observations of M 31 suggest that it may lie in a filamentary, dense component (Braun et al. 2009), making it perhaps a more likely contaminant in XCO determinations. Nonetheless, the close agreement between XCO derived from dust and other determinations in our Galaxy strongly suggests that contamination from dust mixed with other "invisible" components, particularly the ionized gas, represents a minor correction.
Concerning the second caveat, the methodology relies on either blindly
assuming or self-consistently determining the dust emissivity per
hydrogen, DGR.
This is a combination of the
dust-to-gas mass ratio, and the mass absorption coefficient of dust at
IR wavelengths. In blind determinations, a linear scaling of Eq. 22
with metallicity is usually assumed. In self-consistent
XCO determinations,
DGR is
measured locally through the ratio of the
dust tracer to HI somewhere within the galaxy (for example, in an
HI-dominated region), and ideally close to or inside the region where
XCO is estimated. This makes self-consistent
determinations very robust. Even the most robust analyses, however,
still assume
DGR to be
constant over some region of a galaxy and along a line of sight, and
between the atomic and molecular phases. The
DGR, however,
may change across galaxies and between phases due to metallicity gradients,
varying balance of dust creation and destruction, or changes in dust
grain properties.
As discussed in Section 4.2, recent
Planck results
suggest only mild localized variations in the emissivity per H nucleon
across the Milky Way. Observations of other galaxies do show that
DGR depends
on metallicity
(Draine et
al. 2007,
Muñoz-Mateos et al. 2009).
Large scale ISM density may also be important;
DGR appears
depressed in the low-density
SMC Wing and the outer envelopes of dwarf galaxies
(Bot et al. 2004,
Leroy et al. 2007,
Draine et
al. 2007).
The balance of the dust production and destruction mechanisms is
complex: basic accounting implies that most dust mass buildup occurs
in the ISM
(Dwek 1998,
Draine 2009
and references therein), suggesting an increase in
DGR in denser
regions of the ISM where this accumulation must take
place. Independent of dust mass buildup, if grains become more
efficient emitters for their mass at moderate densities (through the
formation of fluffy aggregates, for example) then the effective
DGR
will be higher at high densities. Though not strongly favored by the
overall Planck results, which suggest that emissivity variations
are localized, a number of authors point to evidence for an
environmental dependency of the dust emissivity (e.g.,
Cambrésy,
Jarrett & Beichman 2005,
Bot et al. 2007).
In our opinion these caveats concerning emissivity will lead a dust-based approach to preferentially overpredict the amount of H2 present and consequently XCO, as dust associated with the molecular ISM will have a higher dust-to-gas ratio or be better at emitting in the far-infrared. Nonetheless, we still see the dust-based approach as the most reliable way of producing extragalactic XCO estimates. Placing stronger quantitative constraints on these systematics requires further work. The Planck results noted above, and the close agreement in the Milky Way of dust-based XCO with other techniques, suggests that emissivity variations are not a major concern.
5.3. Extragalactic Spectral Line Modeling
Observations of multiple CO lines or a combination of CO and other chemical species allow one to constrain the physical conditions that give rise to CO emission. When these observations include optically thinner tracers like 13CO, these constraints can be particularly powerful. Due to sensitivity considerations, most multi-line data sets have been assembled for bright regions like galaxy centers (or starbursts, Section 7). From these data we have constraints on XCO in bright regions with very different systematics than either virial or dust-based techniques.
Generally, these results indicate that XCO lower than
XCO,20 = 2 is
common but not ubiquitous in the bright, central regions of galaxies.
This is in qualitative agreement with the independent
(Sandstrom et
al. 2012)
dust-based results already mentioned. For example,
Israel, Tilanus
& Baas (2006)
use large velocity gradient (LVG) modeling of
multiple 12CO, 13CO, and [CI] lines in the central
region of M 51. They find XCO,20
0.25-0.75 in the
central regions, in good agreement with earlier work by
Garcia-Burillo, Combes & Gerin (1993).
Israel (2009)
and
Israel (2009b)
extend this work to the centers of ten bright and
starburst galaxies, finding XCO,20 ~ 0.1-0.3
(see also
Israel et
al. 2003,
Israel & Baas
2001),
again significantly lower than Galactic. Based on maps of the
12CO/13CO ratio across NGC 3627,
Watanabe et
al. (2011)
argue for a similar central depression in XCO, with
dynamical effects associated with a galactic bar leading to broader line
widths and optically thinner 12CO emission. Using optically
thin tracers and dust emission, Meier & Turner
(2001,
2004)
find that XCO,20 ~ 1-0.5 in the centers of IC 345 and NGC 6946. Lower conversion factors are not a
universal result, however. Utilizing high resolution data,
Schinnerer et
al. (2010)
found XCO much closer to Galactic in the arms
of M 51, XCO,20
1.3-2.0. They
attribute the difference with
previous studies to the implicit emphasis on GMCs in their high
resolution data, speculating that it removes a diffuse CO-bright
component that would drive XCO to lower values.
In addition to degeneracy inherent in the modeling, these line ratio-based techniques suffer from the fundamental bias of the virial mass technique. They are only sensitive to regions where CO is bright and so may miss any component of "CO-faint" H2. A handful of observations of low metallicity dwarf galaxies have attempted to address this directly by combining CO and [CII] observations, with [CII] employed as a tracer of the "CO-faint" molecular regime (Maloney & Black 1988, Stacey et al. 1991). Poglitsch et al. (1995) find that the [CII]-to-CO ratio in the 30 Doradus region of the LMC is ~ 60,000, roughly an order of magnitude higher than is observed in Milky Way star forming regions or other star-forming spirals (e.g., Stacey et al. 1991). Israel et al. (1996) and Israel & Maloney (2011) also find high values elsewhere in the LMC and SMC, with large scatter in the ratio. Madden et al. (1997) find that regions in the Local Group dwarf IC 10 also exhibit very high [CII] 158µm emission compared to CO, 2–10 times that found in the Milky Way. They argue that [CII] emission cannot be readily explained by the available ionized or HI gas, and is thus an indicator of H2 where CO is photodissociated. Hunter et al. (2001) present ISO measurements for several more dwarf irregular galaxies, showing that at least three of these systems also exhibit very high [CII]-to-CO emission ratios. Cormier et al. (2010) present a Herschel map of the 158µm [CII] line in NGC 4214, again showing very high [CII]-to-CO ratios ( ~ 20,000-70,000) that cannot be explained by emission from [CII] associated with ionized gas. Inferring physical conditions from the [CII] line requires modeling. When such calculations are carried out generally imply a massive layer on the photodissociation region in which the dominant form of hydrogen is H2, while carbon remains ionized as C+ (e.g., Madden et al. 1997, Pak et al. 1998).
Thus, detailed spectral line studies of CO-bright sources often, but not always, suggest lower XCO in the bright central regions of galaxies. Meanwhile, at low metallicities, [CII] observations suggest an important reservoir of H2 not traced by CO.
5.4. Synthesis: XCO in Normal Galaxies
Taken together, the picture offered by extragalactic XCO
determinations in normal galaxy disks resembles that in the Milky Way
writ large (Section 4.4). Virial masses,
dust-based estimates, and spectral line modeling all suggest
XCO,20
1-4 in
the disks of normal spiral galaxies. Systematics clearly still affect
each determination at the 50% level, with physical effects likely
adding to produce the factor-of-two dispersion. Given this, applying
a "Milky Way" XCO = 2 × 10²⁰
cm-2(K km s-1)-1 with an uncertainty
of 0.3 dex appears
a good first-brush approach for normal
star-forming galaxies. This applies to galaxies where the CO
emission is dominated by self-gravitating clouds or cloud complexes
with masses dominated by H2.
Several very strong lines of evidence, as well as simple arguments,
show that XCO increases sharply in systems with
metallicities below 12 + log[O/H]
8.4 (approximately
one-half solar,
Asplund et
al. 2009).
High spatial resolution virial estimates find
approximately "Galactic" XCO in low metallicity
clouds, but they are not sensitive to extended "CO-faint" H2
envelopes, only to CO-bright regions. We expand on the dependence of
XCO on metallicity in
Section 6. We caution about the usefulness of
virial estimates on large spatial scales, particularly in low
metallicity galaxies. But even in normal galaxies, concerns exist
about whether molecular cloud complexes and associations are bound and
dominated by H2 on large scales.
Finally, in the central parts of galaxies spectral line modeling suggests that XCO is often, but not always, depressed in a manner similar to that seen in the Galactic center and in molecule-rich starbursts. Dust observations are consistent with this picture, revealing central depressions in XCO in some galaxies. Broader line widths, increased excitation, and the emergence of a diffuse molecular medium likely contribute to more CO emission per unit mass, decreasing XCO. We expand on this topic when we consider starbursts in Section 7.
2 The weighting used to derive the
average XCO affects the mean value. Weighting all high
quality solutions equally,
Sandstrom et
al. (2012)
find mean XCO,20
1.4, median
XCO,20
1.2. Weighting
instead by CO intensity, they find XCO,20
1.8.
Back