


As we saw in Section 3, Galactic rotation curves are one piece of the multifaceted dark matter puzzle. Around the time of Rubin & Ford (1970), cosmologists began to understand that relics from the early Universe, in the form of subatomic particles, could contribute significantly to the present-day mass density of the Universe. Today, the leading dark matter candidate is a stable, electrically neutral, supersymmetric particle with a mass between 1 GeV and 1 TeV. This weakly interacting massive particle or WIMP, would have been non-relativistic during the formation of large scale structure and hence, represents an example of cold dark matter (CDM; see, for example, Bertone et al. 2005). WIMPs naturally form halos with roughly the right structure to explain flat rotation curves (Blumenthal et al. 1984; Dubinski & Carlberg 1991; Navarro et al. 1996b). Moreover, the halo mass function that is predicted by the standard CDM theory of structure formation is consistent with the observed hierarchy of virialized systems from dwarf galaxies to clusters (Press & Schechter 1974; Bardeen et al. 1986; Tinker et al. 2008).
In the mid-80's, several researchers pointed out that WIMPs might be detected in the laboratory (Drukier & Stodolsky 1984; Goodman & Witten 1985). At present over a dozen groups have deployed or are building terrestrial dark matter detectors (Bertone et al. 2005; Feng 2010). These experiments have the potential to probe the local density and velocity dispersion of dark matter at the position of the Earth. By the same token, the interpretation of these experiments, and in particular, the constraints inferred on the mass and scattering cross section of dark matter candidates, depend on astrophysical estimates of the local dark matter distribution function. Thus, there is a direct link between mass models of the Milky Way and dark matter detection in the laboratory.
Apart from the dark matter question, the Milky Way presents an opportunity to observe a "typical" (barred SBc) spiral galaxy from a unique vantage point. Thus, observations of the Milky Way hold a special place in our attempt to understand the formation and structure of spiral galaxies. The remainder of this section focuses on what we know about the distribution of baryons and dark matter in the Galaxy.
Studies of the Milky Way are invariably challenged by our position within it and by our frame of reference, which orbits about the Galactic center. In particular, our distance to the Galactic center and the circular speed at the position of the Sun remain uncertain at the 5% level (Ghez et al. 2008; Gillessen et al. 2009; Reid et al. 2009; Bovy et al. 2009; Brunthaler et al. 2011; Schönrich 2012). These uncertainties enter our interpretation of various observations and our determination of the mass of the Galaxy. On the other hand, the Milky Way offers a unique opportunity to probe the distribution of both visible and dark matter relatively close to the Galactic center. By contrast, for external disk galaxies, rotation curves provide evidence for dark matter only in the outermost regions where dark matter dominates. Estimates of the density of dark matter in the inner regions of large spiral galaxies require assumptions about the shape of the dark halo density profile.
The Milky Way is also unique in that there exist extensive catalogs of halo stars, globular clusters, and satellite galaxies with reliable Galactocentric distances and velocities. These tracers provide important constraints on the Galactic potential. Moreover, numerous stellar streams, such as the Sagittarius and Monoceros streams, may provide another handle on the Galactic
4.2. Multicomponent Models for the Milky Way
The literature is replete with models of the Milky Way. An important early example can be found in Bahcall et al. (1982, hereafter BSS). Their model comprised a double-exponential disk, a (deprojected) de Vaucouleurs stellar halo, a cuspy bulge, and a dark matter halo. The parameters that described the disk and stellar halo were taken from the earlier work by Bahcall & Soneira (1980), which, in turn, were based on star counts. The BSS model for the dark halo assumed a constant density core and a r-2.7 power-law fall-off at large radii. Notably, BSS showed that the different components of the Galaxy could "conspire" to produce a flat rotation curve for a wide range of model parameters, particularly the disk mass-to-light ratio and the structural parameters of the halo (see also Bahcall & Casertano 1985; van Albada et al. 1985). Blumenthal et al. (1984) argued that adiabatic contraction, the respose of dark matter to the baryonic component as it condenses and forms the disk and bulge, could "explain" the apparent conspiracy that leads to flat rotation curves. Nevertheless, the disk-halo conspiracy in the context of a ΛCDM universe remains an outstanding problem in galactic astronomy while the disk-halo degeneracy continues to plague attempts to pin down the structural parameters of dark matter halos (Dutton et al. 2005).
Sellwood (1985) took the BSS model a step further by realizing it as an N-body distribution and numerically evolving it forward in time. He found that the BSS model was stable against bar formation though it did develop a two-armed spiral. Recall that a self-gravitating disk is generally unstable to the formation of a bar while a disk of particles on circular orbits in a background potential is stable. Disk galaxies lie somewhere between these extremes with the gravitational force felt by the disk particles coming from both the disk itself and the other components. In the BSS model, the bulge plays the key role in stabilizing the disk 7.
Another influential model, especially for its focus on the Galactic bulge, was devised by Kent (1992). Kent et al. (1991) constructed a luminosity model for the bulge based on the 2.4 µm map of the Galactic plane from the Spacelab Infrared Telescope. Kent (1992) combined this model with velocity dispersion data to determine the mass-to-light ratio for the Galactic bulge. He then constructed disk-bulge-halo mass models designed to fit the rotation curve. The results hinted at the existence of a supermassive black hole in the Galactic center. (For an earlier discussion of the existence of a central supermassive black hole, see Lacy et al. 1982). Moreover, Kent's model requires that one allow for non-circular motions in the gas, as in Gerhard & Vietri (1986). The Milky Way is now known to be a barred spiral galaxy (Blitz & Spergel 1991; Binney et al. 1997) and mass models that incorporate a bar include Fux (1997; 1999) and Englmaier & Gerhard (2006).
Dehnen & Binney (1998) constructed a suite of disk-bulge-halo Galactic mass models. The observational constraints for their work included the circular speed curve, the velocity dispersion toward the bulge, the Oort constants, the local velocity dispersion tensor, and the force and surface density in the solar neighborhood. Dehnen & Binney (1998) surveyed the 10-dimensional parameter space of models using a restricted maximum likelihood analysis in that they considered 25 examples wherein some parameters were held fixed while the remaining parameters are allowed to vary so as to minimize the likelihood function.
Widrow et al. (2008, hereafter WPD) constructed dynamical models for the Galaxy using observational constraints similar to those considered by Dehnen & Binney (1998). WPD deployed Bayesian inference and a Markov Chain Monte Carlo (hereafter MCMC) algorithm to construct the full probability distribution function (PDF) over the model parameter space. The PDF is found to include regions of parameter space in which the model is highly unstable to the formation of a strong bar, so much that the models are almost certainly unphysical. In other regions of parameter space, the models are found to be mildly unstable to the formation of a weak bar and therefore may well represent an axisymmetric, idealized approximation to the Milky Way. Binney (2010a), Binney & McMillan (2011) and McMillan & Binney (2012) have continued to develop observationally-motivated models for the Milky Way along similar lines.
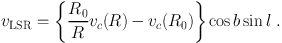
As mentioned above, both Dehnen & Binney (1998) and WPD use the Galactic circular speed curve as a model constraint. As with external galaxies, observations of neutral hydrogen provide a measure of the Galactic rotation curve, which translates to a circular speed curve provided the gas follows circular orbits. Inside the solar circle, HI observations are usually presented in terms of the so-called terminal velocity, vterm, which is defined as the peak velocity along a line of sight at Galactic coordinates b = 0 and |l| < π/2. If one assumes axisymmetry, then the HI emission corresponding to the peak velocity originates from the galactocentric radius R = R0sinl where R0 is our distance from the Galactic center. Thus vc(R) = vterm + vc(R0)sinl where vc is the circular speed center. Malhotra (1995) for example, has determined the terminal velocity to the HI measurements of Weaver & Williams (1973); Bania & Lockman (1984); Kerr et al. (1986) and her measurements were used in both the Dehnen & Binney (1998) and WPD analyses.
The radial velocity of an object at Galactic coordinates (l, b) relative to the local standard of rest, vLSR is related to the circurlar velocity via the expression
 |
(16) |
Brand & Blitz (1993) consider a sample of HII regions/reflection nebulae with distances and radial velocities are available and use this method to infer the rotation of the Galaxy out to 17 kpc. Unlike the terminal velocity measurement, R must here be inferred from observations of the heliocentric distance D through the relation R = (D2cos2 b + R02 - 2R0 Dcosbsinl)1/2. Dehnen & Binney (1998) and Widrow & Dubinski (2005) present a statistical method for accomplishing this and incorporate the Brand & Blitz (1993) data into their Galactic model constraints. Note that both terminal velocity and outer rotation curve methods require R0 and vc(R0), both of which are uncertain at the 5% level. A proper statistical analysis using these methods therefore requires a marginalization over R0 and vc(R0), subject to prior probabilities for these parameters.
Xue et al. (2008) derived a Galactic rotation curve out to radius of 60 kpc. Their rotation curve is based on observations of blue horizontal branch (BHB) stars from the Sloan Digital Sky Survey (SDSS) which provided line-of-sight velocity distributions at different galactocentric radii. To construct the rotation curve, they compared these observations with mock observations of simulated Milky Way-like galaxies. Further investigations of halos stars are discussed below.
Figure 14 shows the inner rotation curve as inferred from HI observations by Malhotra (1995), the outer rotation curve inferred from observations of HII regions by Brand & Blitz (1993), and the Xue et al. (2008) rotation curve. The upper panel also shows the circular speed curve for one of two mass models from Xue et al. (2008). This model assumes a Hernquist bulge, a sphericalized exponential disk, and an NFW halo. The lower panel shows one of the more stable examples from the WPD Bayesian analysis. Note that the Xue et al. (2008) model was not constrained by Malhotra (1995) or Brand & Blitz (1993)'s data while the WPD model was constructed independent of the Xue et al. (2008) results.
 |
Figure 14. Rotation curve, as determined from the analysis of BHB stars by Xue et al. (2008) (green), the terminal velocity method by Malhotra (1995) (blue), and the analysis of Hii regions/reclection nebulae by Brand & Blitz (1993) (red). The upper panel shows the model predictions from Xue et al. (2011) for the total rotation curve (solid) and the contributions from the disk (dashed), bulge (long-dashed), and halo (dotted). The lower panel shows the WPD model. |
Along rather different lines, Klypin et al. (2002) constructed mass models for both the Milky Way and M31 that were motivated by disk formation theory in the standard ΛCDM cosmology. To be precise, they assume that the proto-galaxy has a NFW halo with a concentration parameter in agreement with pure dark matter simulations. The present-day halo is derived by adiabatically contracting the early-time halo.
In Table 1, we present various structural parameters for the models described in this and the next section. We include, in addition to the disk, bulge and halo masses, the local dark matter density, the key quantity for terrestrial detection experiments. Note that the assumed canonical value for these experiments is 0.0079 M⊙ pc-3 = 0.3 GeV cm-3 (Lewin & Smith 1996; Bertone et al. 2005). The local density of dark matter is of particular interest for direct detection experiments. A more complete discussion of this parameter can be found in Catena & Ullio (2010); Catena & Ullio (2012) and WPD.
| model | Md | h | Mb | M100 | Vdisk2 / Vtot2 | ρDM,⊙ |
| BSS | 5.6 | 3.5 | 1.1 | 144 | 0.53 | 0.009 |
| Kent (1992) - low Md | 3.7 | 2.8 | 1.2 | 125 | 0.4 | 0.013 |
| Kent (1992) - high Md | 5.5 | 2.8 | 1.2 | 116 | 0.67 | 0.0097 |
| Dehnen & Binney (1998) | 0.36-1.5 | 2-3.4 | 3.3-5.1 | 40-75 | 0.33-0.83 | 0.009-0.012 |
| Klypin et al. (2002) | 4 | 3.5 | 0.8 | 55 | 0.37 | 0.007 |
| Widrow et al. (2008: WPD) | 4.1 | 2.8 | 0.96 | 40-19+22 | 0.5 | 0.008 ± 0.0014 |
| Smith et al. (2007) | 5 | 4 | 1.5 | 55 | 0.4 | 0.011 |
| Xue et al. (2008) | 5 | 4 | 1.5 | 49 | 0.33 | 0.006 |
| Gnedin et al. (2010) | 5 | 3 | 0.5 | 89 | 0.33 | 0.014 |
| McMillan et al. (2012) | 5.7 | 2.9 | 0.9 | 83 | 0.63 | 0.0104 |
| Moni Bidin et al. (2012) | 0 ± 0.001 | |||||
| Bovy & Tremaine (2012) | 0.008 ± 0.003 | |||||
Table 1: Selected mass models of the Milky Way as presented in the text. The disk mass, Md, bulge mass, Mb, and total mass within 100 kpc, M100, are given in units of 1010 M⊙. The disk scale length, h, is given in units of kpc. Note that Smith et al. (2007) assume a Miyamoto-Nagai model (Miyamoto & Nagai 1975) for the disk where the peak in the contribution of the disk to the circular speed curve occurs at Rmax ≃ 1.4h. Xue et al. (2008) assume a "spherical" disk potential where Rmax ≃ 1.9h. All other models assume an exponential disk where Rmax ≃ 2.2h. Column 6 gives the ratio Vdisk2 / Vtot2 evaluated at Rmax where Vtot and Vdisk are the total observed velocity and contribution from the baryonic disk, respectively. The final column gives the density of dark matter in the solar neighborhood in units of M⊙ pc-3. |
||||||
As we saw in Section 3.4.1, a working definition for the maximal disk hypothesis is that
 |
With the exception of a few of the Dehnen & Binney (1998) models and possibly the heavy disk model of Kent (1992), all models shown in Table 1 find (or assume) a submaximal disk for the Milky Way. Roughly speaking, systems with smaller values of Vdisk2 / Vtot2 will be more stable against bar formation, though this ratio alone is an inadequate predictor of whether a bar will form (see, e.g. Debattista & Sellwood 2000 and WPD).
4.3. Further Observational Constraints on the Milky Way Potential
4.3.1. Circular Speed at the Sun's Position in the Galaxy
As mentioned above, our position within the Milky Way offers unique observational opportunities. Recently, Reid et al. (2009) (see also Brunthaler et al. 2011) reported VLBI measurements of trigonometric parallaxes and proper motions for 18 masers located in several of the Galaxy's spiral arms. These measurements yielded several structural parameters of Galaxy, most notably, the circular rotation speed at the position of the Sun. Their value Vc = 254 ± 16 km s-1, is 15% higher than the standard IAU 220 km s-1. (Brunthaler et al. (2011) analysed the same VLBI data but with updated values for the solar motion and found Vt = 239 ± 7 km s-1.) By contrast, Koposov et al. (2010) found Vc = 221 ± 18 km s-1 by fitting an orbit to the GD-1 stellar stream. Naively, a 15% change in circular speed implies a 33% change in mass, though the implications for the bulge, disk, and halo masses would require an analysis that incorporates other constraints such as the ones carried out by Dehnen & Binney (1998) or WPD. Moreover, Bovy et al. (2009) reanalysed the maser data and found a somewhat lower value with Vc = 236 ± 11. Their Bayesian analysis differed from that of Reid et al. (2009) by assuming a more general orbital distribution for the masers.
Recently, Schönrich (2012) described various ways to determine Vc based on as stellar kinematics. The idea is to model the streaming motion of stars using the full phase space information available from the SDSS/SEGUE survey. The results are consistent with those described above and again suggest that Vc is ~ 10% higher than the standard IAU value.
Smith et al. (2007) use a sample of high-velocity stars from the RAdial Velocity Experiment (RAVE; Steinmetz et al.) to infer that the local escape speed of the Galaxy is 544-46+64 km s-1 (90% confidence interval). The fact that the escape speed is significantly higher than √2 Vc provides compelling evidence that the Galaxy is embedded in a dark matter halo that extends well-beyond the solar circle. Smith et al. (2007) go on to combine their estimate for the escape speed with other kinematic constraints to derive (model-dependent) estimates for the virial radius, virial mass, and concentration of the Galactic dark halo. In particular, they consider a model for the Galaxy comprising a Miyamoto-Nagai (1975) disk, a Hernquist (1990) bulge, and an NFW halo. The halo potential can be written
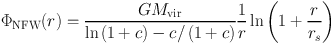 |
(17) |
where rs is the scale radius (see Equation 11), Mvir ≡ M(r = rvir) is the virial mass, and c = rvir / rs is the concentration parameter. The virial radius rvir is defined such that the mean density within rvir is δth ρcr where ρcr is the background density (Navarro et al. 1996b). The NFW potential has two free parameters. Thus, by combining the escape speed constraint
 |
(18) |
with the constraint on the local circular speed, one can infer the parameters of the dark halo. Smith et al. (2007) assume Md = 5 × 10¹⁰ M⊙, Mb = 1.5 × 10¹⁰ M⊙, δth = 340, and Vc = 220 km s-1 to obtain Mvir = 0.85-0.29+0.55 × 10¹² M⊙.
Yet another route to contraining the mass distribution of the Galaxy, especially beyond the solar circle, is provided by kinematic tracers such as halo stars, globular clusters, and satellite galaxies. Line-of-sight velocities are naturally more easily measured than proper motions. For tracers in the outer parts of the Galaxy, these line-of-sight velocities are primarily radial (with respect to the Galactic center) whereas line-of-sight velocities of tracers in other galaxies will be a mixture of radial and tangential velocities. Thus, the analysis of Galactic tracers takes a different form to that for external galaxies.
Early work on dynamical tracers used simple mass estimators such as the following example due to Lynden-Bell et al. (1983).
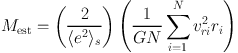 |
(19) |
where the sum is over the N objects (satellites, globular clusters, etc.) of the sample. The quantity ⟨ e2⟩s is the mean orbital eccentricity (⟨ e2⟩s = 1/2 for an isotropic distribution) and encapsulates our ignorance of the orbit distribution. The above expression is suitable for a system of objects orbiting a point mass M. Recently, Watkins et al. (2010) carried out a detailed systematic study of mass estimators for both the Milky Way and Andromeda galaxies based on satellite kinematics. Their results illustrate just how sensitive mass estimates are to assumptions about the velocity structure of the satellite population. In particular, the mass estimates at 100 kpc range from 1.8 × 10¹¹ M⊙ to 2.3 × 10¹² M⊙ depending on the degree of radial velocity anisotropy. A detailed discussion of mass estimators as they might be applied to Gaia data can be found in An et al. (2012)
With enough kinematic tracers, one can determine a velocity dispersion profile. Battaglia et al. (2005) for example, derive a radial velocity dispersion profile for the Galaxy from a sample of 240 halo objects (mainly globular clusters and halo stars). The dispersion is roughly constant at 120 km s-1 within 30 kpc and then decreases to about 50 km s-1 at a Galactocentric distance of 120 kpc. These results are consistent with those from a sample of 2400 BHB stars by Xue et al. (2008), though that sample only extended to a Galactocentric radius of 60 kpc. As discussed above, Xue et al. (2008) use the kinematics of BHB stars to derive a rotation curve by comparing their data with mock observations of simulated galaxies. Alternatively, one can model the dispersion profile directly.
The decline in the dispersion profile beyond 30 kpc places constraints on the density profile of the dark halo. In particular, an isothermal halo, where the density is ∝ r-2 is inconsistent with the data since the dispersion profile in this case is constant with radius. Battaglia et al. (2005) compare their dispersion profile with model profiles derived from the Jeans equation and find that the data are consistent an NFW halo that has a relatively high concentration (c = 18) and Mvir ≃ 0.8 × 10¹² M⊙.
Gnedin et al. (2010) also used halos stars to infer a rotation curve for the Milky Way. Their analysis was based on the spherical Jeans equation with the assumption that both the density and velocity dispersion profiles for the halo stars are described by power-law functions of radius. They find that the velocity dispersion declines very gradually out to 80 kpc and thus they infer a shallow slope for the dispersion profile. For this reason, they infer a larger mass for the virial radius and mass of the Galactic halo than Battaglia et al. (2005). Best-fit values for their three-component Galactic model (motivated, to a large extent, by the Klypin et al. (2002) cosmological model) are given in Table 1.
In principle, one can model the phase space DF for a set of tracers thereby taking full advantage of the data. This idea was discussed by Little & Tremaine (1987), who also introduced the use of Bayesian statistics to the problem. One begins by calculating the likelihood function (the probability of the data (e.g., radial velocities and distances for a population of kinematic tracers) given a model for the tracer DF and gravitational potential. Bayes's theorem then allows one to calculate the corresponding probability of the model given the data. In general, one since on is interested in the potential, one marginalizes over those model parameters that describe the DF. More sophisticated models for the Milky Way potential were considered by Kochanek (1996) and Wilkinson & Evans (1999) who modelled the kinematics of the satellite galaxy population. Similarly, Deason et al. (2012) modelled the distribution function of BHB stars to obtain constraints on the Galactic potential from 15-40 kpc.
4.3.4. Vertical Force and Surface Density in the Solar Neighborhood
The vertical structure of the Galactic potential provides a potentially powerful probe of the amount of dark matter in the solar neighborhood. The vertical force is approximately proportional to the surface density, which, in turn, can be compared to the total surface density from stars the interstellar medium. The classical means of determining the local vertical force requires a sample of stars with known vertical distances and velocities. The first detailed analysis of this type was carried out by Oort (1932) who built upon earlier and important work by Kapteyn (1922) and Jeans (1922). Attempts to understand the local vertical structure of the Galaxy from stellar kinematics have come to be known as the Oort problem.
Of course, in order to infer the local density of dark matter from the vertical structure of the Galaxy near the Sun, one requires a detailed model of the local distribution of visible matter. A detailed model of the visible components in the solar neighborhood can be found in Flynn et al. (2006). Note that the total estimated density in visible matter (their Table 2) is 0.091 M⊙ pc-3, which is a factor of 6-10 times greater than the predicted local dark matter density. Flynn et al. (2006) also found the local mass-to-light ratios in the B, V, and I bands to be (M* / L)B = 1.4 ± 0.2, (M* / L)V = 1.5 ± 0.2, and (M* / L)i = 1.2 ± 0.2, in good agreement with population synthesis predictions that use typical solar neighborhood IMFs.
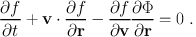
In general, the kinematics of the stars in the disk of the galaxy can be described by a phase space distribution function (DF), f(r, v, t), which obeys the collisionless Boltzmann equation
 |
(20) |
Typically, one assumes that the stars in the sample are in dynamical equilibrium (∂f / ∂t = 0) and that vertical motions decouple from motions in the disk plane. With these assumptions, f(r, v, t) ∝ F(z, vz) and
 |
(21) |
Finally, Jeans theorem implies F(z, vz) = F(Ez) where Ez = vz2/2 + Φ(R0, z) - Φ(R0, 0).
Formally, each star in the sample may be viewed as a δ-function in z and vz and therefore the data provide an estimate of F, which, in principle, may be used to infer Φ. In general restrictive assumptions are required to extract Φ. For example, the distribution may be assumed to be isothermal so that F ∝ exp(-Ez / σz2) where σz is the vertical velocity dispersion. One then finds Φ(z) = ln(ν(z) / ν(0)) where ν(z) = ∫ Fdvz is the density run for the tracers. Variations of this method have been used by Oort (1932), Bahcall (1984), and Holmberg & Flynn (2000).
Kuijken & Gilmore (1989) proposed an alternative method which does not rely on the assumption of isothermality. The DF is related to the density and potential through an Abel transform:
 |
(22) |
In order to use this equation, Kuijken & Gilmore make an ansatz for the form of Φ. For each choice of potential, they calculate F and then compare the velocity distribution of the model to that of the data. The best-fit over the space of potentials leads to an estimate for Φ. In principle, the local density may be determined from Φ through the Poisson equation. The difficulty is that one requires second derivatives of the potential. An alternative is to determine the local surface density, which is (approximately) proportional to the force. The dark matter distribution can then be assumed to be approximately constant close to the Galactic plane (i.e., dark matter is distributed in a halo and not a disk (but see Read et al. 2008 for an alternative viewpoint.)
Recently, Moni Bidin et al. (2012) argued that there is little or no dark matter in the solar neighborhood. Their analysis is based on an analysis of some 400 red giant branch stars found in the Two Micron All Sky Survey (Skrutskie et al. 2006). The stars in their sample lie in the direction of the South Galactic pole between 1.5 and 4.0 kpc from the Galactic midplane and are presumably mainly from the thick disk. Their analysis is based on the Poisson and Jeans equations under the assumptions that the stars in the solar neighborhood are in equilibrium and that the Galaxy has azimuthal symmetry. With these assumptions, the integrated surface density within a distance z of the Galactic midplane is
 |
(23) |
where FR and Fz are the radial and vertical components of the force, respectively. They then use Jeans equation to write these components in terms of radial and vertical derivatives of the components of the velocity dispersion tensor and the density. While z-derivatives are estimated from the data, the data are too sparse to provide information about the radial derivatives. Rather, the authors assume that all second moments of the velocity dispersion tensor scale as exp(-R / h) where h is the radial disk scale length for the surface density. Furthermore, they assume that the rotation curve is locally flat for all z.
With these assumptions, Moni Bidin et al. (2012) found that Σ(z = 1.5 kpc) ≃ 55 M⊙ pc-2 and is very nearly flat between 1.5 and 4.0 kpc. In fact, their Σ(z) curve is well-fit by the curve for visible mass. By contrast, the standard disk-halo model for the solar neighborhood has Σ(z = 1.5 kpc)≃ 75 M ⊙ pc-2 and rises to ~ 100 M⊙ pc-2 by z = 4 kpc. Moni Bidin et al. (2012) therefore conclude that there is little room for dark matter in the solar neighborhood.
These results have been called into question by Bovy & Tremaine (2012) who point out that while the circular speed (= √-RFR) may indeed be locally flat near the midplane, the mean velocity exhibits a significant lag with respect to the local standard of rest due to asymmetric drift. When this effect is taken into account, the data imply a local dark-matter density of 0.008 ± 0.002 M⊙ pc-3, a result that is consistent with the values shown in Table 1. As well Garbari et al. (2012) have analysed kinematic data for 2000 K dwarfs using a method that is also based on the Poisson-Jeans equations and found a relatively high value for the local dark matter density (ρDM,⊙ = 0.022-0.013+0.015 M⊙ pc-3.
Virtually all approaches to the Oort problem rely on the assumption that the stars in the solar neighborhood are in dynamical equilibrium. Widrow et al. (2012) found evidence that the disk near the Sun has been perturbed. The results are based on their analysis of solar neighborhood stars from SDSS (Data Release 8; Aihara et al. 2011) and the SEGUE spectroscopic survey (Yanny et al. 2009). The evidence comes in the form of an asymmetry between the number density north and south of the Galactic midplane. The asymmetry function (difference between the number density to the North minus the number density to the South divided by the average) has the appearance of a wavelike perturbation. In addition, there appears to a gradual trend in the bulk velocity across the Galactic midplane. This result has also been observed in the RAVE survey (Williams et al. 2013). The perturbations are fairly small (10% or less in the density) and therefore the uncertainty in the surface density due to this effect is likely less than current observational uncertainties. Nevertheless, as the observational situation improves, it may become important to account for departures from equilibrium. In any case, the Widrow et al. (2012) result may well represent a new window into the interaction between the disk and halo. In particular, such perturbations may have arisen from a passing satellite or dark matter subhalo (Widrow et al. 2012; Gómez et al. 2013).
A second issue concerns the assumption that Ez is an integral of motion, at least to a good approximation. Statler (1989) has stressed that, for |z| > 1 kpc, the approximation breaks down and has proposed the use of Stäckel potentials, which admit three exact integrals of motion. Unfortunately, the Stäckel potentials are a fairly restricted set and, to date, no realistic disk-bulge-halo model has yet used them.
The future for mass modelling of the Milky Way is undoubtedly promising with the anticipated explosion of data from observational programs such as Gaia (Perryman et al. 2001; Wilkinson et al. 2005) and LSST (Ivezic et al. 2008). Gaia will yield distances and proper motions for about one billion Milky Way stars to its faint limit of V ~ 20 mag and also provide radial velocities for about 150 million stars as faint as V~16 mag. LSST has expected uncertainties in parallax and proper motions that are well matched to those expected for the faintest Gaia stars and will provide meaningful measurements down to r ~ 24 mag. We can therefore expect direct parallax distances with accuracies better than 10% for turn-off stars to ~ 1 kpc and for bright RGB stars to ~ 10 kpc. Parallax distance accuracies of 10 km s-1 will be achieved for transverse velocities out to 10 kpc; similar accuracies for larger distances will require other (photometric) distance estimates to be folded in. Astronomers will then have an unprecedented description of the phase space distribution function for the stellar component of the Galaxy. Major achievable science goals with these data include the discovery of stellar streams from tidally disrupted satellites and new constraints on the local distribution of dark matter. Current Milky Way models may lack the richness and sophistication worthy of the data; several groups have indeed begun laying the groundwork for accurate Milky Way mass models in the era of Gaia and LSST (Binney 2010b; Sharma et al. 2011; An et al. 2012; McMillan & Binney 2013; Magorrian 2013, and the many articles in these proceedings).
7 Ostriker & Peebles (1973) suggested that a dark matter halo also could stabilize the disk against bar formation, but more modern simulations, including a live halo whose resonances are adequately described, have shown that the halo has a more complex role. During the bar formation phase, a more massive halo slows down the bar formation, but in the later, secular evolution phases, the halo actually helps the bar grow stronger by absorbing a considerable part of the angular momentum emitted by the bar region Athanassoula (2002); Athanassoula (2003). See also Section 3.4.4. Back.