


Despite being a fundamental parameter required to test galaxy formation models (White & Rees 1978; Blumenthal et al. 1984), the measurement of galaxy masses with few percent accuracy on any scale is notoriously difficult. This is particularly the case for early-type galaxies (ETGs) which are not rotationally supported and generally lack gas-dynamical tracers. As we have seen in previous sections, a wide range of methods, or their combinations, have been employed to measure galaxy total masses on very different scales: e.g. stellar and gas dynamics, hydrostatic equilibrium of X-ray emitting gas and weak gravitational lensing. Whereas each of these methodologies have their own advantages and limitations, they also all have varying levels of precision and varying scales within which a mass can be measured.
In general, however, none of these methods reach the percent-level precision which is often required to accurately measure, for instance, the contribution of dark matter to the inner regions of galaxies where both baryons and dark matter interact and possibly play equal partners in galaxy formation models (e.g. Saglia et al. 1992; Bertin et al. 1992; Loewenstein & White 1999; Keeton 2001; Padmanabhan et al. 2004). In addition to degeneracies, some methods also become problematic beyond the local universe considering the limited signal-to-noise ratio of observations with present-day telescopes.
In this section, we focus on strong gravitational lensing (plus stellar dynamics) as a probe of the mass of galaxies out to tens of kpc scales, covering their inner regions to several effective radii (and beyond in combination with weak lensing). In addition, we shortly discuss the use of gravitational lensing to quantify the level of mass substructure in the dark matter haloes (e.g. CDM substructure or dwarf satellites). The basics of strong lensing theory and the ability to measure galaxy masses to percent level accuracy on different scales are shortly introduced. This is exemplified with several recent highlights, mostly based on the largest strong lensing survey to date: the Sloan Lens ACS (SLACS) Survey (Bolton et al. 2006a). This section is neither complete nor unbiased and we refer to Schneider (2006a) or Treu (2010) for more thorough theoretical and observational overviews.
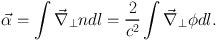
Strong gravitational lensing can, to very good approximation, be regarded as geometric optics in curved space-time (Schneider et al. 1992; Kochanek 2006), with the usual conservation of surface brightness. We can also assume in nearly all astrophysical circumstances that the gravitational field that causes lensing (weak or strong) satisfies |φ| / c2 ≪ 1 and that perturbations from the FRW metric of the Universe are small. As in geometric optics, curved space-time can heuristically be associated with a refractive index n = 1 + 2 |φ| / c2 for each point in space. A change in refractive index leads to a deflection of the light-ray by
 |
(54) |
Hence an observer sees the light ray from a different direction than where it originated. In summary, two parallel rays of light (or wavefronts; Kayser & Refsdal 1983) originating from slightly different positions will in general not remain parallel and can either diverge or converge. Similarly, rays of light being emitted in different directions from a single source can sometimes end up crossing each other again. If an observer (e.g. on Earth) happens to be at that crossing point, the emitting source will be seen multiple times. The deflection can be used to learn more about the mass distribution of the deflector (e.g. galaxy, cluster, stars, etc). It is worth noting that the concepts of time-delay and deflection can be unified in the generalization of the concept of "Fermat's principle" (Schneider 1985; Blandford & Narayan 1986), where lensed images form on extrema of a so-called time-delay surface.
7.2.1. The Thin-Lens Approximation
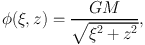
Before coming up with a general equation for (strong) lensing, we illustrate some of these aspects in case of a point-mass (e.g. a star or stellar remnant) with gravitational potential
 |
(55) |
where ξ and z are the distances perpendicular and parallel
to the line-of-sight from the point mass to the observer, respectively,
and G and M are the gravitational constant and mass of the
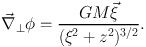
lens. One finds (note that ξ2 =
 ·
and then
the gradient is carried out w.r.t.
):
·
and then
the gradient is carried out w.r.t.
):
 |
(56) |
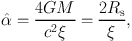
Integrating this along the l.o.s., assuming z goes from minus to plus infinity, the deflection angle for a point mass is
 |
(57) |
where Rs = 2 G M / c2 is the Schwarzschild radius. In general the impact parameter b ≫ Rs, hence the deflection angles are far smaller than unity (weak deflection), justifying the approximations that were made so far.
We now also note that in general the distance Δ z over which
light is substantially deflected is much smaller than the distance of
the lensed source of light to the deflector and the deflector to the
source. In that case, we can approximate any extended lens by the
"thin lens approximation", where the density distribution (ρ)
is collapsed along the line of sight in to a surface density
Σ() =
∫
ρ(,
z) dz. The latter is often
the only mass-related quantity that can be determined. Deflection is
assumed to occur (effectively) instantaneously in the lens plane of
the deflector. The thin lens approximation is practically always
justified for describing the main deflector. However, whenever very
high accuracy is required it should be kept in mind that the universe
is not exactly homogeneous and isotropic on large scales and therefore
describing the intervening space between the source and the deflector
and between the deflector and the observer with a standard
Robertson-Walker metric is only an approximation. In reality, photons
will propagate through over and under-densities, resulting effectively
in additional distortion (shear) and focus/defocus in addition to the
one provided by the main deflector (see
Section 6). This effect is
usually accounted for as external shear and convergence and result
in typical corrections of order a few percent to the strong lensing
inference (e.g.
Keeton et al. 1997;
Treu et al. 2009;
Suyu et al. 2010;
2013).
Extending now from the point-source deflector to a general (surface) mass
distribution, using M →
Σ()
d2
, one readily
finds that
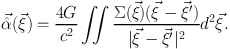 |
(58) |
For circularly symmetric lenses with ξ =
|| we have
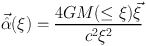 |
(59) |
with
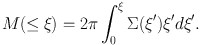 |
(60) |
We are now ready to introduce the lens equation which forms the basis of lensing theory.
Now that the deflection for any general and circularly symmetric mass
distribution can be calculated, we can relate any point in plane (at
a distance Ds) where the emitting source is, to a point at
 =
/
Dd in
the plane of the deflector (at a distance Dd) as seen
by the observer. We also assume that the distance from the deflector to
the source is Dds, which in GR is not necessarily
equal to Ds - Dd.
In that case (Figure 22), we readily find in
scalar notation θ Ds = β
Ds + α Dds, assuming the
small-angle approximation, or equivalently
=
/
Dd in
the plane of the deflector (at a distance Dd) as seen
by the observer. We also assume that the distance from the deflector to
the source is Dds, which in GR is not necessarily
equal to Ds - Dd.
In that case (Figure 22), we readily find in
scalar notation θ Ds = β
Ds + α Dds, assuming the
small-angle approximation, or equivalently
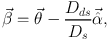 |
(61) |
where  is
the vector angle to the source as it would be seen
(w.r.t. some arbitrary coordinate origin, usually chosen to the deflector
centroid) if not lensed and
is the
vector angle
of the lensed image(s) as observed. Defining the reduced deflection angle
as
is
the vector angle to the source as it would be seen
(w.r.t. some arbitrary coordinate origin, usually chosen to the deflector
centroid) if not lensed and
is the
vector angle
of the lensed image(s) as observed. Defining the reduced deflection angle
as  ≡ Dds / Ds
, we arrive
at the standard non-linear lens equation
≡ Dds / Ds
, we arrive
at the standard non-linear lens equation
 |
(62) |
We note here that the non-linearity of
() can
lead to multiple solutions of
of the
lens equation for a given source position
, hence
multiple imaging (strong
lensing) occurs (note that this equation holds for each position of an
extended source and that image surface brightness for each solution
is
identical to that of the source at
.
The extreme case of multiple imaging is the creation of the
"Einstein Ring" for circularly symmetric lenses, for which
 |
(63) |
Defining the Einstein radius
 |
(64) |
the lens equation for β = 0 has the solution θ = ± θe. Because of symmetry, a source aligned with the source-deflector line will be imaged into a perfect Einstein ring.
We can take one more step to simplify the equations. We do this assuming the deflector has constant density (a "mass-sheet"). In that case
 |
(65) |
with Σcrit ≡ c2 Ds / (4 π G Dd Dds). We further define the so called "convergence" κ ≡ Σ / Σcrit. Hence, the deflection angle is linear and β = (1 - κ)θ. For κ = 1, parallel rays converge to a single focus, making the transition from κ < 1 to κ > 1 special. The mass-sheet with κ = 1 is a perfect focusing lens. Whereas this is not the case for general lenses, it turns out that lenses with κ>1 at any point, can (do not have to though) create multiple images because of over-focusing. With this definition the deflection angle becomes
 |
(66) |
It can be shown that the average convergence inside the Einstein radius of any circularly symmetric deflector is exactly equal to one. Thus for lens systems with a (near) Einstein ring, the mass inside the Einstein radius is Me ≡ π (Ddθe) Σcrit independent of the density profile of the deflector. In fact, deviations from symmetry are only secondary effects. Hence the masses of strong lenses can be determined to rather exquisite accuracy if a reasonable Einstein radius can be defined.
Whereas lens modeling can be rather complex, in general axisymmetric (in 2D) lenses give good insight into the processes that are important in lensing. This is because many lenses are ETGs, which generally have round mass distributions (and potential) with small ellipticities. It is therefore useful to derive some properties for these types of lenses, giving first-order results for other lenses as well.
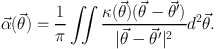
We thus assume κ(θ) =
κ(||)
and α(θ) =
|(||)|. It is then
easy to show that
 |
(67) |
with
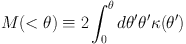 |
(68) |
and
 |
(69) |
align=justify Hence the deflection angle then reduces to
 |
(70) |
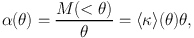
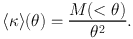
This immediately shows that for an Einstein ring with β=0, that ⟨ κ ⟩(θ) = 1. Hence for any axisymmetric lens the average convergence inside the Einstein radius is unity. The enclosed mass can thus be inferred independent of the density profile. In physical units
 |
(71) |
or conversely
 |
(72) |
Thence if the Einstein radius can be determined, the mass can be determined.
7.2.4. Lensing & Stellar Dynamics
A powerful complementary constraint that is worth mentioning at this point is the combination of the precise total mass measurement using strong gravitational lensing with stellar kinematic measurements. Whereas this combinations can becomes rather complex for two or three integral (non-spherical) models, here we illustrate the basic idea assuming spherical symmetry and power-law density and luminosity density models (Treu & Koopmans 2002a; Koopmans 2004; Bolton et al. 2006b). Despite these simplifications, these toy-models give rather robust results for the density slopes of ETGs.
Let us suppose that the stellar component has a luminosity density νl(r) = νl,o r-δ and is a trace component embedded in a total (i.e. luminous plus dark-matter) mass distribution with a density νρ(r) = νρ,o r-γ′. In addition, let us assume that the anisotropy of the stellar component β = 1 - (σ2θ / σ2r) is constant with radius. For a lens galaxy with a projected mass Me inside the Einstein radius Re, the luminosity weighted average line-of-sight velocity dispersion inside an aperture RA is given, after solving the spherical Jeans equations, by
 |
(73) |
with
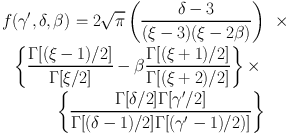 |
(74) (75) |
with ξ = γ′ + δ -2. Similarly,
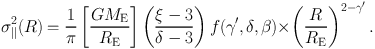 |
(76) |
In the simple case of a SIS with γ′ = δ = ξ = 2 and β = 0, we recover the well-known result
 |
(77) |
From Eq. (73), one sees that the radial dependence of the stellar velocity dispersion depends on γ′ only. All other parameters (i.e. δ, β, etc.) only enter into the normalization. Since the luminosity density (i.e. δ) and Me are measured with little uncertainty, the measurement of ⟨ σ||2⟩ (≤ RA ≠ Re) immediately gives the density slope γ′(β) (where β in general plays only a minor role). This is the basis of combining stellar dynamics with gravitational lensing to obtain not only the mass but also the density-slope of ETGs.
 |
Figure 22. A sub-sample of SLACS lenses (credit: Adam Bolton; see www.slacs.org) in false-color. Each panels shows the data on the left and a model of the system on the right. |
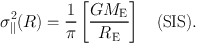
We can estimate the change δ γ′ from the observables. One finds to first order (assuming fixed values of β and δ):
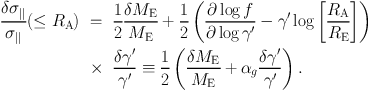 |
(78) |
The second term in this equation was already derived by Treu & Koopmans (2002a). If we further assume the errors on Me and σ|| to be independent,
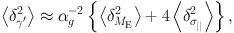 |
(79) |
where δ… indicate fractional errors. Since in general δMe≪ δσ||, one finds the simple rule of thumb that the error δγ′ ~ δσ|| for close-to-isothermal mass models, since αg ~ 2. This estimate is in very good agreement with the results from properly solving the Jeans equations for two-component mass models and justifies neglecting the mass errors (Treu & Koopmans 2004).
In this section we highlight some recent results on the study of early-type galaxies using strong gravitational lensing.
We focus on two aspects of strong gravitational lensing that have recently progressed rapidly and that we think have great promise in future galaxy structure and evolutions studies: (i) The combination of strong lensing, stellar kinematics and stellar populations to constrain the inner stellar and dark-matter mass profiles of ETGs as function of their mass and redshift and (ii) the use of simply-parameterized and grid-based modeling of strong lenses to constrain the level mass substructure in the inner regions of ETGs We illustrate how lensing can address these two science drivers based mostly on recent results from the Sloan Lens ACS Survey (SLACS).
7.3.1. Sloan Lens ACS Survey (SLACS)
The SLACS gravitational lenses (Bolton et al. 2006a; Treu et al. 2006; Koopmans et al. 2006; Gavazzi et al. 2007; Bolton et al. 2008a; Gavazzi et al. 2008; Bolton et al. 2008b; Auger et al. 2009; Treu et al. 2009; Auger et al. 2010a; Newton et al. 2011) were selected from the spectroscopic database of the SDSS based on the presence of absorption-dominated galaxy continuum at one redshift and nebular emission lines (Balmer series, [Oii] 3727, or [Oiii] 5007) at a higher redshift. The spectroscopic lens survey technique was first envisioned by Warren et al. (1998); Hewett et al. (2000) following the serendipitous discovery of the gravitational lens 0047-2808 through the presence of high-redshift Lyman-α emission in the spectrum of the targeted lower redshift elliptical galaxy. Further details of the SLACS approach are provided in Bolton et al. (2005; 2004). The SLACS Survey includes candidates from the SDSS MAIN galaxy sample (Strauss et al. 2002) in addition to candidates from the SDSS luminous red galaxy (LRG) sample (Eisenstein et al. 2001). Most candidates were selected on the basis of multiple emission lines, though several lens candidates were observed on the basis of secure [OII] 3727 line detections alone. By virtue of this spectroscopic selection method, all SLACS lenses and lens candidates have secure foreground ("lens") and background ("source") redshifts from the outset. Accurate redshifts such as these are essential for most quantitative scientific applications of strong lensing, as they are required to convert angles into physical lengths.
7.3.2. The Density Profiles of Early-Type Galaxies (ETGs)
When combining the total mass inside the Einstein radius given by detailed lensing modeling, usually accurate to a few percent (Kochanek 1991), with measurements of stellar kinematics (either inside an aperture, along a slit or through 2D IFU measurement), a powerful constraint can be set on the average (kinematically weighted) density profile of ETGs inside the Einstein radius (or effective radius which ever is larger). This methodology, shortly outlined in the previous section, has been successfully applied initially by the Lenses Structure & Dynamics (LSD) survey (e.g. Koopmans & Treu 2002; Treu & Koopmans 2002a; Treu & Koopmans 2002b; Koopmans & Treu 2003; Treu & Koopmans 2004) and more recently by the SLACS survey, the BELLS Survey (Bolton et al. 2012; Brownstein et al. 2012), the SL2S Survey (Ruff et al. 2011; Gavazzi et al. 2012), and the SWELLS Survey (Treu et al. 2011) for the case of spiral deflectors. Whereas the quality of the kinematic profiles in general can not compete with that obtained for local ETGs (Section 5), the combination of these data with strong lensing at higher redshifts has several major advantages.
First, even "low quality" lensing information combined with a single measurement of the stellar velocity dispersion can often be obtained out to z ~ 1 without major telescope investment. This allows their inner mass profiles to be determined even at half the age of the Universe. Hence, evolution (in the ensemble average properties) of ETGs can be studied (e.g. Ruff et al. 2011; Bolton et al. 2012). Second, the additional use of strong lensing masses (plus constraints on its density slope near the Einstein radius) helps break the mass-sheet and mass-anisotropy degeneracies.
The results of the SLACS survey based on the combination of lensing and kinematic constraints for ~ 60 ETGs lenses are described in a number of papers (Koopmans et al. 2006; Czoske et al. 2008; Koopmans et al. 2009; Barnabè et al. 2009; Barnabè et al. 2010; Auger et al. 2010b). Regarding the total mass density profile, Koopmans et al. (2009) and Auger et al. (2010b) found that inside one effective radius massive elliptical galaxies with Meff ≥ 3· 1010 M⊙ are well-approximated by a power-law ellipsoid with an average logarithmic density slope of ⟨ γ′LD ⟩ ≡ -dlog(ρtot) / dlog(r)=2.078 ± 0.027 (random error on mean) with an intrinsic scatter of 0.16 ± 0.02 (for isotropic orbits; results change as shown in Figure 23 for reasonable amounts of anisotropy). Whereas this result is based on a separate analysis of the lensing and stellar kinematics and assumes spherical symmetry (or simple scaling relations), it has been confirmed by more sophisticated joint and self consistent lensing and dynamical analysis methods based on axisymmetric mass distributions and two integral Schwarzschild modeling of the full lensing data and two dimensional velocity fields (Czoske et al. 2008; Barnabè et al. 2009). Based on a subset of 16 lens ETGs with deep integral field spectroscopy Barnabè et al. (2011) find ⟨ γ′⟩> = 2.074-0.041+0.043 with an intrinsic scatter of 0.143-0.014+0.054. Overall the internal structure of the SLACS ETGs at z = 0.1-0.4 is found to be perfectly consistent with that found for their nearby counterparts, as described in Section 5 of this review.
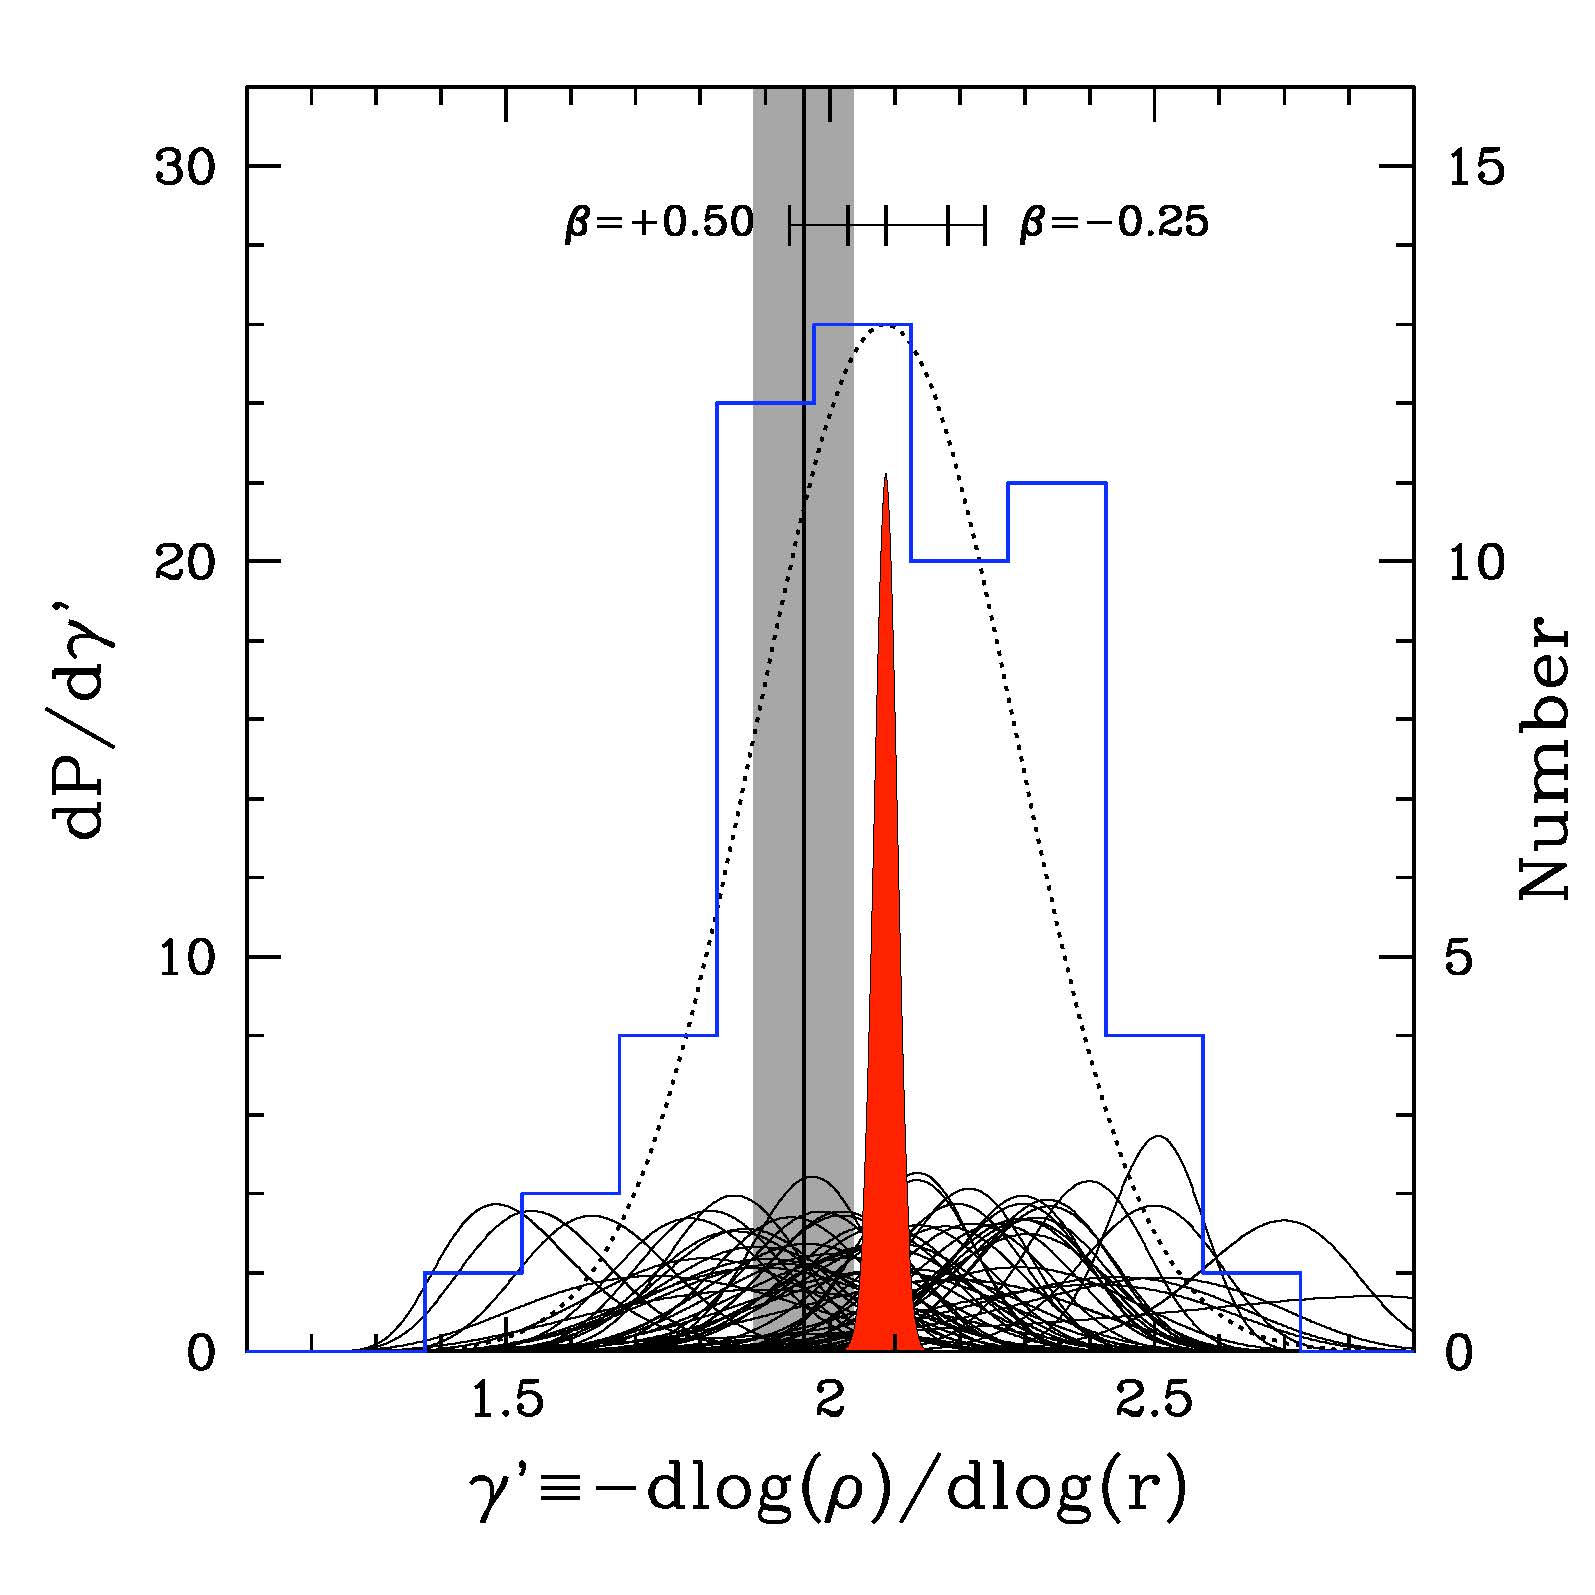 |
Figure 23. The logarithmic density slopes of 58 SLACS early-type galaxies (thin solid curves). The filled red curve is the joint posterior probability distribution of the average density slope of the sample. The histogram indicates the distribution of median values of the density slopes. The dotted Gaussian curve indicates the intrinsic scatter in γ ′LD (see text). We assume a Hernquist luminosity-density profile and no anisotropy (i.e. βr = 0). The small dashes indicate the shift in average density slope for βr = +0.50, +0.25, -0.50 -0.25 (left to right), respectively. Note the reversal of the βr = -0.50 and -0.25 dashes. The vertical solid line and gray region indicates the best-fit value and 68% CL interval, respectively, of the average density derived from scaling relations. |
The addition of weak gravitational lensing data to the strong lensing and dynamics analysis allows one to extend the measurement of the total mass density profile well beyond the effective radii in an ensemble sense. With exquisite HST data, the weak lensing signal is measurable for sample of just a few tens of ETGs in the redshift range z = 0.1-0.8 (Gavazzi et al. 2007; Lagattuta et al. 2010; Auger et al. 2010b). The two main results of the combined weak, strong and dynamics analyses are that SLACS lenses have average virial mass ~ 2 · 1013 M⊙ and that their total mass density profile is well described by a single isothermal sphere γ′ ≈ 2 out to ~ 100 effective radii. This result is remarkable because neither the stellar component nor the dark matter halo are well described by single power laws, and yet their sum is. This total mass profile is well reproduced by the combination of a stellar component and a standard NFW halo (Gavazzi et al. 2007) for sensible values of stellar mass to light ratio. This is very different with what is found at higher and lower masses (clusters and dwarfs) where typically a single isothermal sphere is not a good description of the total mass density profile. The simplicity of the total mass density profiles of ETGs has been sometimes called the "bulge-halo" conspiracy (Dutton & Treu 2013), and it provides important constraints on theoretical models of ETGs formation, especially on parameters that drive the star formation efficiency like supernovae and nuclear feedback (Remus et al. 2013; Dubois et al. 2013).
The conclusion that can be drawn from these analyses is that ETGs on average have density profiles that are close to isothermal. However, one needs to keep in mind that there is an intrinsic scatter of ~ 10% in the logarithmic density slope between galaxies (i.e. they do not all have similar density profiles), which could be due to their formation history. This intrinsic scatter is comparable to studies of nearby galaxies (e.g. Gerhard et al. 2001) based on stellar kinematics alone. The only dependence on third parameters identified so far is that between the slope and the stellar mass density inside the effective radius, where higher stellar mass-density ETGs have steeper density slopes (Dutton & Treu 2013). This tantalizing result is confirmed by the self-consistent axisymmetric modeling technique (Barnabè & Koopmans 2007; Barnabè et al. 2012), and proves that ETGs are at least a two parameter family even when it comes to their internal mass structure.
7.3.3. The Stellar IMF and Dark Matter Fraction in ETGs
Strong lensing can constrain the mass inside the Einstein radius very accurately. In combination with the luminosity inside the Einstein radius this yields a firm upper limit on the stellar mass-to-light ratio inside that radius (e.g. Brewer et al. 2012). As discussed in Chapter 2, given an optical infrared spectral energy distribution, modern stellar population synthesis models are believed to provide estimates of the stellar mass to light ratio that are accurate to within roughly for old stellar populations like the one found in massive ETGs. In this case, the main source of uncertainty is the shape of the stellar initial mass function, which is needed to convert the observed luminosity - dominated by a small range of stellar masses - to the total mass in stars and stellar remnants. Thus, by combining gravitational lensing, stellar kinematics and stellar population synthesis modeling, powerful new constraints can be set on the stellar IMF and the fraction of dark matter in the inner regions of ETGs. By means of additional information, like spatially resolved kinematics and/or simple assumptions on the functional form of the dark matter density profile, one can break in part the degeneracy between the stellar IMF and the dark matter fraction and derive very realistic limits on the either one (e.g. Treu & Koopmans 2004, for limits on the dark matter fraction inside the Einstein Radius out to z ~ 1).
Treu et al. (2010) studied the stellar initial mass function of ETGs by comparing the stellar mass fraction inside one effective radius determined solely from lensing and stellar dynamics with that inferred from stellar population synthesis models. Whereas these limits are rather weak on a system-to-system basis, the combination of 56 SLACS ETGs allows a rather detailed comparison. The main result is that bottom-heavy IMFs such as that measured by Salpeter (1955) are strongly preferred over light-weight IMFs such as that proposed by Chabrier (2003), assuming standard NFW dark matter density profiles. This result is further strengthened by Auger et al. (2010b) who modeled these systems in detail, including adiabatic contraction and weak-lensing constraints, and found that only heavy Salpeter-type IMF are consistent with the observed properties of ETGs. In combination with standard results based on spiral galaxy rotation curves (see Section 3) and dynamical measurements of early-type galaxies (see Section 5), these results indicated the stellar initial mass function cannot be universal.
The lensing and kinematic studies by themselves (Treu et al. 2010) also suggest that the IMF normalization varies with galaxy mass Figure 24 within the sample of SLACS lenses, if NFW halos are allowed. However, the mass dependency within the SLACS sample becomes insignificant if the halos are allowed to contract in response to baryonic physics (Auger et al. 2010b).
 |
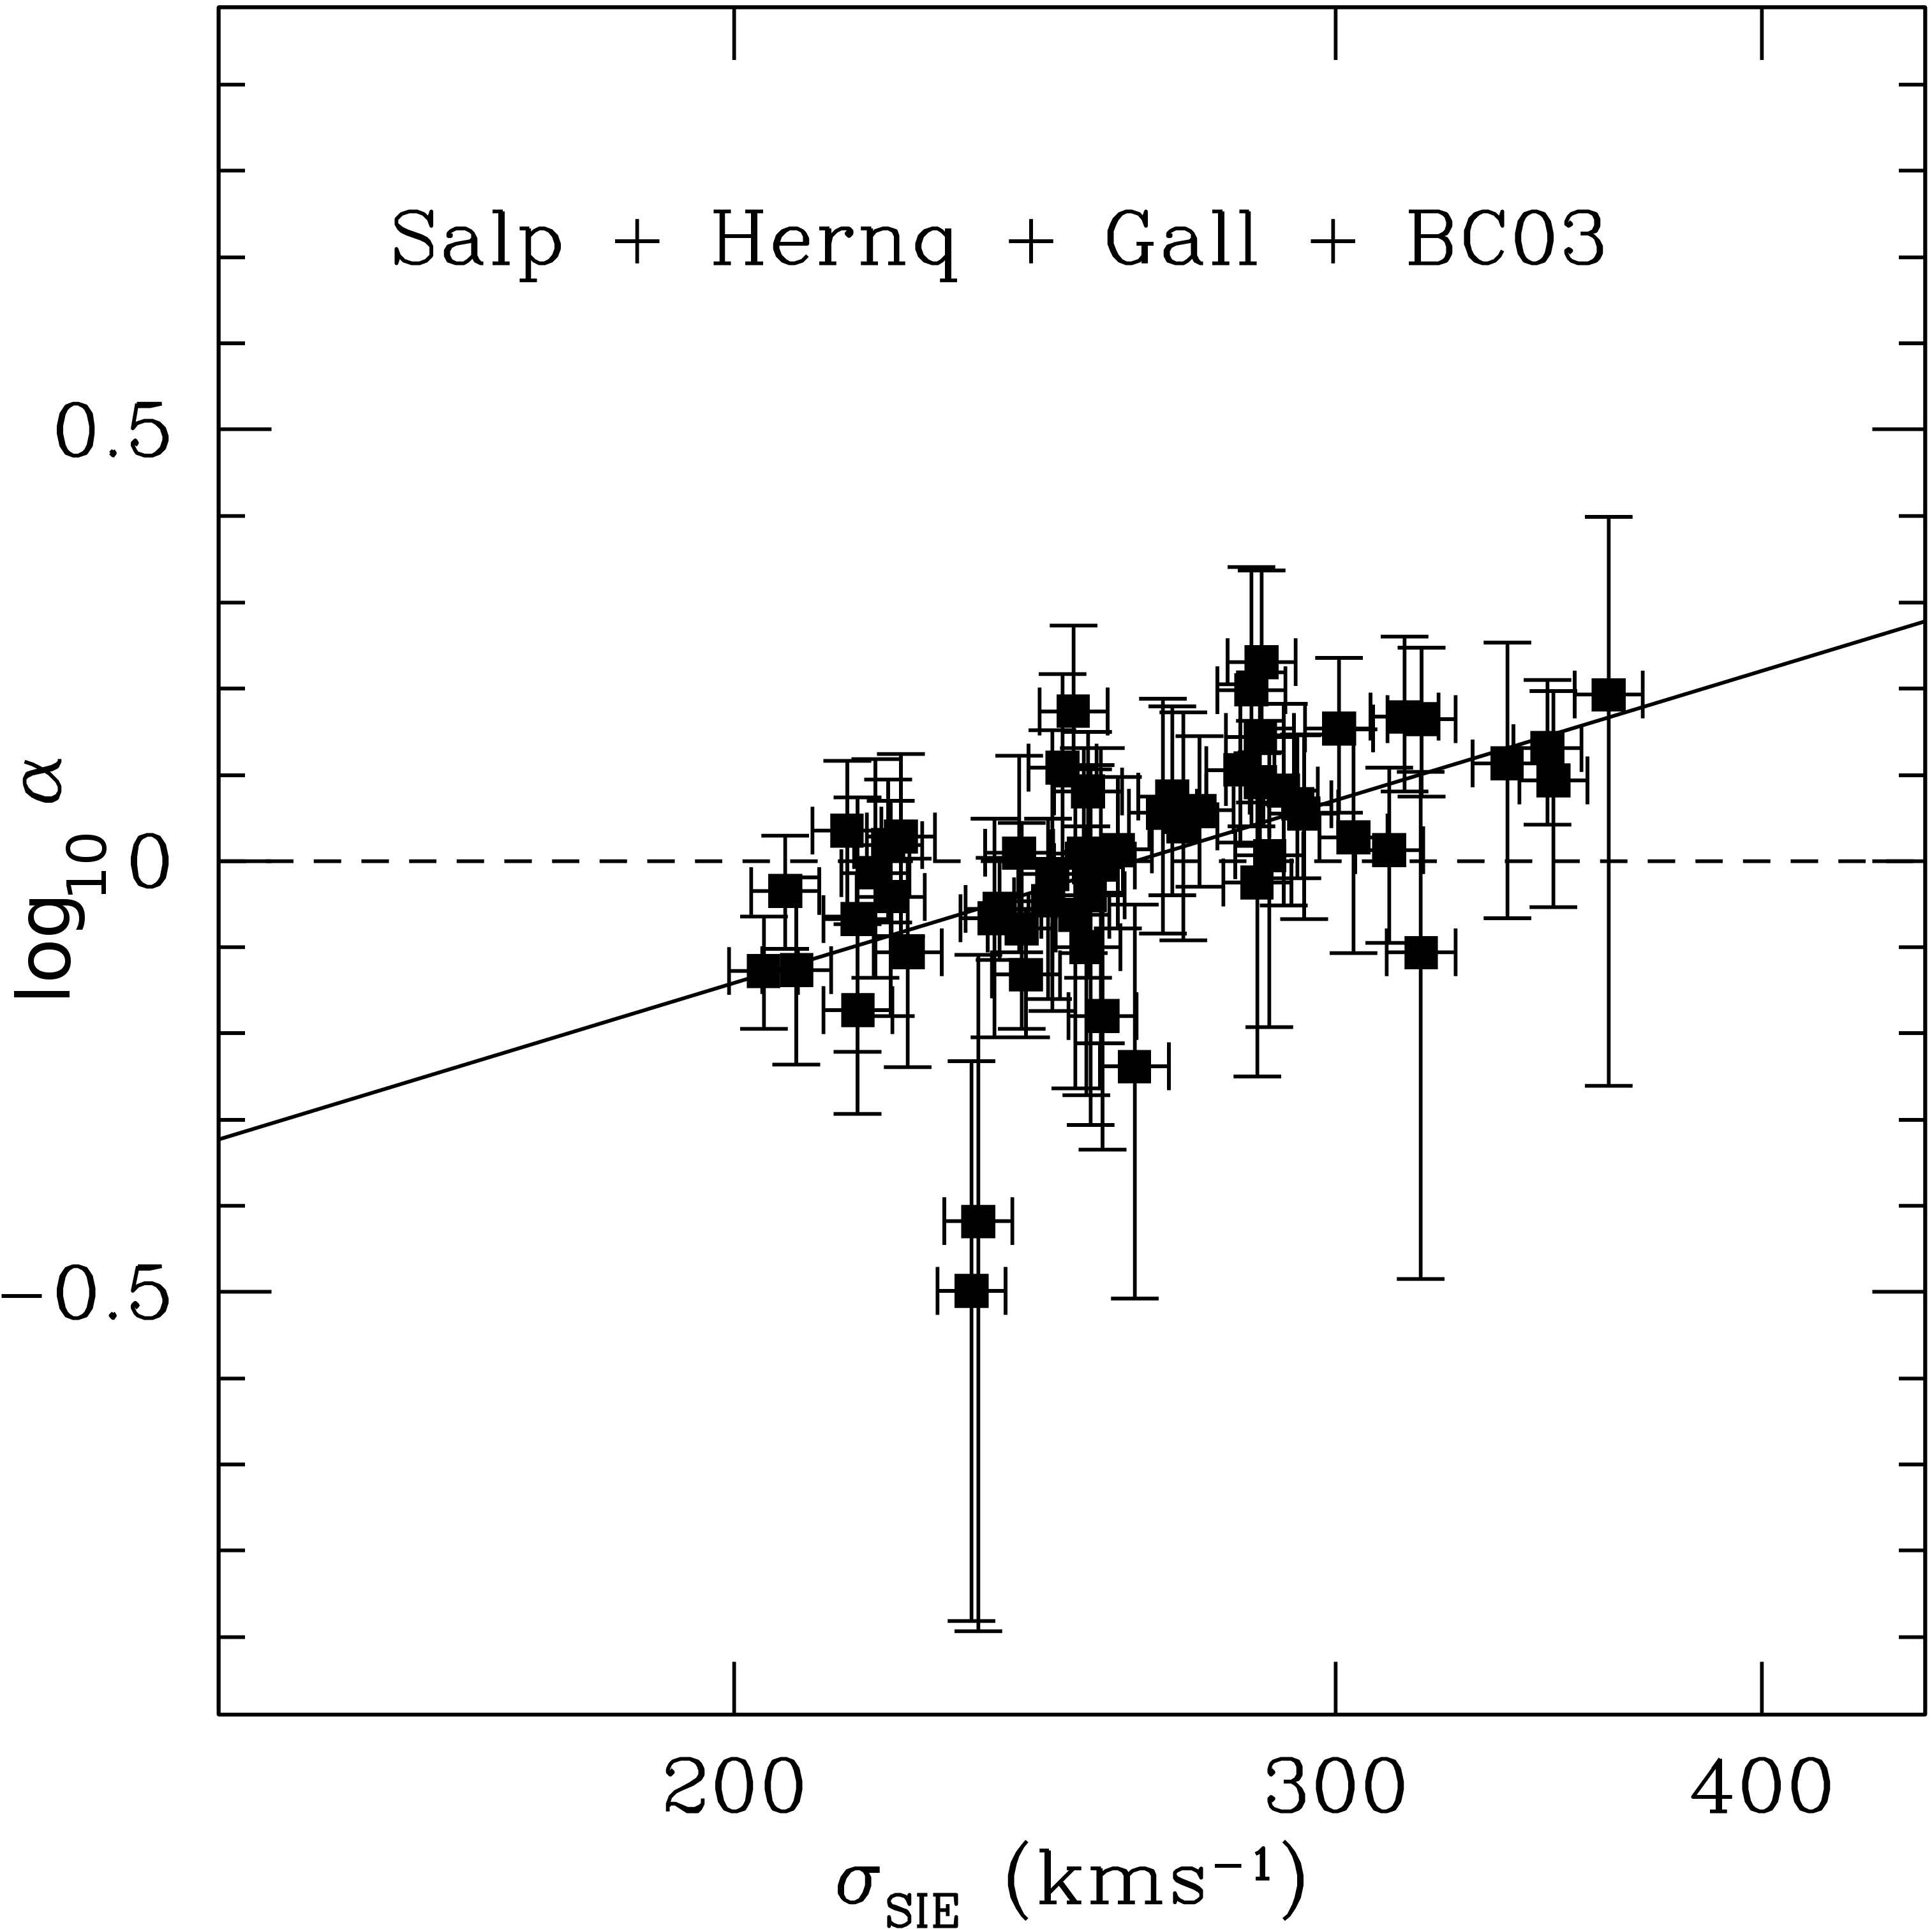 |
Figure 24. Top figure: Comparison between stellar mass in the cylinder of radius equal to the Einstein Radius as inferred from lensing and dynamical models (x-axis) and that inferred from fitting stellar populations synthesis models to the observed spectral energy distribution (y-axis). The solid line indicates the identity. Stellar populations synthesis models by Bruzual & Charlot (2003) are assumed together with an informative metallicity prior (Gallazzi et al. 2005). Bottom figure: Template mismatch parameter α ≡ M*,EinLD / M*,EinSPS for Salpeter IMF as a function of lensing velocity dispersion (left), stellar velocity dispersion (center) and V-band luminosity corrected to z = 0.2. A tentative positive trend with velocity dispersion is observed (solid line). The dashed line represents the trend expected for a universal Salpeter IMF. |
Several subsequent studies, discussed elsewhere in his review, also point toward non-universal IMFs using independent techniques. For example, based on detailed modeling of weak stellar absorption features van Dokkum & Conroy (2010), confirmed the lensing result that the IMF of massive early-type galaxies are inconsistent with Chabrier. In addition, they provide the crucial suggestion that the extra mass is to be attributed to low mass stars, with overall IMF shape similar to Salpeter's. Detailed stellar dynamical modeling of spatially resolved velocity fields of ETGs also adds important information. First, it provides an independent confirmation of the initial lensing results that Chabrier-like IMFs are disfavored for massive ETGs. Second, the local galaxy samples cover a large enough range in stellar mass to detect a trend in stellar mass-to-light normalization within ETGs themselves, assuming the inner mass density profiles of their dark matter halos can be modelled as power laws which are allowed to vary within a fixed range across the sample (Cappellari et al. 2012; 2013a).
Overall there is good agreement between the dynamical, lensing and stellar population probes (Dutton et al. 2013). Given its broad implications, it is reassuring that many independent lines of evidence (e.g. Zaritsky et al. 2012) contradict the simple hypothesis of a universal IMF, which has been a central tenet of extragalactic astronomy for the few past decades. Much work is currently under way to determine the exact form of the IMF, clarify systematic uncertainties, and investigate possible variations with morphology or other parameters (e.g. Dutton et al. 2012; Conroy & van Dokkum 2012; Conroy et al. 2013; Sonnenfeld et al. 2012; Spiniello et al. 2011; 2012; 2013; Smith & Lucey 2013; Ferreras et al. 2013; Goudfrooij & Kruijssen 2013, and elsewhere in this review).
7.3.4. Mass Substructure in ETGs
Whereas the results described above are concerned with the smooth mass distributions of ETGs, gravitational lensing can also measure the level of mass-density fluctuations, and in particular on the amount of substructure in their inner regions. Thus, gravitational lensing provides an opportunity to measure directly the mass function of subhalos, irrespective of their stellar content. This is a stringent test of the nature of dark matter, since cold dark matter predicts that the subhalo mass function should go as dN / nM ∝ M-1.9 down to very small masses (Springel et al. 2008).
The first lensing studies of this topic, based on the so-called flux-ratio anomalies (Mao & Schneider 1998; Metcalf & Madau 2001) of radio-loud lenses quasars from the CLASS survey (Dalal & Kochanek 2002) indicated a level of substructure broadly consistent with the expectations of CDM cosmology. In the following decade, much work has been devoted to understanding the systematic uncertainties associated with this method (e.g. Koopmans et al. 2003; Kochanek & Dalal 2004; Dobler & Keeton 2006; Shin & Evans 2008; Metcalf & Amara 2012), but overall progress has been limited mostly by the small number of known quadruply imaged radio loud quasars. Detailed comparisons with cosmological numerical simulations are challenging, owing to the need for high resolution and approximations related to the implementation of baryonic physics (e.g. Kochanek & Dalal 2004; Mao et al. 2004; Macciò et al. 2006; Xu et al. 2009; Xu et al. 2012). It also remains an open question whether some of these anomalies are caused by dark or luminous substructure (e.g. More et al. 2008; More et al. 2009; Jackson et al. 2010; Nierenberg et al. 2012).
To overcome some of the limitations of flux-ratio anomaly systems (e.g. the position and mass of the substructure are highly degenerate so only statistical constraints can really be placed currently), and exploit the large samples of galaxy-galaxy strong lens systems, Koopmans (2005) developed a new method based on the entire surface brightness distribution of the (extended) lens source. The information contained in thousands of pixels allows one to reconstruct the surface mass density of the deflector, pin-point the position of possible substructures, and determine their masses (see also Vegetti & Koopmans 2009 for a complete Bayesian extension of this method). Alternative methods have been developed by other groups to reconstruct on a grid the surface mass density of gravitational lenses, or their gravitational potential, albeit mostly with the goal of studying cosmology from gravitational time delays. The method developed by Suyu et al. (2009) is very similar in spirit to that of Vegetti & Koopmans (2009), while the one developed and applied by Saha et al. (2006) differs substantially. In the latter method the mass distribution is reconstructed on a grid using only multiple image positions as a constraints. Thus the amount of freedom in the models is substantially larger and the choice of geometric priors becomes more important. Putting this class of model into a statistical framework is challenging although efforts are underway (Coles 2008).
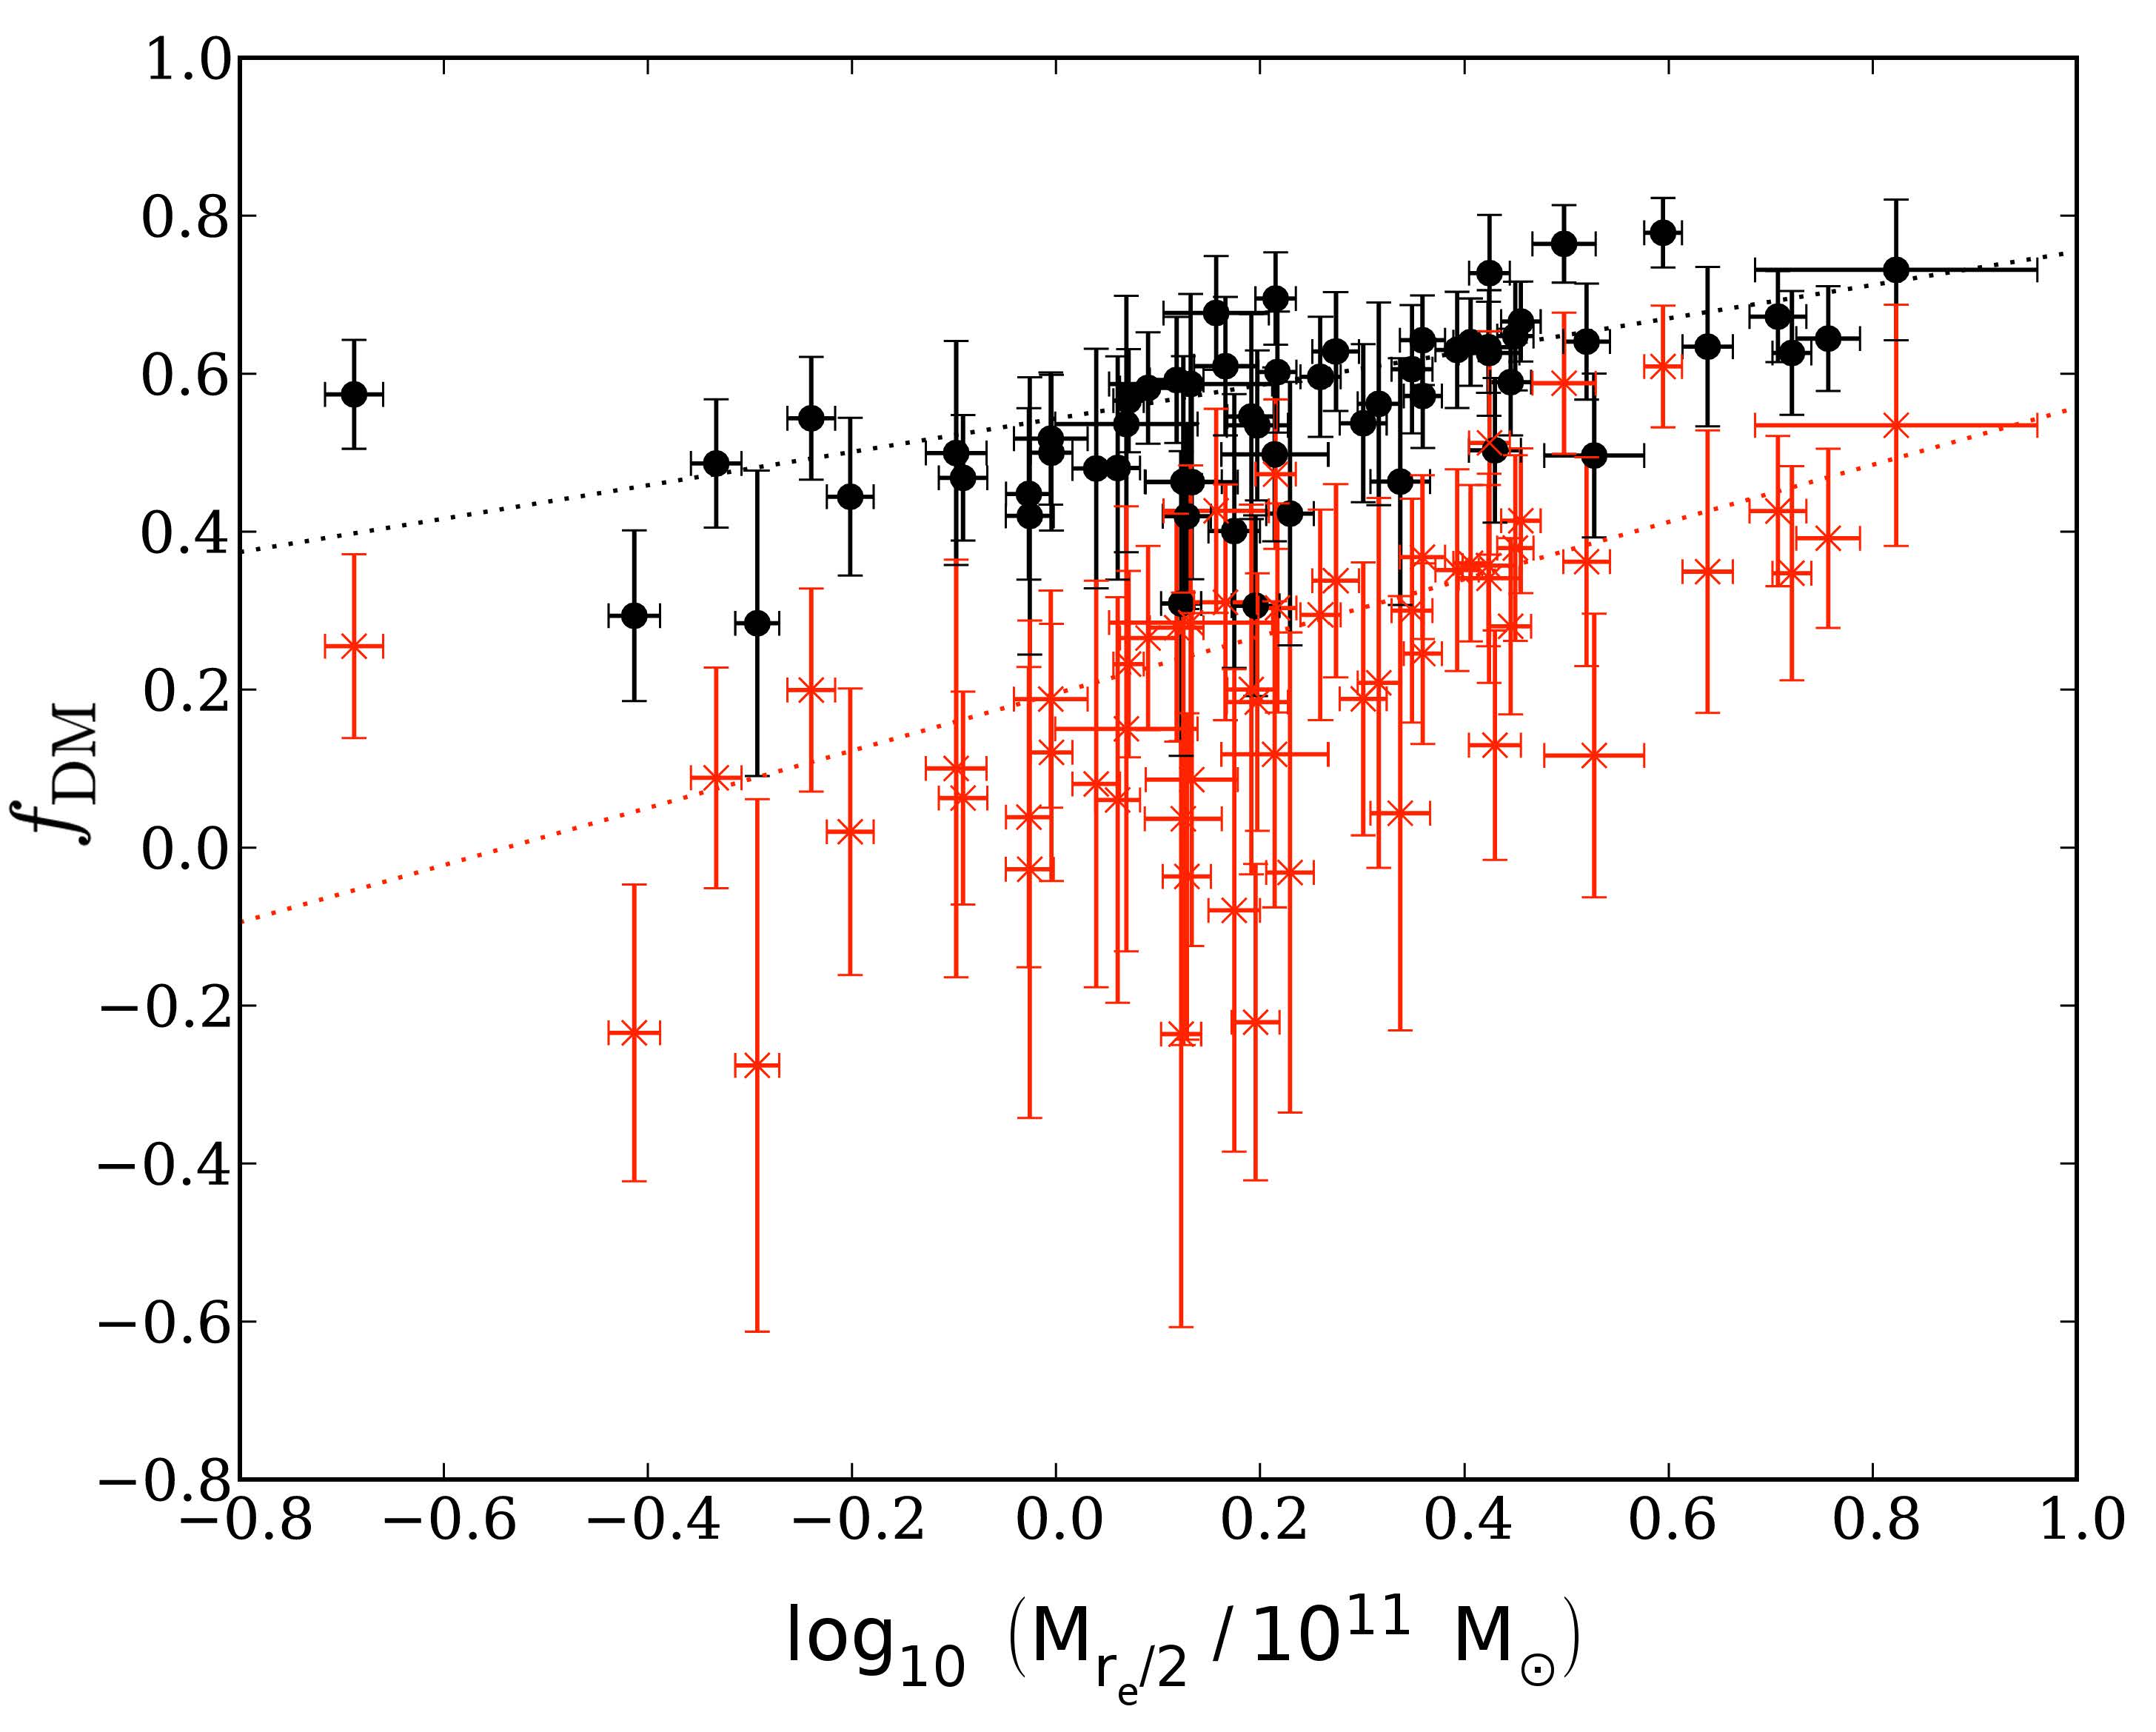 |
Figure 25. Relations between the projected dark matter fraction within half of the effective radius and M* / re. Red points are for a Salpeter IMF and black points are for a Chabrier IMF. |
7.3.5. Luminous Dwarf Galaxies
A nice demonstration of these methodologies is provided by known luminous substructures in gravitational lens systems. For example, the system shown in Figure 26 was discovered by Lin et al. (2009) and shows a bright arc with a dwarf galaxy (G4) splitting the giant arc on sun-arcsec scale. Whereas this anomaly of the arc is caused by the dwarf galaxy, similar anomalies could in principle also be caused by dark substructure and be used to reconstruct their mass and position. Not all such cases however are as obvious as this case. The best reconstruction of the lensed arcs is shown in Figure 27 (a galaxy surface brightness model has been subtracted) and a grid-based reconstruction of the potential and surface density (lower-right panel) has been constructed (e.g. Vegetti et al. 2010a). A high over-density is clearly visible at the position of the anomaly. Replacing this object by a tidally-truncated pseudo-Jaffe mass model, a mass of mass of Msub = (2.75 ± 0.04) × 1010 M⊙ inside its tidal radius of rt = 0.68 arcsec is found. This result is robust against changes in the lens model. The satellite luminosity is LB = (1.6 ± 0.8) × 109 L⊙, leading to a total mass-to-light ratio within the tidal radius of (M / L)B = (17.2 ± 8.5) M/L⊙ / L⊙. While this mass-to-light ratio is high compared to early-type dwarfs, it is also an upper limit since the extended emission is hard to measure due to the arc. Another demonstration of the power of this method is given by the analysis of the system SL2SJ08544-0121 by Suyu & Halkola (2010).
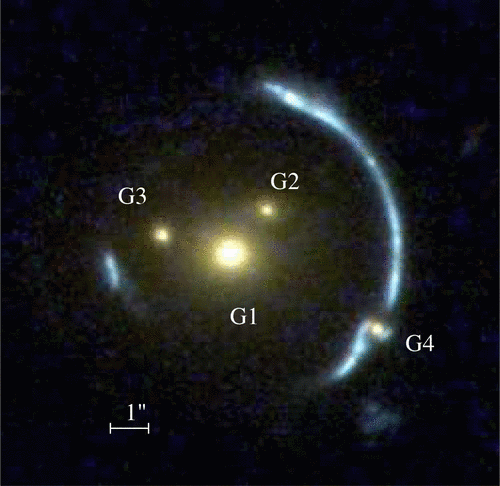 |
Figure 26. Overview of the lens system the "Clone". This false-colour image was created from HST/WFPC2 images through filters F450W, F606W and F814W. |
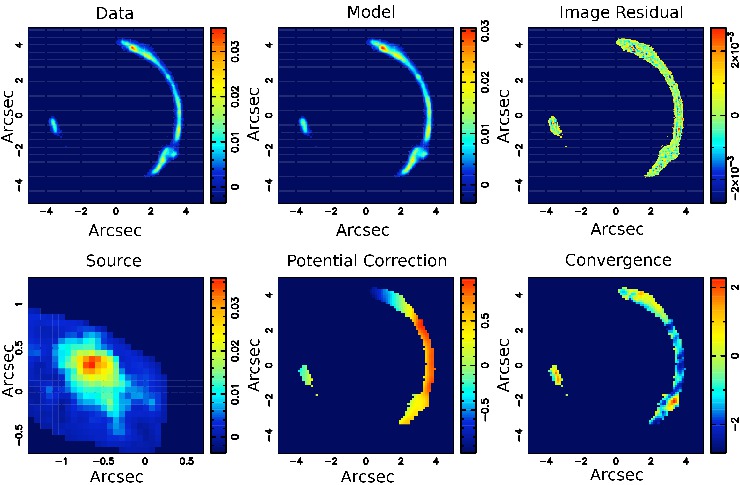 |
Figure 27. Illustration of pixelized reconstruction of the source surface brightness and lens potential corrections of the lens system shown in Figure 26 using the gravitational imaging technique. The top-left panel shows the data, consisting of the surface brightness of a highly distorted lensed source. The top-middle panel shows the model surface brightness, while the top-right one shows the image residuals (data-model). The bottom-left panel shows the source surface brightness distribution reconstructed in the source plane (i.e. after "delensing"; note the zoomed-in angular scale). The bottom-middle panel shows the corrections to the gravitational potential, with respect to a smooth simply parameterized mass distribution. The bottom-right panel shows the inferred convergence, i.e., the projected surface mass distribution. Note the peak at the lower right corner of the image corresponding to the satellite responsible for the curvature in the arc. |
The method is currently being applied to the SLACS lenses with the goal of quantifying the abundance of substructures independent of their luminosity. Two detections have been reported so far.
The first substructure detected via gravitational imaging is in the Jackpot system (Gavazzi et al. 2008), which shows two concentric rings of sources at two redshifts. The inner ring of this system, even though rather smooth, has a very high signal-to-noise ratio and is therefore quite suitable for the grid-based analysis method.
A simply-parameterized elliptical power-law density model plus external shear provides a good fit to the data, but for a rather structured source model (Vegetti et al. 2010b). Figure 28 shows a reconstruction of the system down to the noise level where the source is more smooth, but a perturbation of the lensing potential is required at 4.3 kpc projected distance from the lens center (the red feature in the upper-left of the lower-right panel shows the corresponding over density).
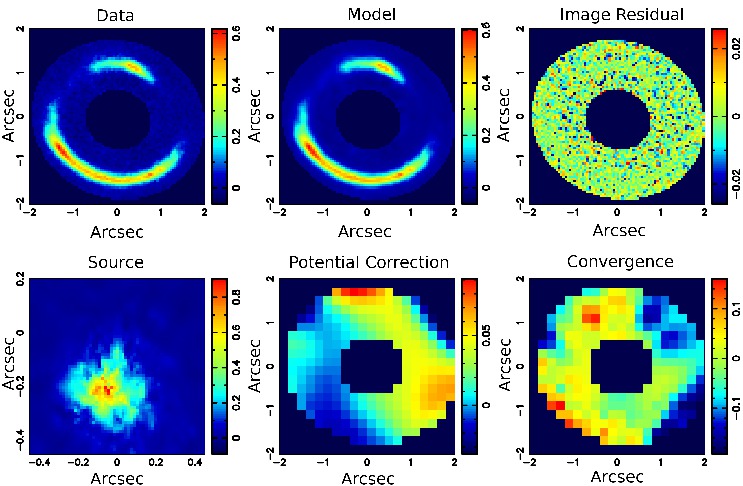 |
Figure 28. Gravitational imaging analysis of the Jackpot gravitational lens system. The panels are as in Figure 27. Note the convergence peak in the top right portion of the bottom-right panel, corresponding to the detected substructure. |
Whereas there is a tradeoff between the complexity of the source and that of the lens potential, this can objectively be assessed through the Bayesian evidence (i.e. the probability of the data when marginalizing over the full posterior probability function) and the smooth-source plus more complex lens model is preferred at a (rough) equivalent of 16-σ significance (Vegetti et al. 2010b).
This detection is confirmed by modeling the substructure with a tidally truncated pseudo-Jaffe density profile (Vegetti et al. 2010b). The substructure mass is Msub = (3.51 ± 0.15) × 109 M⊙. A lower limit of (M / L)V,⊙ ≥ 120 M⊙ / LV⊙ (3-σ) is set inside a sphere of 0.3 kpc centred on the substructure (rtidal = 1.1 kpc). This implies a projected dark matter mass fraction in substructure at the radius of the inner Einstein ring of f = 2.15-1.25+2.05 percent (68% C.L) in the mass range 4 × 10⁶ M⊙ to 4 × 10⁹ M⊙, assuming α = 1.9 ± 0.1 (with dN / dm∝ m-α). Assuming a flat prior on α, between 1.0 and 3.0, increases this to f = 2.56-1.50+3.26 percent (68% C.L). The likelihood ratio is ~ 0.5 between these fractions and that from simulations (f N-body ≈ 0.003). More recently, a second detection has been reported in the CLASS gravitational lens system B1938+666 based on HST and Keck adaptive optics images (Vegetti et al. 2012). Remarkably the satellite mass is only 2 × 10⁸ M⊙ and yet it is detected at redshift 0.881.
The inference on the substructure mass function based on just two systems are clearly very uncertain (Vegetti et al. 2012), but so far the results are broadly consistent with those expected from numerical simulations. Effort is under way to refine those measurements by applying the gravitational imaging technique to larger samples of lenses (Vegetti et al. 2013, in preparation). Proving that the substructure is inside the ETG and not along the line of sight is actually challenging (Chen et al. 2003; 2011). At the moment the level of line of sight contamination is ill-constrained.
The method of strong gravitational lensing has progressed significantly in the past decade, proving to be fundamental tool for precision astrophysics and cosmology. Progress in the field has come from new observations of unprecedently large samples of lensed systems, a growing synergy with other techniques (stellar kinematic and stellar population studies), and the development of new methodologies such as self-consistent lensing and dynamics and grid-based strong lensing. Whereas this research area is just too extensive for an exhaustive review in this short a space, we have tried to illustrate the progress and potential of strong lensing by highlighting some recent results from the largest galaxy-scale strong lens survey to date, the SLACS survey. These examples demonstrate that valuable constraints can be set on the inner density profiles of ETGs as well as on their dark-matter mass fraction as function of galaxy mass and cosmic time, their stellar IMF and the level of mass substructure.
One obvious concern is that strong gravitational lenses are rare in the sky (approximately fewer than 1/100-1/1000 massive ETGs can be detected as strong lenses, depending on resolution and depth). However, even in an era when exquisite data can be gathered for much larger samples of non-lens galaxies, strong lensing still brings unique and extremely precise measurements of mass (typically to a few percent) which are independent of the standard assumptions and uncertainties of other more traditional methods, as discussed at some length in this review. By combining strong gravitational lensing information with that inferred from other methods one may break many of the traditional degeneracies (e.g. mass-anisotropy, IMF versus stellar mass) and achieve new insights into the formation and evolution of early-type galaxies. Furthermore strong lensing thrives at cosmological distances where other methods suffer from the inevitable loss in sensitivity and angular resolution. For example, as discussed in this review, only by using strong lensing information can one determine, as a function of cosmic time accurate mass profiles, the normalization of the stellar IMF and the abundance of dark substructures. Thus, strong lensing is an essential tool for any evolutionary study of the mass structure of ETGs.
Furthermore, the upcoming decade will see a revolution in the study of strong gravitational lens systems. At the moment, most strong lensing applications are limited by the number of known strong lens systems suitable for that particular application. The current samples, limited to only a few hundred galaxy-scale lenses, are insufficient to explore detailed trends in mass, redshifts, and other potentially illuminating parameters. However, the current and next generation of wide field sky surveys (e.g. from Herschel-ALMA, DES, LSST, PanSTARRS, LOFAR, Euclid, KiDS, SKA, etc.) will enable the discovery of 103 - 105 galaxy-scale lens systems thus removing the limitations stemming from sample size once and for all. With only limited resources for detailed follow-up of individual sources at present, strong lenses will clearly become a high-priority target given the high density of information that they provide.
Acknowledgments
We are most grateful to Lia Athanassoula, Giuseppina Battaglia, Matt Bershady, James Bullock, Laurent Chemin, Enrico Maria Corsini, Nathan Deg, Ken Freeman, Dimitri Gadotti, Ortwin Gerhard, Stacy McGaugh, Kristine Spekkens, and Piet van der Kruit for useful discussions. Laurent Chemin, Octavio Valenzuela and Giuseppina Battaglia are also thanked for providing Figures 10, 11, and 18 respectively. Cory Wagner very kindly improved the presentation of various figures, and two diligent referees provided valuable comments that improved various parts of this review.
SC and LMW acknowledge the support of the Natural Sciences and Engineering Research Council of Canada through respective Discovery grants. MC acknowledges support from a Royal Society University Research Fellowship. AAD acknowledges support from the Canadian Institute for Theoretical Astrophysics (CITA) National Fellows program. HH and LVEK acknowledge support by NWO VIDI grants, while TT acknowledges support from the Packard Foundation through a Packard Research Fellowship.