


While the previous sections focus on the surveys which find dusty star forming galaxies, their observational strengths and limitations, this section addresses DSFGs' physical characterization. Basic information like redshifts and luminosities are needed before carrying out a more detailed characterization, but it is the characterization which tells us the physical setup driving DSFGs' intense infrared luminosities, shedding light on the entire process of galaxy formation in a cosmological framework. Furthermore, physical characterization provides essential clues to the interplay between active Active Galactic Nuclei (AGN) and starburst regions, the kinematic history of gas and stars in galaxies' disks, the total stellar, dynamical, dust and gas masses, the physical extent of galaxies, and whether or not those galaxies have recently undergone interactions with other galaxies.
This detailed information on individual galaxies is what we would hope to obtain for all DSFGs, but unfortunately, the observations it requires are expensive. Nearly all observations described in this section have constituted major time investments on behalf of cutting-edge telescopes world-wide, and sometimes, only provide insight for a small handful of galaxies (3-20 SMGs for example). Although our capabilities are improving with the next generation of facilities (e.g. ALMA, CCAT, SPICA, GMT, TMT, and E-ELT), physical characterization will always be available for only a subset of galaxies detected in our large surveys. As such, the selection function determining which galaxies are characterized with follow-up observations is always critical to keep in mind when interpreting these data. For example, most of the initial follow-up of 850 µm-selected SMGs was carried out on the most luminous subset of SMGs at LIR > 1012.5 L⊙ ; those systems were determined at the time to be extreme, scaled-up analogues of local ULIRGs with star formation rates SFR > 1000M⊙ yr-1 14. Although true, that characterization is not appropriate for the whole population. Since many of the observations below are only representative of DSFG subset populations, it is essential that the reader keep this type of bias in mind when interpreting results.
From an observer's perspective, this section addresses most types of detailed physical characterization from the radio through the X-ray except molecular gas characterization. The latter has been such a substantial piece of the puzzle in interpreting DSFG evolution that it deserved its own section (§ 8) which follows this section. Included below are discussions of DSFGs' star formation history and dynamical time, dust characterization, stellar masses, stellar IMF, AGN content, kinematics, and physical size.
5.1. Star Formation History & Dynamical Time
The dynamical time of DSFGs is constrained observationally from a small sample of galaxies at high-z and, more frequently, from inference of local ULIRG IRAS samples. The timescale for evolution in starbursting galaxies can be represented as the timescale of the burst, observationally probed as the depletion timescale (τdepl) for molecular gas, or molecular gas mass over current star formation rate. Even with a large potential of star forming fuel, the high star formation rates seen in DSFGs often implies short depletion timescales.
Solomon & Sage (1988) provides a succinct summary of the depletion time, or rather LFIR / LCO, for local ULIRGs divided by morphological merger classes, given prior suggestions that mergers and interactions are responsible for elevated LFIR / LCO or lower τdepl over normal star-forming galaxies (Sanders & Mirabel, 1985, Sanders et al., 1986, Young et al., 1986). While they find non-interacting LIRGs have gas depletion timescales of ≈ 150-30+20 Myr, merging or merged galaxies have τdepl = 60-20+30 Myr and galaxies with tidal tails and bridges (e.g. evidence of the initial stages of a merger) have τdepl = 16-4+6 Myr. The difference between merging or interacting galaxies and non-merging systems is striking.
At higher redshifts, the best measurements of DSFG timescales come from 850 µm-selected SMGs with CO measurements (Neri et al., 2003, Greve et al., 2005, Tacconi et al., 2006, 2008, Coppin et al., 2008b, Bothwell et al., 2010, Casey et al., 2011a, Bothwell et al., 2013a). Bothwell et al. (2013a) provides a summary of all CO surveys directed at 850 µm-selected sources, and more recently Carilli & Walter (2013) summarizes molecular gas surveys at high-z. As described later in § 8, these surveys measure typical depletion timescales of ~ 100-200 Myr for SMGs versus much longer ~ 1 Gyr timescales for normal galaxies (e.g. Tacconi et al., 2010). Although these timescales are longer than seen in local ULIRGs, this is primarily due to elevated gas fractions in high-redshift galaxies. In other words, for a fixed SFR, the gas masses at high-z are higher by factors of 2-3.
Figure 25 contrasts the measured dust temperatures of DSFGs in the local and high-z Universe; the local samples are collated from the Revised Bright Galaxy Sample (Chapman et al. 2003c, most recently with re-analyzed SEDs in U et al., 2012) and high-z samples are all Herschel-Spire selected (Casey, 2012, Symeonidis et al., 2013, Lee et al., 2013). Chapman et al. (2003c) fit the LIR dust temperature relation using the 100 µm to 60 µm color of the local sample in lieu of temperature. Here we convert that value to λpeak (a conversion which is by-and-large independent of SED fitting method). Unfortunately, most measurements of dust temperature in the high-z Universe pre-Herschel were limited to a handful of objects, mostly SMGs, which had more than one photometric constraint in the ~ 50-300 µm rest-frame wavelength range. Most SMGs (e.g. Chapman et al., 2005) lacked FIR SED measurements to constrain dust temperature directly. In addition, because SMGs have been selected primarily on the Rayleigh-Jeans tail, they carry a known bias against warmer dust temperature systems. Since Herschel-Spire's selection straddles the FIR emission peak out to z ~ 2 it's an excellent tool for constraining high-z temperatures, as has been done by Casey et al. (2012a) for spectroscopic samples, and Symeonidis et al. (2013) and Lee et al. (2013) for much larger photometric samples. Notably, DSFGs at higher redshifts have cooler SEDs than those locally, even when correction for selection bias is taken into account. This is thought to be due to more extended dust distributions (e.g. Swinbank et al., 2013) in high-z DSFGs on scales ≳ 2 kpc, versus the more compact ISM seen in local ULIRGs ≈ 1 kpc (see more on DSFGs' sizes in § 5.10).
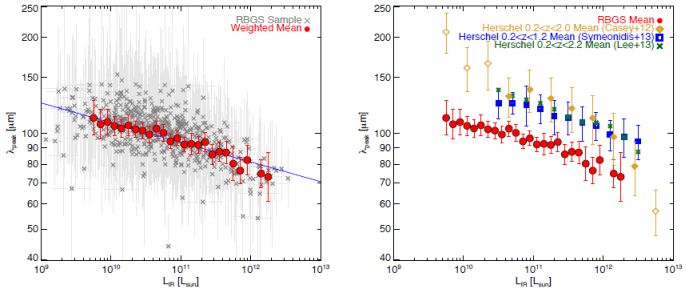 |
Figure 25. The relationship between luminosity and dust temperature plotted in LIR - λpeak space. λpeak is inversely proportional to dust temperature, the exact conversion being dependent on the assumed opacity model. At right, the relation is plotted for the local and unbiased Revised Bright Galaxy Sample (Sanders et al., 2003, Chapman et al., 2003c). Higher-luminosity sources appear to be warmer, following a power-law type relation with λpeak ∝ LIR - 0.06. At left, we illustrate the same relation measured for limited samples of high-z sources detected with Herschel-Spire (Casey et al., 2012a, Symeonidis et al., 2013, Lee et al., 2013) who find a similar slope but offset relation. The offset implies that galaxies of equal luminosity at higher redshift have colder dust. Colder dust could be caused by different dust composition or geometries. |
Dust masses for DSFGs have not been straightforward to measure precisely given the lack of FIR photometry on most galaxies, however, as noted in § 4.3, even if dust temperature is not well constrained, a flux density measurement on the Rayleigh-Jeans tail (i.e. optically-thin portion) of the black body provides a decent dust mass estimator. For example, the nominal 850 µm-selected SMGs, with S850 ≈ 5 - 10 mJy (Smail et al., 2002), ⟨z⟩ ~ 2.2 (Chapman et al., 2005), and dust temperatures Tdust ≈ 20 - 40 K (Kovács et al., 2006) imply dust masses of ≈ 5 - 20 × 108 M⊙ . In contrast, the dust masses of more recently observed Herschel-selected galaxies, with flux densities of S250-500 ≈ 20 - 60 mJy, ⟨z⟩ ~ 1, and Tdust ≈ 30 - 50 K (Casey et al., 2012a) are much lower at Mdust ≈ 1 - 20 × 108 M⊙ , due in part to the fact that 850 µm preferentially selected colder, more massive dusty galaxies than Herschel (from Equation 12) and Herschel-selected galaxies sit at lower redshifts. At high-z, the 850 µm-selected SMG sample described by Ivison et al. (2011) summarize CO(1-0) observations, enabling a direct comparison of SMGs' dust-to-gas ratios to those of local galaxies through the measured quantity ⟨ LCO ′ / L850 ⟩. By and large, the gas-to-dust ratio measured is consistent with local values, ≈ 100, enabling a direct scaling between dust mass and gas mass, a far more direct and simple observational investment than conversions from CO molecular gas transitions (see more about gas mass measurements in § 8).
Note that recent work on Herschel samples of modest star formers at 0.2 < z < 2 have found tight correlations between dust masses and stellar mass (e.g. Dunne et al., 2011, Buat et al., 2012, Magdis et al., 2012b) or specific star-formation rate, sSFR (Santini et al., 2013). These works assume that the gas-to-dust mass ratio varies with metallicity and can be used to constrain gas fractions on and off the star forming main sequence.
Determining stellar masses for high-z dusty star-forming galaxies has been a task that has proven to be highly uncertain and the subject of heavy debate. For example, for the exact same 850 µm-selected submillimeter galaxies, Hainline et al. (2011) and Michalowski et al. (2012) find values that show up to an order of magnitude difference from one another. The uncertainties that plague stellar mass measurements of high-z dusty galaxies are both those common to all stellar mass measurements from galaxies, as well as some that are unique to dusty galaxies at high-redshift. These encompass both our theoretical understanding of stellar population modeling and the varying quality of observational constraints.
The first component in determining the stellar mass of DSFGs that introduces some uncertainty is the assumed star formation history (SFH). Typical assumptions involve an exponentially declining SFH, a constant SFH, a single burst of star formation, or a multiple-component SFH. As noted by Dunlop (2011), a multiple component SFH can lead to higher inferred stellar masses than a single component model. In a single burst, the entire stellar population must be young in order to match the observed UV emission. This typically results in estimated stellar masses that are somewhat low. For a continuous star formation history, the current SFR is set by the current UV flux, and the length of time over which the galaxy has been forming stars is set by the longer wavelength optical and NIR emission. The multi-component fits allow, in principle, both possibilities. The burst can drive the observed UV emission, while the continuous SFH may contribute to the optical emission with ages that can be somewhat older than when solely assuming a single SFH.
In principle, the SFHs of massive galaxies that form stars in a quiescent mode (that is, not undergoing a burst that would drive them significantly off of the SFR-M* relation) are reasonably well constrained. Thomas et al. (2005), McDermid et al. (2012) and Pacifici et al. (2013) find older stellar populations for galaxies of increasing mass. Davé et al. (2012) and others show that a lognormal SFH for galaxies that peaks at increasing amplitude and earlier times for more massive galaxies provides a good fit to the typical SFH for galaxies in cosmological simulations. Thus, in principle, a reasonable SFH for a DSFG would be a lognormal SFH calibrated for the halo mass of the galaxy under question, with potentially a second late burst component added on. This, of course, is predicated on some knowledge of the halo mass (we discuss halo mass determinations of DSFGs in more detail in § 7).
The second key issue involved is in the choice of stellar population synthesis (SPS) model parameters. SPS calculations are recently reviewed by Conroy (2013), and we refer the reader to that review for a more thorough discussion of uncertainties in population synthesis calculations. Briefly, we note that Hainline et al. (2011) explored both Bruzual & Charlot (2003) and Maraston (2005) stellar evolutionary models, and found that utilizing the Bruzual & Charlot (2003) models resulted in roughly ~ 50% higher masses than the Maraston (2005) models. Note, however, than the Hainline et al. (2011) stellar masses account for this systematic uncertainty.
The third main uncertainty involves the choice of a stellar initial mass function. As we discuss both in the next subsection (§ 5.4), as well as in § 10, both observational constraints and theoretical models that aim to pin down the IMF in high-z DSFGs result in a wide range of potential options. Most variations from a locally-calibrated IMF at high-z tend to go in the direction of more massive stars and less low-mass stars; this said, observational constraints of the IMF in present day ellipticals, the supposed descendants of high-z DSFGs suggest that the IMF may actually be bottom-heavy in these. Even minor differences such as the usage of a Chabrier (2003) IMF versus a Salpeter (1955) IMF can result in a factor ~ 1.8 difference in the calculated stellar mass (and, consequently, the star formation rate).
Borys et al. (2005) provided one of the first large samples of stellar mass measurements of high-z DSFGs, focusing on the submillimeter galaxy population. Borys et al. assumed both instantaneous burst SFHs, as well as constant SFHs as two potential limiting cases. With an assumed Miller-Scalo IMF (Miller & Scalo, 1979), this group provided evidence that SMGs are an extremely massive galaxy population, with derived stellar masses ranging from log(M*) = [11.14,12.15] (with one outlier at log(M*) = 10.56) using the conversion M* = 10-0.4(MK - 3.3) / LKM where LKM is the light-to-mass ratio, taken on average to be ~ 3.2. The median of the Borys et al. (2005) sample was ⟨ M* ⟩ = 2.5 × 10¹¹ M⊙. Because this study was aimed at investigating X-ray detected SMGs (to compare stellar masses to black hole masses), contamination of the stellar masses by AGN is a potential issue, particularly because rest-frame K-band luminosities were used in the derivation. Dye et al. (2008) determine the stellar masses for galaxies in the SHADES survey with only 8 bands of photometry utilizing the synthetic spectra of Bruzual & Charlot (2003); while they find comparable stellar masses to the work of Borys et al. (2005), the margin of uncertainty from lack of observational constraints dominate.
In 2011, two nearly contemporaneous papers came out with starkly different results for the stellar masses of the same sample of SMGs. Hainline et al. (2011) examined ~ 70 SMGs, and found that ~ 10% of their sample had substantial contributions to the SED from AGN, much like those analyzed in Borys et al. (2005). Instead of deriving stellar masses from rest-frame K-band (2.2 µm) luminosities, which can potentially be contaminated by powerlaw emission from AGN heating, Hainline et al. (2011) make use of rest-frame H-band luminosities (1.6 µm) which probe the peak of stellar emission more directly and therefore, produce a more accurate measure of stellar mass. Hainline et al. find lower stellar masses for their sample of SMGs than most other studies, with a median M* of ⟨ M* ⟩ ≈ 7 × 10¹⁰ M⊙. At the same time, Michalowski et al. (2010) found a median stellar mass in the Hainline et al. (2011) sample of 76 SMGs of ⟨ M* ⟩ ≈ 3.5 × 10¹¹ M⊙ . When correcting for assumed IMF effects, Hainline et al. (2011) find that their median mass comes to within roughly a factor of 3 of the Michalowski et al. (2010) results. Michalowski et al. (2012) followed up on these works, and performed a systematic analysis of the discrepancies in the Hainline et al. (2011) and Michalowski et al. (2010) stellar masses. These authors claimed that the discrepancy was not dominated by AGN contamination, but rather different choices of stellar IMFs, population synthesis models, and the star formation history.
In the absence of strong constraints on either the stellar IMF in high-z SMGs, or the star formation history, it is reasonable to expect an inherent factor ~ 2 - 3 uncertainty in any stellar mass measurement of high-z DSFG. One promising way forward is to utilize other mass constraints. For example, CO dynamical mass measurements (e.g. Greve et al., 2005, Tacconi et al., 2008, Bothwell et al., 2013a) in combination with an assumed dark halo profile can provide a constraint on the remaining stellar mass. This neglects any contribution to the mass by HI, and comes with the uncertainty of an assumed dynamical state of SMGs. The abundance matching methodology of Conroy & Wechsler (2009) and Behroozi et al. (2013) can provide some constraints on the average M* that must exist in DSFGs (Béthermin et al., 2013), given some a priori knowledge of their typical halo masses. The abundance matching technique assumes that the most (stellar) massive galaxies at a given redshift reside in the most massive haloes, least massive galaxies in the least massive haloes, and corresponding matches at intermediate masses. By employing such a technique, Behroozi et al. (2013) constrain the average stellar mass of galaxies in haloes between Mhalo = 1012 - 1013 M⊙ at z = 2 to range from M* ≈ 5 × 10⁹ - 1011 M⊙ . If we assume the Hickox et al. (2012) halo mass measurements of 850 µm selected SMGs (c.f. § 7) of ~ 6 × 10¹² h-1 M⊙ , one arrives at a typical stellar mass of a z ~ 2 SMG of ~ 1.1 × 10¹¹ M⊙ . We note that this is significantly below the empirical upper limit for stellar masses of z ~ 2 SMGs of ~ 1 - 3 × 10¹² M⊙ derived by Hayward (2013).
Outside of SMGs, the number of measurements of stellar masses of high-z DSFGs are relatively limited, though extremely important in terms of working toward a synthesis picture of how different breeds of DSFGs in the high-z zoo may or may not be related. Berta et al. (2007) and Lonsdale et al. (2009) constrained the stellar masses for some Spitzer-selected ULIRGs at z ~ 2 that were selected at 5.8 µm (> 25.8 µJy) and 24 µm(> 400 µJy), respectively. In order to investigate a potential evolutionary connection between 24 µm DOGs and 850 µm SMGs, Bussmann et al. (2012) examined the stellar masses for a sample of DOGs that had both bump-like and powerlaw-like mid-IR colors. While the spectral bump owes to an opacity feature in stellar spectra, the powerlaw feature likely owes either to AGN contribution, or to dust opacity in that region (Narayanan et al., 2010a, Snyder et al., 2013). Bussmann et al. (2012) utilized a fixed method of stellar mass determination for their sample of DOGs, and a sample of SMGs, and found that DOGs selected at this flux density cut tended to be roughly twice as massive as traditional SMGs.
Going forward, accurately constraining the stellar masses of DSFGs will be a critical step toward our understanding their relationship to other galaxy populations at high-z, and whether or not they lie on the galaxy main sequence at a given redshift. Resolved near-IR IFU work may help to disentangle any potential contribution from AGN to the luminosity. Similarly, accurate CO or [CII] dynamical masses (which will require resolved morphologies in order to constrain the galaxy inclination angle) may help to place stronger constraints on the stellar masses of high-z DSFGs.
Whether or not the stellar initial mass function (IMF) varies with physical conditions in galaxies is a question of fundamental importance that impacts nearly every aspect of extragalactic astrophysics. The topic is still open, and is most recently reviewed by Bastian et al. (2010). We refer the reader to the Bastian review for a comprehensive picture of potential IMF variations in the Galaxy and other galaxies, and concentrate here on evidence for IMF variations at high-z. We employ the following definitions, and assume a basic IMF shape that is has a log-normal shape in dN / d log m-M space, with potentially steeper slopes at low and high-masses c.f. Figure 1 from Bastian et al., 2010. “Bottom light” refers to a deficit in low-mass stars, and implies that the IMF slope does not vary, but rather just the mass at which the IMF turns over varies. “Bottom heavy” is the opposite. “Top heavy”, in contrast, refers to a changing of the slope of the IMF. Both bottom light and top heavy IMFs have the consequence of having more massive stars per unit stellar mass formed than a typical Milky Way IMF, while bottom light has more low mass stars.
As is discussed in more detail in § 10, some of the first claims for a varying IMF in high-z dusty galaxies came from theoretical groups, who found difficulty in finding enough submm luminous galaxies in cosmological simulations. Baugh et al., 2005 suggested that if the IMF varied from a traditional Kennicutt (1983) form (dN / d log m ∝ m-x, with x = 0.4 for m < 1 M⊙ and m = 1.5 for m > 1 M⊙ ) to a flat IMF (x = 0 for all masses) for star bursting galaxies. The physical motivation for this was that the simulations required more galaxies with a colder dust spectrum in order to match the then-available SCUBA counts. The top heavy IMF assumed in this case allowed both for more UV photons from massive stars, as well as a higher yield of dust (via metal enrichment from Type II supernovae). The combination of these gave rise to enough SMGs in the simulations to match observations. This said, other groups (e.g. Hayward et al., 2013b) have found that it is possible to match the observed SMG counts without varying the IMF from what is observed locally, although more work needs to be done to match more than one observational constraint simultaneously.
Other papers have argued for either top heavy or bottom light IMFs at high-z. Tacconi et al. (2008) simultaneously modeled the CO-H2 conversion factor, stellar masses and IMFs of z ~ 2 SMGs, and found that the IMF may have an excess of high-mass stars, with a best fit mass to light (M / L) ratio roughly half that off a standard Kroupa IMF. This however assumes that high-J CO transitions trace the same region as low-J CO lines, however this often cannot be the case (Ivison et al., 2011) as the integrated SMG star formation history would exceed the local baryon density (Blain et al., 1999). Similarly, potential discrepancies in the integrated cosmic star formation history, and evolution of the stellar mass function may imply either a bottom light or top heavy IMF at high-z, with the idea that such an IMF would cause inferred SFRs to decrease, and bring the two values into agreement (Hopkins & Beacom, 2006, Elsner et al., 2008, Pérez-González et al., 2008, Wilkins et al., 2008), though issues related to luminosity function integration as well as nebular line contamination in stellar mass estimates may relieve some of these tensions (Reddy & Steidel, 2009, Stark et al., 2013). van Dokkum (2008) suggested that the color evolution of early type galaxies at z ~ 1, combined with their mass to light ratios may be well described by a bottom light IMF, though note in Dokkum & Conroy (2012) that the same observations could be consistent with a Salpeter IMF. Davé (2008) note that most cosmological simulations are unable to match the observed SFRs of main sequence galaxies at z~ 2 (at a given stellar mass), and suggest that even a mildly bottom light IMF in these systems may go some distance toward reducing the inferred SFRs of z ~ 2 galaxies enough to bring the discrepancies into accord.
Indeed, in high star formation rate surface density environments at low-z, which may resemble conditions at high-z (e.g. Kruijssen & Longmore, 2013), some indications suggest bottom light or top heavy IMFs as well. Rieke et al. (1993) and Förster Schreiber et al. (2003) find potentially that the turnover mass may be a factor 2 - 6 larger than a traditional Kroupa (2002) IMF in M 82. Similarly, Fardal et al. (2007) examine the present day K-band luminosity density, cosmic background radiation, and cosmic star formation rate density, and suggest that there is an excess of intermediate mass stars. In the Galactic Center of the Milky Way, Nayakshin & Sunyaev (2005) and Stolte et al. (2005) suggest a top-heavy IMF.
On the other hand, both dynamical methods, as well as stellar population modeling of present-epoch massive galaxies suggest that these systems may have a bottom heavy IMF. For example, observations of gravity sensitive stellar absorption lines (such as FeH, the so called “Wing-Ford” band; Ca II and Na I) aimed at distinguishing K and M dwarfs from K and M giants have found the IMF to be bottom heavy in z ~ 0 early type galaxies (van Dokkum & Conroy, 2010, 2012, Conroy & van Dokkum, 2012a, b, Spiniello et al., 2012, Ferreras et al., 2013). Similarly, constraints on the stellar mass to light ratio from kinematics have suggested a similar result (e.g. Auger et al., 2010, Treu et al., 2010, Spiniello et al., 2011, Cappellari et al., 2012, 2013, Brewer et al., 2012, Dutton et al., 2013, Tortora et al., 2013), though we note that increased mass to light ratios can result from both bottom-light and bottom-heavy IMFs (the former owing to increased numbers of low mass stars, which the latter originating in increased numbers of stellar remnants).
Considering both the indirect evidence of potential IMF variations at high-z, as well as observations of present-epoch massive galaxies (which are likely descendants of starbursts at high-z), it is fair to say that the form of the IMF in high-z systems is still a completely open issue. A number of theoretical models have attempted to understand how the IMF may vary with physical environment. Some are able to motivate physical origins for bottom light IMFs in heavily star-forming systems (e.g. Narayanan & Davé, 2012, 2013), while others argue for a bottom-heavy IMF in starbursts (e.g. Hennebelle & Chabrier, 2008, Hopkins, 2012, Krumholz, 2011a). This said, to date, no model to date can accommodate a bottom light/top heavy IMF in starbursts, as well as a bottom heavy IMF in their descendants.
5.5. Rest-frame Ultraviolet & Optical Spectral Characterization
Although obscuration significantly hampers our ability to study the optical characteristics of DSFGs in detail, several works have painstakingly amassed spectral observations of DSFGs to infer redshifts and subsequently properties like AGN content, metallicity, wind outflows and extinction factors. Like the other subsections in this chapter, the literature of optical spectral characterization of DSFGs has been limited primarily to radio-detected, 850 µm-selected SMGs.
The first comprehensive rest-frame optical study of SMGs was done by Swinbank et al. (2004) who spectroscopically confirm 30 galaxies in Hα emission whose redshifts were originally reported via detection of Lyα in Chapman et al. (2003a) and Chapman et al. (2004b). Swinbank et al. measure [Nii] / Hα ratios and Hα line widths to deduce presence of AGN in at least 40% of the sample. Figure 26 illustrates the Hα composite spectrum for SMGs without AGN. Even for SMGs without AGN, a broad line component to Hα is measured with equal flux as the narrow component. The Hα line widths are significant at 400 km s-1 and spatial extent large at ≲ 4-8 kpc, implying large dynamical masses ~ 1-2 × 10¹¹ M⊙ and short dynamical times of 10-20 Myr. Along with concurrent results on CO observations of SMGs (see § 8), this work concluded that these SMGs represent massive, metal-rich merging galaxies with high star-formation rates, significant dust obscuration (with Hα SFRs suppressed ~ 10 × in comparison to far-infrared), and containing non-negligible AGN populations, thus being the likely progenitors to massive, local elliptical galaxies (e.g. Figure 2).
 |
Figure 26. The piecewise composite of a Submillimeter Galaxy's rest-frame ultraviolet and optical spectrum (blue) compared to a composite spectrum for a normal, dusty star-forming Lyman Break Galaxy at z ~ 2 (gray; Shapley et al., 2003, Calzetti, 2001). The SMG's composite spectrum is comprised of three datasets centered around the detection of three prominent emission lines: Hα (Swinbank et al., 2004), [OII] (Banerji et al., 2011), and Lyα (the median stack of star-formation dominated SMGs from Chapman et al., 2005; Chapman et al., in preparation). Also included is the rest-frame ultraviolet spectral stack from Casey et al. (2012b) for a subset of z > 2 Herschel-Spire selected galaxies (dark green; offset from SMG spectrum for clarity). Prominent emission and absorption line features are labeled. Despite assuming the dustiest template for a starburst in the rest-frame optical from Calzetti (2001) to join with the median LBG spectrum from Shapley et al. (2003), the composite spectrum from the SMG is significantly more reddened and extinguished. Detection of continuum in SMGs is rare beyond z ~ 2 and even difficult to detect in a composite. |
The rest-frame ultraviolet (UV) spectral properties of SMGs are discussed in Chapman et al. (2005) who also report their redshift distribution. Chapman et al. find that, much worse than the 10 × extinction in the rest-optical, the UV luminosities of SMGs underestimate the far-infrared star formation rates by a median factor of ~ 120, even after nominal dust-correction via the prescriptions of Meurer et al. (1997) and Adelberger & Steidel (2000). They measure a UV spectral index β= - 1.5 ± 0.8, corresponding to an E(B - V) = 0.14 ± 0.15 for a Calzetti extinction law, close to expectation for LBGs. This suggests that SMGs' UV properties do not differ significantly from those of LBGs (Adelberger & Steidel, 2000), even though it might be thought that SMGs would have significantly redder slopes (Smail et al., 2004). However, the selection bias of the Chapman et al. is important; SMGs with detectable rest-frame UV features are likely to be bluer than the median SMG, or could even be the close, unobscured companions to SMGs.
With a UV spectral index of β = - 1.5 ± 0.8, we can surmise that the expected LIR / LUV ratio for SMGs would be around ~ 10 if a dust attenuation relation with β from Meurer et al. (1999) is assumed, but again, factors of ~ 100 are more typical for SMGs. Reddy et al. (2012) recently studied the direct dust luminosity of UV-selected galaxies, comparing the UV spectral slope directly to stacked Herschel flux densities in GOODS-Herschel and found that the attenuation and reddening of the slope agree with previous results calibrated from local starburst galaxies. While the Reddy et al. (2012) results are promising, indicating no evidence for evolving dust properties out to z ~ 2, the fact that these dust attenuation curves do not apply to luminous DSFGs is concerning. Future work investigating this relationship in DSFGs is urgently needed.
A composite of the rest-frame ultraviolet spectra of SMGs without AGN is over-plotted in Figure 26, taken from Chapman et al., in preparation. Although not strictly representative of the 850 µm SMG population, the similarly luminous Herschel-Spire selected galaxies at z > 2 discussed in Casey et al. (2012b) were all identified via rest-frame UV features; their composite is also over-plotted in Figure 26 for comparison.
After the initial redshift surveys and spectral analysis of SMGs in the rest-frame UV and Hα, a z ~ 1.5 subset of the SMG population (along with some SFRGs, submillimeter-faint radio galaxies) were studied in Banerji et al. (2011) around the nebular [Oii] 3727Å line emission. Banerji et al. measure line widths similar to the z ~ 2 SMGs from Swinbank et al. (2004), arguing that they have similar dynamical masses and evolutionary histories as the higher-redshift, higher-luminosity SMGs. Large-scale wind outflows are measured via a -240 ± 50 km s-1 blueshift of interstellar absorption lines (Mgii and Feii) and are consistent with momentum-driven wind models and the V ∝ SFR0.3 local envelope seen in low-z ULIRGs (Martin, 2005). The Banerji et al. composite around [Oii] is over-plotted on Figure 26.
A major focus of galaxy evolution has been the coevolution of supermassive black holes (SMBHs) within their host galaxies and the interplay between active galactic nuclei (AGN) and starbursts (e.g. Connolly et al., 1997, Merloni, 2004, Hopkins et al., 2007). The classic evolutionary sequence - merger, to starburst, quasar, then elliptical - is not only a phase of some growth for stellar populations, but also has been shown to account for ~ 30% of the Universe's integrated black hole growth through highly obscured accretion (Treister et al., 2009, 2010). Probing the AGN content of DSFGs provides essential limits on their evolutionary history while also shedding light on SMBH growth in extreme environments. AGN have a number of observational probes, the most common being via direct detection in the X-rays, but otherwise through radio emission, optical line diagnostics, near-infrared colors, or mid-infrared continuum spectral slope (the latter two simply probe the presence of warm dust surrounding the inner torus region exterior to the SMBHs' accretion disk).
The X-ray properties of DSFGs have been studied in detail over the past decade, in particular for 850-870 µm-selected SMGs (Fabian et al., 2000, Alexander et al., 2005a, b, Pope et al., 2006, Laird et al., 2010, Lutz et al., 2010, Georgantopoulos et al., 2011, Gilli et al., 2011, Hill & Shanks, 2011, Bielby et al., 2012, Johnson et al., 2013, Wang et al., 2013b). Unfortunately, all of these studies are limited by small number statistics (Nsources < 100) cause by very time-intensive, deep X-ray observations which are required to disentangle X-ray emission dominated by AGN activity versus star formation (the latter originating from high-mass X-ray binaries, HMXBs). The results of these studies have been mixed in reporting different 'AGN fractions.' Here AGN fraction is the fraction of the population which have X-ray implied star formation rates (from HMXBs) much higher than estimates from near- to far-IR, thus the emission must originate from nuclear processes. The first measurement of AGN in SMGs (Alexander et al., 2005a) showed that 75% of radio-selected SMGs host AGN activity, with 1/3 of those constituting luminous AGN. The SMGs not hosting AGN were consistent with X-ray emission from star-formation and HMXBs. Further X-ray analysis of SMGs estimate AGN fractions of 20-29( ± 7)% (Laird et al., 2010), < 26 ± 9% (Georgantopoulos et al., 2011), 14-28% (Johnson et al., 2013) and 17( - 6+16)% (Wang et al., 2013a). The Wang et al. (2013a) work is of particular note since its sample is the ~ 100 ALMA-confirmed 870 µm-selected sources in CDFS with unambiguous counterparts, enabling effectively more precise measurements in both X-ray and FIR. An important follow-up to these X-ray studies of SMGs came in Alexander et al. (2008). Alexander et al. place observational constraints on central black-hole masses for SMGs using Hα (or Hβ) line analysis in addition to the X-rays. They find that SMGs have black-hole masses to galaxy mass ratios 3-5 × lower than local relationship (Häring & Rix, 2004), and much lower than other high-redshift populations of AGN (McLure et al., 2006, Peng et al., 2006). A summary of results regarding X-ray studies of SMGs and their AGN is summarized in Figure 27.
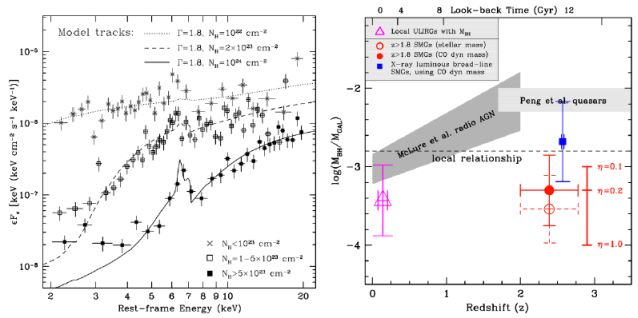 |
Figure 27. A summary of X-ray observations of ~ 850 µm-selected SMGs. At left, we re-plot the composite rest-frame 2-20 keV spectra for SMGs within three obscuration classes. The Fe Kα line is clearly visible - in particular for the most obscured AGN in SMGs - at 6.4 keV. This figure is reproduced from Alexander et al. (2005a) with permission from the authors and AAS. At right, the measured black-hole to host galaxy mass ratio measured in SMGs against other galaxy populations. This figure is reproduced from Alexander et al. (2008) with permission from the authors and AAS. The local relationship is given by the dashed line (Häring & Rix, 2004), whereas the measurement for radio-selected AGN between 0 < z < 2 is shown in dark gray (McLure et al., 2006) and z > 2 quasars in light gray (Peng et al., 2006). Also overplotted are measurements of local obscured ULIRGs (Veilleux et al., 1997, 1999). |
While X-rays provide the most definitive signature of AGN, sometimes AGN are missed there due to high column densities of dust which can obscure soft X-rays (e.g. Daddi et al., 2007a). Therefore, it is most useful to compare quantitative measures of AGN content from a multi-wavelength perspective. Although optical spectral line diagnostics can provide a valuable probe to AGN activity in galaxies via comparison of emission line ratios (e.g. Kewley et al., 2006, Juneau et al., 2011), DSFGs, even if they have optical spectral observations, often lack the high-quality, high-S/N spectra necessary for classification.
The near- to mid-infrared portion of the SED can indicate AGN contribution, even when spectral information is not available. Presence of an infrared power-law on the Wien side of the far-infrared blackbody is an indication that a galaxy contains a significant amount of warm-dust (100-1000 K) which is likely to be heated by an AGN (e.g. Desai et al., 2009, Melbourne et al., 2011). For example, a normal star-forming galaxy with a 108 M⊙ reservoir of cold (~ 30 K) dust might only have ~ 10 M⊙ of hot 500 K dust (heated by new stars in dense star-forming regions), while a similar galaxy with an AGN can have 10 × as much warm-dust (~ 100 M⊙ ) which could be detectable and dominate the mid-infrared output, potentially contaminating estimates of stellar mass or 24 µm-based star formation rate. For this reason, obtaining mid-infrared spectral observations are critical to segregate contributions of emission-lines associated with star formation, star-light from old stellar populations and emission from AGN-heated warm dust, discussed in § 5.7.
Motivated by the fact that X-rays can be absorbed in high column density environments, a number of groups developed mid-IR color selection techniques to identify AGN at high-z utilizing the bandpasses available on the Spitzer Space Telescope Lacy et al. (2004) and Stern et al. (2005). These were recently revisited by Donley et al. (2012),, under the premise that the previously developed color-selection “wedges” were contaminated by star-forming galaxies given deep enough IRAC data.
As alluded to in § 4.2.2, the rest-frame mid-infrared portion of the spectrum is complex. Unlike the far-infrared which is dominated by smooth continuum generated through cold dust modified blackbody emission and the occasionally narrow gas emission line, the mid-infrared portion has emission and absorption features generated by heavy molecules and smaller dust grains. Polycyclic Aromatic Hydrocarbons (PAHs) are a few Å-diameter heavy molecules containing hundreds of carbon atoms which exist in cold molecular clouds (Leger & Puget, 1984, Allamandola et al., 1985) and when irradiated by young stars, emit spectral line features at discrete wavelengths from ≈ 3-19 µm (Weingartner & Draine, 2001). It follows that PAH emission strength scales with star formation rate (which relies on the assumption that stellar emission heats the photo-dissociation regions where the PAHs reside Farrah et al., 2007). Aside from PAH features, the mid-infrared can also be absorbed by dust silicates, indicative of significant obscuration in warm dust with high-column densities (e.g. Houck et al., 2005). Unfortunate for observational constraints, the PAH emission features at ~ 8 µm and ~ 11 µm almost perfectly bracket the 9.7 µm Si absorption, making measurements of line strengths difficult. Underlying both these emission and absorption features is the continuum which, itself, is dependent on the relative dust distribution and bolometric heating sources in a galaxy. Heating from star formation (i.e. Hii regions) will only amount to hot-to-cold dust ratios of ≪1/1000 while an AGN can skew the relative distribution of dust temperatures higher, flattening out the SED through the mid-infrared. Without a spectrum of a galaxy, which enables one to distinguish between these complex mechanisms of emission and absorption, it can be very difficult to ascertain a physical interpretation of mid-infrared flux densities, e.g. from observed 24 µm Spitzer-MIPS work from z ~ 1 - 4.
In-depth studies of high-redshift galaxies' mid-infrared spectra was not possible before the launch of the Spitzer Space Telescope's Infrared Spectrograph (IRS) instrument. The timing was perfect for investigating the mid-infrared spectral properties of 850 µm-selected SMGs, now described in Menéndez-Delmestre et al. (2007), Valiante et al. (2007), Pope et al. (2008b) and Menéndez-Delmestre et al. (2009). These works find that SMGs have a majority of broad PAH emission features (80%) with the remaining 20% of SMGs being dominated in the mid-IR by AGN. The continuum spectral slope for SMGs in the mid-IR spectral region is measured as α = 2, where Fν ∝ ν-α. This agrees with prior results of the estimated slope from non-spectral observations (Blain, Barnard, & Chapman, 2003) which estimated α = 2 for sources without prominent AGN (and a shallower value, α ~ 1 for luminous AGN, e.g. Koss et al., 2013). Interestingly, Menéndez-Delmestre et al. (2009) find that the ratio between 6.2 µm and 7.7 µm PAH emission is higher than in local ULIRGs or nuclear starbursts, pointing to a more extended distribution of both cool and warm dust in SMGs than in compact local ULIRGs. A further set of AGN-dominated SMGs are described in Coppin et al. (2010) who demonstrate that even though AGN can dominate the mid-IR spectra of SMGs, they rarely dominate their bolometric luminosities. The Menéndez-Delmestre et al. mid-infrared SMG composite spectrum, excluding bright AGN, is shown in Figure 28.
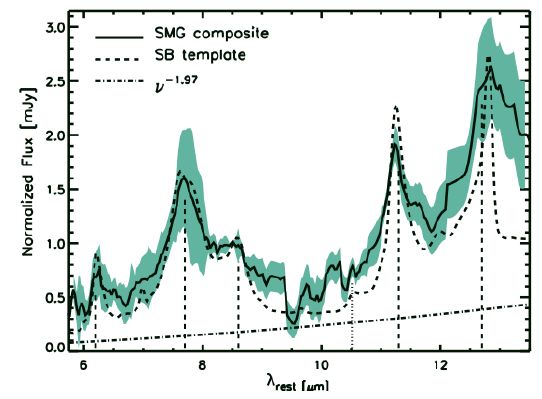 |
Figure 28. The composite mid-infrared spectrum of non-AGN dominated SMGs from Menéndez-Delmestre et al. (2009) compared to a starburst-dominated composite spectrum of low-redshift galaxies from Brandl et al. (2006).. Underlying the PAH spectral features is a power-law continuum component with spectral slope of α = 1.97, most likely originating from optically-thick emission around Hii in star-forming regions. This figure is reproduced with permission from Menéndez-Delmestre et al. (2009) with permission from the authors and AAS. |
Elbaz et al. (2011) revisit mid-infrared analysis of DSFGs with data from Herschel-Pacs, in the context of the infrared main sequence of star forming galaxies (DSFGs in the context of the main sequence are discussed more in § 5.11). They define a parameter IR8 ≡ LIR / L8, where L8 is the rest-frame 8 µm luminosity, an approximation for the 7.7 µm PAH strength. They make use of observations of suppressed PAH emission in local LIRGs and ULIRGs (whereby heavy molecules are destroyed in the most dense star forming environments, e.g. Rigby et al., 2008, Díaz-Santos et al., 2010) to distinguish two modes of star formation where normal main sequence galaxies have IR8 values consistent with local LIRGs, whereby starbursts have elevated IR8 ratios, consistent with local ULIRGs. They find that ULIRGs at z ~ 1 - 2 have IR8 ratios consistent with normal main sequence star forming galaxies and thus conclude that most Herschel-Pacs detected galaxies are not merger dominated. As discussed further in § 5.11, this supports other observational and theoretical evidence that z ~ 2 DSFGs have different star formation histories than z ~ 0 DSFGs. However, recent follow-up from Herschel-Spire selected galaxies in COSMOS (Lee et al., 2013) suggest that ULIRGs at z ~ 2 do indeed have elevated IR8 values compared to less luminous sources, after correcting for the depths of both mid-infrared and far-infrared surveys. Lee et al. (2013) also present some evidence that the infrared main sequence that appears to be quite tight at mid-infrared and optical wavelengths, dissolves when far-infrared-based star formation rates are considered. Although preliminary evidence points to IR8 being a good indicator of starbursts, the impact of certain observational assumptions and biases need to be better understood.
5.8. Mid-Infrared Spitzer-selected Populations
Despite the complexity of mid-infrared spectra, the deep and wide 24 µm Spitzer surveys of the high-z Universe provided a revolutionary look at dusty galaxies with large studies of thousands of galaxies pre-dating Herschel. The population of Dust Obscured Galaxies (DOGs; Dey et al., 2008, Pope et al., 2008a) define the population of 24 µm-selected galaxies that have extremely red colors (i.e. (R-[24]) ≥ 14 mags [Vega]). In a multiwavelength analysis, a large fraction of these DOGs seemed to be “mid-IR excess” sources, or galaxies that have unusually strong rest-frame 8 µm emission compared to the integrated infrared (Daddi et al., 2007b, Papovich et al., 2007, Magnelli et al., 2011). The physical origins of DOGs mid-infrared emission could have been AGN-heating or bright PAH emission lines. Rigby et al. (2008), Farrah et al. (2008), Murphy (2009), Fadda et al. (2010) and Takagi et al. (2010) found the latter (note however that not all of these works explicitly use the DOG selection criterion, their samples overlap substantially). Indeed, the AGN fraction of DOGs (and similar z ~ 2 BzKs) appears to be smaller than was originally anticipated ~ 30% at S24 < 1 mJy (Pope et al., 2008a, Alexander et al., 2011). Alexander et al., 2011 provide a thorough analysis of the likelihood of an AGN dominating the mid-infrared spectral regime using > 20,000 24 µm-identified sources. They determine an AGN fraction of just 9% at S24 = 350 µJy increasing up to 74 ± 20% at S24 ≈ 3 mJy. Also see Kirkpatrick et al. (2013) for a detailed discussion of how AGN fraction changes with 24 µm flux density limit.
The near-infrared SED of DOGs has been critical to placing them in an evolutionary context with SMGs. Galaxies with large stellar masses exhibit a near-infrared 'bump' originating at rest-frame 1.6 µm that owes to a local minimum in the atmospheric opacity in massive stars (John, 1988, Simpson & Eisenhardt, 1999, Farrah et al., 2008). Generally speaking, galaxies with a mid-IR bump (observed frame at z ~ 2) are associated with being star formation dominated, while those with a powerlaw mid-IR SED are assumed to be AGN dominated. Bussmann et al. (2009, 2011) examined the HST morphologies of both power-law and bump DOGs at z ~ 2, and advocated a merger-driven scenario in which bump DOGs evolved into power-law DOGs (i.e. star formation dominated galaxies evolved into AGN dominated galaxies). This was predicated on evidence that the bump-DOGs had more extended (and somewhat irregular) morphologies than the power-law DOGs, while the latter were more dynamically relaxed. This scenario was given some theoretical backing by Narayanan et al. (2010a).
Kinematic studies of DSFGs are much more observationally expensive than basic photometric or spectral constraints, and are therefore naturally limited to smaller sample sizes. Nevertheless, a substantial effort has been made to survey 850 µm-SMGs kinematically, through ionized gas around Hii regions (typically Hα integrated field unit observations) and cold molecular gas (typically CO mm-line interferometric observations).
Key works on Hα kinematics in SMGs is summarized by Swinbank et al. (2006), Alaghband-Zadeh et al. (2012) and Menéndez-Delmestre et al. (2013). Collectively, they observe 16 SMGs at 2.0 < z < 2.5 and present strong evidence for merger-driven histories - many at an early stage first pass, where multiple components are seen separated by ~ 8 kpc and 200 km s-1, while others are later stage single-component systems with high-dispersion and buried AGN. Figure 29 illustrates the line-profile characteristics of these SMGs with respect to local starbursts from the SINGS sample, the z ~ 2 SINS sample of star-forming galaxies (Shapiro et al., 2008), some simulated SMGs (Davé et al. 2010), and simulated disk and merger templates (also from Shapiro et al., 2008). The divide between mergers and disks is quite clear and narrow in this sample, with ~ 8.5/10 of SMGs lying in the unambiguous merger-driven region of the plot. Results from high-resolution CO molecular gas observations of SMGs support this merger-driven model of SMGs, albeit with limited statistics and only within the most luminous > 1012.5 L⊙ subset, the details of which are described more in § 8.
 |
Figure 29. Line-profile characteristics of resolved Hα IFU observations of 10 SMGs (Swinbank et al., 2006, Alaghband-Zadeh et al., 2012, Menéndez-Delmestre et al., 2013). The x-axis plots velocity dispersion field asymmetry while the y-axis plots the velocity field asymmetry. This figure is reproduced with permission from Alaghband-Zadeh et al. (2012). Blue background points represent regions dominated by smoothly rotating disk galaxies while red points are expected to be dominated by merger-driven templates (Shapiro et al., 2008). The triangles represent local samples: both normal star-forming galaxies from SINGS (blue) and ULIRGs (yellow). Simulated SMGs from the SPH simulations work of Davé et al. (2010) are shown as gray circles; note that although many of the Davé et al. simulations appear in the 'merger' portion of this diagram, only 1/41 is actually a merger (suggesting that perhaps the morphological and dynamical signatures of mergers at high-z are not straightforwardly calibratable using low-z samples). The high-z star forming galaxies from SINS (Förster Schreiber et al., 2009) are small green crosses, while SMGs are large black crosses. Within this small sample, it appears that 100% of SMGs are consistent with being merger-driven (this however includes one special system which is a merger and a disk all at the same redshift), which is consistent with findings from kinematic studies of the brightest SMGs in cold molecular gas (e.g. Engel et al., 2010, Riechers et al., 2011d). |
5.10. Physical Size and Morphology
Measuring the physical sizes of DSFGs at high redshift requires high-resolution imaging ≪ 1′′ (beyond z ~ 1, 1′′ corresponds roughly to 8 kpc). High-resolution imaging can be gathered from either optical/near-infrared stellar continuum or from direct infrared interferometric observations in the millimeter or radio. Millimeter or radio follow-up is more likely for highly obscured sources like DSFGs (where the optical magnitudes can be staggeringly faint, iAB ~ 25 - 26).
When molecular gas CO observations are taken at high-resolution (e.g. Tacconi et al., 2008, Bothwell et al., 2010, Engel et al., 2010 for SMGs), a consequence of obtaining kinematics is also obtaining the simple size measurement of the cold gas reservoir. While the morphologies of the sources themselves might be disturbed, these works reached a consensus that SMGs have effective radii of re = 2 ± 1 kpc 15, on average twice the physical size of local ULIRGs which are very compact with re ≲ 1 kpc. Both SMGs' sizes and molecular gas masses seemed to be twice as large as local ULIRGs, thus the population was dubbed their scaled-up analogues. Note that by these measures, both SMGs and local ULIRGs are much more compact than normal disk galaxies of comparable masses, which extend ≳ 8 kpc.
One important caveat of the molecular gas size measurements is that the measured emission was made on high-J transitions of CO and not the ground state, CO(1-0). In fact more recent results (Ivison et al., 2011, Riechers et al., 2011d) show that emission from CO(1-0) is more extended, both in line width velocity space and spatially, with a typical FWHM of 540 km s-1 (broader than the typical high-J transition line width of ~ 150 km s-1) and spatial FWHM of ~ 16 kpc. While complementary work at radio wavelengths using the high-resolution MERLIN interferometer (Chapman et al., 2004b, Biggs & Ivison, 2008, Casey et al., 2009a) corroborate the high-J molecular gas size measurements with sizes of re ≈ 2 kpc measured for radio continuum emission, we note that extended emission could either be resolved out from earlier MERLIN results or the radio continuum is only probing areas of dense star formation with higher incidents of supernovae (see § 5.12 for a discussion of radio emission in DSFGs). Furthermore, these works also found that SMG sizes were diverse, from unresolved point-sources near the Eddington starburst limit, to sources extended over ~ 8 kpc. Biggs et al. (2010) furthered investigated SMG morphologies with VLBI radio observations, showing that most SMGs do not have a compact radio core. These authors used this to argue that the radio emission in SMGs are not likely powered by nuclear AGN, but rather galaxy-wide starbursts.
As is the case with many other physically constrained parameters in this section, the measured constraints on size come from only a handful of sources. Clearly measured size depends on which observational probe is being used - whether it samples dense star-forming regions or extended, low-excitation cold gas reservoirs. Although size can be an essential stepping stone for measuring gas or star formation density (thus making density arguments), it is critical that the relative difference between observational probes is understood.
Beyond providing a simple visual characterization of the system of interest, the morphology of a galaxy at particular wavebands can reveal a host of underlying physical processes. For example, the extent of the FIR-bright region can provide constraints as to whether a starburst is Eddington-limited (e.g. Younger et al., 2008, Riechers et al., 2013b), which can be informative for models of star formation feedback in ultra-luminous galaxies (e.g. Thompson et al., 2005, Hopkins et al., 2013c, a).
One of the principle reasons for obtaining radio morphologies of high-z galaxies soon after their discovery was to exploit an assumed correlation between the radio and FIR flux (which was a fair assumption, given the strong local correlation; Murphy, 2009), and therefore place constraints on the size of the FIR emitting region. With advances in (sub)mm-wave interferometry during the early 2000s, direct FIR morphology measurements became available. These measurements confirmed the relatively large spatial extents of the star formation activity in high-z SMGs as compared to local ULIRGs (e.g. Younger et al., 2008), and has driven the rise of models where the luminosity density of high-z ULIRGs is one of the strongest indicators for the physical properties of the IR emitting environment (Rujopakarn et al., 2011).
Morphological classification of DSFGs is often too difficult to attempt in the optical or near-infrared due to extreme dust obscuration, however, out to z ~ 1.2, Kartaltepe et al. (2007) find high fractions of optically-luminous galaxies in pairs (the evolution of the pair fraction going as ∝ (1 + z)n=3.1 ± 0.1), implying almost ~ 50% of galaxies at z ~ 2 should be in close pairs. When completing a similar analysis on DSFGs selected at 70 µm with Spitzer, the majority of galaxies appear to be undergoing interactions, and an overall increase in merger fraction is seen from z ~ 0 to z ~ 1. With deeper high-resolution near-infrared imaging from the CANDELS survey, Kartaltepe et al. (2012) find similar results with visual classifications of Herschel-Pacs-selected galaxies (see right-hand side of Figure 30) of almost ~ 73% of ULIRGs out to z ~ 2 undergoing potential interactions from morphological signatures.
 |
Figure 30. At left, radio 1.4 GHz high-resolution continuum is shown in contour over 3′′ × 3′′ optical i-band ACS images of two SMGs from Chapman et al. (2004b) and two SFRGs from Casey et al. (2009a). Morphologies in the optical alone are ambiguous, especially at z > 2 where the K-correction is not straightforward and highly dependent on spectral type. The addition of radio continuum - which traces the FIR continuum for starbursts - sheds insight on obscured star-formation, while also sensitive to AGN, which should manifest as unresolved point sources (Casey et al., 2009c, Biggs et al., 2010). Radio and optical emission are often offset from one another indicated disturb or irregular morphologies consistent with mergers. At right, example near-IR cutouts from HST-WFC3 of Herschel-Pacs selected ULIRGs in a CANDELS field, 72% of which exhibit interacting or merging morphologies (Kartaltepe et al., 2012). These figures are reproduced in part from Chapman et al. (2004b), Casey et al. (2009a) and Kartaltepe et al. (2012) with permissions from the authors and AAS. |
Swinbank et al. (2010) present targeted Hubble Space Telescope ACS and NICMOS observations of 850 µm-selected SMGs measuring sizes and morphologies for 25 galaxies spanning z ~ 0.6 - 3.0 (⟨ z ⟩ =2.1) drawn from the Chapman et al. (2005) spectroscopically confirmed SMG sample. They measure characteristic sizes of ri = 2.3 ± 0.3 kpc and rH = 2.8 ± 0.4 kpc at observed i- and H-bands respectively, not statistically different than submm-faint field galaxies (like Lyman Break Galaxies). They attribute the difference in measured size between bands to structured dust obscuration, impacting the measurement of i-band sizes. Furthermore, by fitting Sersic indices to the H-band light, they find that SMGs are more analogous to spheroidal or an elliptical galaxy light distribution than disky light distribution (i.e. n ~ 2, where n ~ 1 would represent an exponential disk and n ~ 4 represents a spheroidal de Vaucouleurs profile). Using estimates of the same SMGs' stellar masses, Swinbank et al. determine that the stellar density of SMGs is comparable if not a bit higher than local early-type galaxies and red, dense galaxies at z ~ 1.5 which are proposed to be SMGs' direct descendants. Importantly, they also note that the rest-frame UV/optical morphologies of SMGs seem to be decoupled from all millimeter-determined observables.
Note that gravitationally lensed samples, some of which are discussed in the next chapter, can provide important insight into sources' gas, dust and stellar distribution and sizes by virtue of providing increased spatial resolution. However, as noted in Hezaveh et al. (2012), the size distributions measured in lensed galaxies are biased towards more compact sources.
5.11. Relationship to Normal Galaxies: the Infrared Main Sequence
Many recent works have framed analysis of new Herschel-detected DSFG populations in the context of the “Main Sequence” of galaxies (Elbaz et al., 2011, Rodighiero et al., 2011, Nordon et al., 2012, 2013, Sargent et al., 2012, Magnelli et al., 2013a). The main sequence was first presented in Noeske et al. (2007b, a) as terminology for the perceived tight relationship between galaxies' stellar masses and their star formation rates. This correlation is seen to evolve towards high-redshift, where galaxies of a fixed stellar mass are likely to have star formation rates ten times larger at z ~ 1 than at z ~ 0. The initial sample used to measure the tightness of the relation was a set of optically-selected galaxies for which Hα emission line star formation rates or 24 µm flux densities were available. Daddi et al. (2007b) found similar results when expanding selection to dustier galaxies (i.e. 24 µm-selected galaxies).
A key implication of the tight correlation between stellar mass and star formation rate is that the star formation rate in galaxies is, to first order, dependent on the gas accretion rate from the intergalactic medium (IGM) (Davé et al., 2012). Star formation is supply dependent, while the gas accretion rate scales with the ever-growing stellar potential. Cosmological hydrodynamic simulations, accordingly, show a tight relationship between the star formation rate and stellar masses in galaxies 16. Galaxies undergoing a burst (owing, perhaps, to a merger) may depart the main sequence, and exhibit elevated specific star formation rates. In fact, in recent years, this has come to be a new accepted definition of the term starburst: a galaxy with elevated sSFR (specific star formation rate ≡ SFR/M⋆) compared to the main sequence.
From an observer's perspective, this theoretical picture makes sense. The measured tightness of the SFR-M⋆ relation implies that galaxies' SFRs must be steady over long timescales, even for > 100 M⊙ yr-1 IR-bright galaxies at z ~ 2. If these galaxies' SFRs were only elevated (≳ 100 M⊙ yr-1 ) for a short period of time (≪ 1 Gyr) then the z ≳ 1 observed main sequence would not be as tight as it is observed to be, or, perhaps, it would not be observed at all. Furthermore, Stark et al. (2009) and Papovich et al. (2011) show that the star formation rates and stellar masses of most galaxies at 3 < z < 8 increase gradually with time. This is determined by observed rest-frame ultraviolet luminosity functions (e.g. Bouwens et al., 2006, Reddy et al., 2008, Oesch et al., 2010) at high redshift and the observed main sequence (Noeske et al., 2007b, Stark et al., 2013).
In the context of this review, three critical questions exist regarding the relationship between DSFGs and the main sequence. First, do DSFGs lie on the main sequence? This is equivalent to asking whether DSFGs are currently undergoing elevated SFRs compared to field galaxies at a similar M*, or whether they are simply massive galaxies with corresponding elevated SFRs. Their exact location on the SFR-M* locus depends, of course, on precise SFR and M* calibrations, both of which are at present highly uncertain in DSFGs. If we use the stellar masses of SMGs from Hainline et al. (2011), SMGs are predominantly identified as main sequence outliers whereas the masses assumed by Michalowski et al. (2012) would imply that SMGs are high-mass, high-SFR main sequence galaxies.
The second critical question we might ask is how uncertainties in M* and SFR affect the tightness of the main sequence relation. The tightness, or relative lack of dispersion, of the SFR-M⋆ relation is a primary piece of evidence supporting steady state galaxy growth. This tightness is what also implies that main sequence galaxies' duty cycles are of order unity (i.e. main sequence galaxies will be observable in their current state for most of their lifetimes). Some recent works challenge the relation by pointing out that, amongst DSFG populations, the SFR-M* trend disappears (Lee et al., 2013). This points out that tightness of the relation relies significantly on how galaxies' star formation rates are calculated - whether it be from rest-frame UV, optical, emission line, or infrared indicators, and whether or not corrections for extinction and dust attenuation are well understood or should be re-calibrated (e.g. as Kriek & Conroy, 2013).
Lastly, it is an open question how much stellar mass is built up in galaxies via major mergers. Observations suggest that main sequence galaxies at higher redshifts (z ~ 2) undergo a higher fraction of mergers and interactions than their z ~ 0 counterparts (e.g. Lotz et al., 2008, Kartaltepe et al., 2010, 2012). Similarly, much of the work on SMGs indicate that most have major merger histories with short duty cycles (Engel et al., 2010, Alaghband-Zadeh et al., 2012, Bothwell et al., 2013a). These results are closely tied with whether or not a main sequence galaxy can have a merger origin. In principle, a sizable fraction of a galaxy's mass could be built from a merger. In a cartoon example, a galaxy which has undergone a 500 M⊙ yr-1 burst for 100 Myr has built up 5 × 10¹⁰ M⊙ of stars during that time; comparing that to the median stellar masses of SMGs from Hainline et al. (2011) reveals that ~ 70% of that galaxy's stellar mass is built in the burst, versus 30% pre-dating the burst (N.B. that these fractions are much lower, if the high M* values of Michalowski et al., 2012 are assumed). In contrast, that galaxy will only spend ~ 2% of its time at high-z observed in burst mode, while the remaining 98% percent of the time is spent on the main sequence. Of course, the picture changes if the burst duration is not as long, the star formation rates lower, or the stellar masses of SMGs larger by factors of a few, all of which could actually imply burst-built stellar mass fractions < 10%.
To investigate the predominance of mergers or disks among DSFGs on and off the main sequence, Hung et al. (2013) find that merger rates are equally likely to correlate to LIR (or star formation rate) as sSFR, the specific star formation rate. This indicates that among infrared-luminous systems (in this case Herschel-selected galaxies), merger rates do not follow a strict luminosity cutoff as they do locally (whereby nearly all galaxies at > 1011.5 L⊙ are mergers Sanders & Mirabel, 1996) nor do they follow a strict sSFR cutoff limit as more recent main sequence works suggest (Rodighiero et al., 2011, Nordon et al., 2012, Sargent et al., 2012). More analyses like this, but comprising both samples of obscured and unobscured galaxies are needed to bolster the statistical analysis of calculating merger fractions and truly understanding the meaning of the galaxies main sequence.
Going forward, it will be critical to quantify at what LIR or Lbol mergers begin to dominate the origin of DSFGs. Are (for example) typical SMGs just an extenstion of the main sequence? Or are they outliers, with more extreme SFRs and lower M* values? Does the main sequence itself change when viewed from a more bolometric standpoint? As we will discuss in § 10, theoretical models are divided as to the exact role of mergers in driving SMG-like luminosities. Similarly, observational groups have not yet reached a consensus on the relationship of SMGs to the main sequence. While much of the formative work on the population present ample evidence of short-lived starbursts, some more recent observations hint that SMGs might only represent the most massive, luminous extention of the galaxy main sequence (Dunlop, 2011, Michalowski et al., 2012, Targett et al., 2013).
5.12. The FIR/Radio Correlation
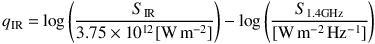
The correlation between galaxies' far-infrared/submillimeter emission and their radio emission has been empirically known for several decades, first investigated by van der Kruit, P.C. (1971, 1973) who observed that ~ 1.4 GHz emission correlated well with 10 µm emission within Seyfert galaxy nuclei spanning five orders of magnitude in luminosity. While at first both infrared and radio emission was thought to be generated by synchrotron radiation, Harwit & Pacini (1975) suggested that thermal re-radiation from dust-enshrouded Hii regions dominated the infrared while the radio originated from synchrotron radiation of relativistic electrons off of supernovae remnants. In this context, the correlation naturally falls out because the massive stars which produce supernovae are the same population which heat the surrounding gas and dust, ionizing the Hii regions. The infrared emission was confirmed to be thermally-driven when IRAS data became available in the mid 1980s (Helou et al., 1985, de Jong et al., 1985). A nice review of radio emission in galaxies is given in Condon (1992) with substantial follow-up of the FIR/radio correlation in local galaxies given in Yun & Carilli (2002), Bell (2003), Murphy et al. (2008), Tabatabaei et al. (2005, 2007), Murgia et al. (2005), Dumas et al. (2011). The correlation can be generalized by the parameter qIR where
 |
(16) |
and SIR is the integrated flux density (in W m - 2) between 42.5-122.5 µm and 3.75 × 10¹² is the frequency at 80 µm, the mid-point of that band. All quantities are rest-frame. Although the 42-120 µm limits of SIR made sense in the IRAS era, we now have observational access to far-infrared data spanning 10-1000 µm, so a somewhat more applicable definition of qIR today (Ivison et al., 2010a) is
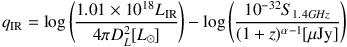 |
(17) |
where LIR is the integrated 8-1000 µm luminosity, DL2 the luminosity distance, S1.4GHz the observed 1.4 GHz flux density, and α the radio spectral index. The radio spectral index is defined by Sν ∝ να, where the radio portion of the spectrum is ubiquitously well-represented by a powerlaw and the value of α is negative in the vast majority of sources. If radio flux density is observed in some other frequency ν which is not 1.4 GHz, it can be converted to observed-frame 1.4 GHz via S1.4 GHz = Sν (1.4 GHz / ν * (1 + z))α-1. Yun et al. (2001) show that the value of qIR in local starburst galaxies is constrained at qIR = 2.34 ± 0.72 with only a handful of outliers.
Several works have addressed whether or not the correlation evolves at high-redshift. Magnelli et al. (2010) measure qIR = 2.17 ± 0.19 in a sample of SMGs and OFRGs - a value which is lower than seen in local starbursts. This could suggest that DSFGs either have a FIR excess or that there is evolution in qIR. Ivison et al. (2010a, b) visit this issue in large samples of BLAST and Herschel-selected starbursts and suggest a shallow redshift evolution of qIR ∝ (1 + z)-0.26 ± 0.07 and ∝ (1 + z)-0.15 ± 0.03 respectively. Casey et al. (2012a) measure a slightly steeper evolution, ∝ (1 + z)-0.30 out to z ~ 2 for spectroscopically confirmed Herschel-selected DSFGs. However, these works all deal with IR-selected samples and thus is intrinsically biased as pointed out by Ivison et al. (2010b); the underlying unbiased evolution in qIR can only be measured with very large samples of both radio- and IR-selected galaxies using stacking. Note that Sargent et al. (2010) present a detailed discussion of the possible evolution of the correlation and claim, after taking the many selection effects into account, that the relationship does not evolve.
The value of the radio spectral index is often assumed to be α = - 0.8 (Condon, 1992) based on measurements from nearby star forming galaxies, however more recent studies have found evidence for shallower values for fainter radio sources (S1.4 < 1 mJy Bondi et al., 2007, Garn & Alexander, 2008) between -0.6 and -0.7 (Ibar et al., 2009); Ivison et al. (2010a, b) adopt α = - 0.75 ± 0.06 with little evidence of evolution from 0 < z < 3 (i.e. the redshift dependence they measure is α ∝ (1 + z)0.14 ± 0.20). Indeed, the uncertainty in the radio spectral index can add scatter to the measured value of qIR for high-redshift sources.
When applied to high-redshift DSFGs, the FIR/radio correlation can be used to estimate LIR in the absence of infrared data. It can also be used to estimate SED characteristics like dust temperature if only 1-2 far-infrared flux densities are in hand and not enough to constrain the far-infrared peak wavelength independently (this is what was done for Scuba galaxies when only S850 was available in the far-infrared; Ivison et al., 2002, Chapman et al., 2003c). The FIR/radio correlation can likewise be used to learn more about obscured star formation at radio wavelengths since SFR∝ LIR ∝ L1.4 GHz. This is particularly useful considering radio interferometric maps have much better resolution than submillimeter single-dish maps (both deep blank-field intermediate-resolution ~ 1′′ maps, e.g. from the Jansky VLA, and high-resolution ~ 0.1′′ maps from, e.g. VLBA or e-MERLIN). This enables precise identification of multi-wavelength counterparts and infer characteristics of the distribution of obscured star formation (e.g. as seen in Figure 30). Note that one caveat of the FIR/radio correlation is that, although it holds well on galaxy-scales, often radio and FIR morphologies are substantially distinct; more detailed follow-up at the highest resolutions with ALMA and the VLA are needed to shed additional light on the matter.
Despite the usefulness of the FIR/radio correlation in DSFGs, the underlying physical mechanisms leading to it are not well understood. One explanation offered up by Volk (1989) and Lisenfeld et al. (1996) is the “electron calorimeter” theory by which the synchrotron cooling timescale is much shorter than the escape time for electrons, and only a few percent of energy input from supernovae is sufficient enough to recover a relation of ν Lν ≈ 2 × 10⁻⁶ LIR. However, calorimetry predicts a radio spectrum which is too steep (α ~ -(1 - 1.3), not -(0.6 - 0.7)). Bremsstrahlung radiation and ionization can flatten the spectrum, but would meanwhile break the FIR/radio correlation, so cosmic ray proton cooling is needed to make up for radio emission lost due to Bremsstrahlung and ionization (Thompson et al., 2007, Lacki et al., 2010, Lacki & Thompson, 2010). Very recently, a new theoretical approach explains both the FIR/radio correlation and its evolution towards high-redshift using recent advancements in understanding magnetic-field amplification in galaxies (Schleicher & Beck, 2013, Zweibel, 2013); the physical quantities which underly this formulation will be testable with the next generation of radio telescopes.
14 The evidence for this characterization comes in this section and § 8, although we note that this description has come into question in recent years. Back.
15 Note that the “size” of a galaxy quoted in the literature can range from the diameter of a galaxy to the full width at half maximum (FWHM) radius to the full width at zero intensity (FWZI) radius to re; there is no standard as to which is used so the reader of these papers should pay careful attention to the authors' methods while interpreting their results. Back.
16 We note that this is not based on an assumed relationship between the galaxy mass and accretion rate in the simulations; rather, this relationship is a direct result of the models. Back.