


Historically, different groups have been focusing on different selection techniques in their searches for molecular gas in high redshift systems. This has lead to different source categories and types which we will broadly follow for simplicity. But it is important to point out that there is major overlap in the properties of the sources discussed in the following. Many high–redshift quasars are found to be bright in the submillimeter regime, but they are classified as ‘quasars' not ‘submillimeter galaxies' as they have been originally selected as being quasars. Likewise, ‘submillimeter galaxies' (hereafter: SMGs) have typically been selected in blind submm surveys of the sky, but some show signatures of a quasar. However they are still typically referred to as SMGs as they have been discovered as such (e.g., Ivison et al. 1998; Alexander et al. 2005).
Considering telescopes, most work has been done the IRAM Plateau de Bure interferometer (PdBI), the Very Large Array (VLA) and it successor (EVLA/JVLA), the Owen's Valley Radio Observatory (OVRO) and its successor CARMA (Combined Array for Research in Millimeter Astronomy), the Australia Telescope Compact Array (ATCA), and the IRAM 30 m, James Clerk Maxwell Telescope (JCMT), 100 m MPIfR Effelsberg, NRAO Green Bank (GBT) and Nobeyama Radio Observatory (NRO) single dish telescopes. These facilities have under gone a series of improvements in receiver and antenna performance, as well as correlator upgrades leading to dramatic improvements in bandwidth. The latter has been particularly important in detecting the often broad lines seen in high–redshift galaxies in the absence of precise redshifts. Also, customized receivers on single–dish telescopes have been built with very large bandwidths to blindly detect CO emission in high–redshift galaxies, eg. the ZSPEC on the CSO (Gromke et al. 2002), and the ZSPECTROMETER on the GBT (Harris et al. 2010). These systems have lead to successful blind searches, aided in part by strong lensing of galaxies discovered in recent very wide–field Herschel surveys.
Figure 1 shows a plot of the frequency coverage for CO and other molecules for some available telescopes, with all actual measurements superposed. This plot emphasizes the complementarity of the centimeter and millimeter telescopes to probe a broad range in molecular gas and atomic fine structure transitions, providing a detailed diagnostic suite to study the ISM in early galaxies.
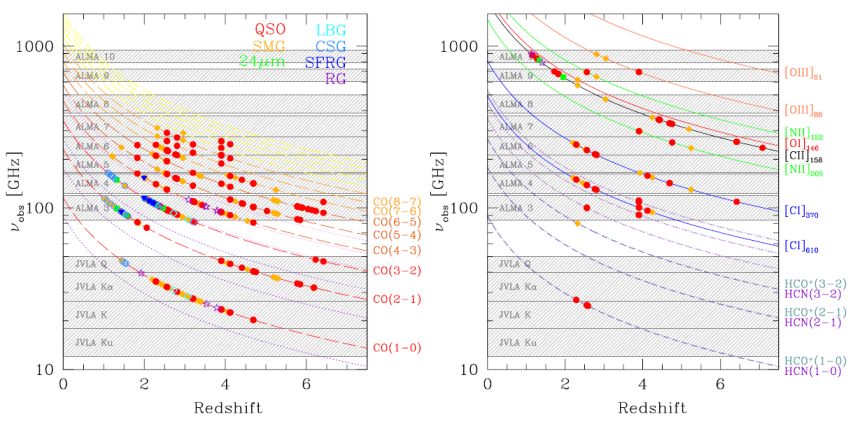 |
Figure 1. Redshifted frequencies νobs of CO transitions (left) and other key tracers of the starforming ISM (right) as a function of redshift z, following νobs = νrest / (1 + z). The shaded areas indicate the frequency bands covered by various telescopes. Highlighted are the ALMA frequency bands as well as the ‘high–frequency' bands of the JVLA. The colored points indicate detection of all high redshift (z > 1) lines. The color of the points refer to the different source types, as explained in the left panel. |
Quasars were the first targets for submm continuum observations at high redshift (e.g. Omont et al. 1996). Extensive subsequent work has shown that 1/3 of optically selected quasars are detected in submm continuum observations with mJy sensitivity, and this fraction remains roughly constant from z ∼ 1 to 6 (e.g., Wang et al. 2008a, b; Beelen et al. 2006; Priddey et al. 2003). Searches for CO emission have systematically detected CO in submm–detected quasar samples. More recently, [C II] is now being detected in quasar host galaxies, including the most distant quasar known with a spectroscopic redshift at z = 7.1 (Venemans et al. 2012).
As we shall see below (Sec. 4.1), of all objects detected at high redshifts, quasar host galaxies show the highest excitation for the molecular gas (Barvainis et al. 1997, Weiß et al. 2007b, Riechers et al. 2009a) and, in the few cases where the emission could be resolved, the CO is distributed in compact (≤ few kpc) gas reservoirs (Walter et al. 2004, Riechers et al. 2008a, 2008b, 2009b, 2011a; Carilli et al. 2002). The resulting star formation rate surface densities can thus be very high ( ∼ 1000 M⊙ yr−1 kpc−2, Walter et al. 2009b). This suggests the presence of a coeval starburst with the SMBH growth (Walter et al. 2004, Wang et al. 2010, Coppin et al. 2008). Typically the gas excitation in the quasar host galaxies can be modeled with one gas component only, and there is no evidence for extended molecular gas reservoirs around these objects (Weiß et al. 2007a, 2007b Riechers et al. 2009, Riechers 2011).
The molecular medium in quasar host galaxies is amongst the best studied at high redshift, and typical molecular gas masses are a few × 1010 (α/0.8) M⊙, with resulting short implied gas consumption times ∼ 107 yr (Sec. 4.5). Evidence for molecular outflows in quasars has recently been presented in two cases (Sec. 4.7).
Submillimeter galaxies were classically selected from the (sub–)millimeter maps obtained at 850 µm by SCUBA at the JCMT and at 1.2 mm with MAMBO at the IRAM 30m (e.g. Smail et al. 1997, Hughes et al. 1998, Ivison et al. 2000, 2007, Dannerbauer et al. 2004). Given the sensitivities of the sub–millimeter cameras of typically ≥ 1 mJy, detections are by definition Hyperluminous infrared galaxies (HyLIRGs), with LFIR ∼ 1013 L⊙, implying star formation rates ∼ 1000 M⊙ yr−1. Early searches for molecular gas emission then revealed large gas reservoirs (Frayer et al. 1998, Frayer et al. 1999 using OVRO) and extensive campaigns, in particular done at the PdBI (Neri et al. 2003, Greve et al. 2005, Tacconi et al. 2006, 2008, Engel et al. 2010, Bothwell et al. 2010, 2013) have characterized the molecular interstellar medium in exquisite detail. In a few cases the molecular reservoirs could be resolved (Ivison et al. 2010a, 2011, Riechers et al. 2011b, Carilli et al. 2011, Hodge et al. 2012), leading to substantial sizes of ∼ 10 kpc in a number of galaxies, although compact CO emission has been seen in a few cases as well (Carilli et al. 2002a; Tacconi et al. 2008). In all cases, a common trait for SMGs is extremely high optical extinction in the main regions of star formation traced by CO and thermal dust emission. This trait is accentuated by the case of the first SMG discovered in a submm deep field, HDF 850.1 (Hughes et al. 1998), which still remains unidentified in the deepest optical and near–IR images (Walter et al. 2012a).
The average excitation of the molecular gas in SMGs is less extreme than in the quasars (e.g. Weiß et al. 2007b, see Sec. 4.1), which may be attributed to the fact that the star formation in some SMGs proceeds on more extended scales than in the compact quasar hosts. Typical gas reservoir masses are of order a few × 1010 (α / 0.8) M⊙ which implies that the gas consumption times are short, of order ∼ 107 yr (similar to the quasars). Even though the redshift distribution of SMGs is thought to peak around z ∼ 2.5 (Chapman et al. 2003), there is a significant tail towards higher redshift (Schinnerer et al. 2008, Daddi et al. 2009a, Riechers et al. 2010a, 2013; Coppin et al. 2009, Walter et al. 2012a; Younger et al. 2007; Yun et al. 2012).
FIR–bright galaxies have recently also been blindly detected by large areal mapping with Herschel (sometimes referred to as ‘Herschel–selected galaxies' or HSGs) at shorter wavelengths than in the original SCUBA/MAMBO selection (Negrello et al. 2010) and thus have a different selection function (either warmer dust temperatures or lower redshifts) than the traditional SMG selection (see also Greve et al. 2008). The Herschel selected galaxies are also typyically a factor few lower in FIR luminosity than classical (SCUBA-selected) SMGs. These galaxies have also been shown to harbor massive reservoirs of gas (Cox et al. 2011, Combes et al. 2012a, Riechers et al. 2011a, Harris et al. 2012). A significant fraction of the brightest HSGs are gravitationally lensed.
The SMG surveys and related work showed a 1000–fold increase in the space density of ULIRGs from z = 0 to z ∼ 2.5 (Hughes et al. 1998, Blain 2002). Like in the case of the quasar host galaxies, it has been proposed that the SMGs pinpoint the formation of a massive galaxy at high redshift (Swinbank et al. 2006, Daddi et al. 2009a, b, Hickox et al. 2012).
Like low–z ULIRGs, QSOs and SMGs lie significantly above the so–called SFR–M⋆ ‘main sequence' (Sec. 4.5, Sec. 1.2)), however, they have other properties that are often dissimilar to nearby nuclear starbursts, such as more extended gas disks in many cases (Sec. 4.6), cooler average dust and gas temperatures, and disk–like fine structure line ratios (Sec. 4.3). Overall, SMGs are certainly extreme starbursts, but they are likely a heterogeneous population, including compact starbursts in gas–rich major mergers, massively accreting disk galaxies, and enhanced star formation likely due to gravitational harrassment in dense proto–cluster regions (Hayward et al. 2012; Hodge et al. 2012).
Radio galaxies are identified in wide–field radio surveys at cm wavelengths, and the radio emission is related to AGN jet activity, typically on scales > 10 kpc. Radio galaxies were the first very high redshift galaxies discovered, and they remain the best beacons to massive, clustered galaxy formation at high redshift (Miley & de Breuck 2008). In the standard AGN unification model, radio galaxies are simply radio loud quasars seen with the jets closer to the sky plane, such that the broadline region is obscured by the accreting dusty torus (so–called type–II AGN).
Radio galaxies were also among the first high–redshift sources in which molecular gas was detected (Scoville et al. 1997, Papadopoulos et al. 2000, De Breuck 2003a, b, 2005, Greve et al. 2004). Like some quasars, radio galaxies are often bright in (sub)millimeter continuum emission and have similar gas masses to the quasars and SMGs. CO imaging of radio galaxies often reveals multiple components on tens of kpc scales, likely indicating major gas–rich mergers (De Breuck 2003a, b, 2005, Emonts et al. 2011). The most recent imaging study by Ivison et al. (2012) shows multiple, gas rich components over tens of kpc, indicating a merging, starburst proto–cluster environment.
3.5. Color Selected Star–Forming Galaxies (CSG)
Major progress was achieved in recent years in star forming galaxies selected via their optical or near–IR colors at z ∼ 1.5 to 3. These galaxies have been selected in three different ways. The first strategy was through the near–IR BzK color selection, which selects galaxies by their 4000Å break (Daddi et al. 2004). In 2008, Daddi et al. demonstrated that this color selection successfully selects gas–rich galaxies. Daddi et al. (2010) then used this selection technique to target 6 sBzK galaxies with stellar masses > 1010 M⊙, that were also detected in the radio (but not the sub–millimeter). All galaxies were detected in CO emission, implying large reservoirs of molecular gas in galaxies that are not forming stars at the extreme rates seen in quasars and SMGs (Daddi et al. 2008; 2010).
A second color–selected sample is the rest–frame UV color selection technique, the BM/BX selection (Steidel et al. 2004). Tacconi et al. (2010) used this technique to identify a sample of CSG at z ∼ 2 for CO observations. They also detect large gas reservoirs in the majority of their sample. In the following we use the term CSG (color–selected star forming galaxies) for both the BzK and BM/BX, and related, color selection techniques.
A third color–selected sample is the Star–Forming Radio–selected Galaxies (SFRGs). These objects are rest–frame UV–color selected to be z > 1 glaxies, and then further identified as 20 cm radio continuum sources of ∼ 50 to 100 µJy but are not detected in the sub–millimeter. Chapman et al. (2008) and Casey et al. (2011) detected molecular gas reservoirs with masses of ∼ 1010 M⊙ in about half their sample (which includes a few BzK galaxies studied by Daddi et al. 2008). Indeed, it has been found that there is significant overlap between the various color selection techniques (Grazian et al. 2007).
The term ‘normal star forming galaxies' at high redshift is often used for these CSG. The intrinsic star formation rates are high, ≥ 100 M⊙ yr−1 (Daddi et al. 2010, Tacconi et al. 2010), however, these galaxies follow a similar CO to FIR luminosity ratio as low redshift spirals (Sec. 4.5), and they lie on the sSFR ‘main sequence', and as described in Sec. 1.2. Moreover, galaxies of this FIR luminosity make a dominant contribution to the overall cosmic SFR during the epoch of galaxy assembly (Sec. 1.2).
Further studies of the CSG galaxy population has shown that they are extended on 10 kpc scales in gas and stars (Daddi et al. 2010, Tacconi et al. 2010; Tacconi et al. 2012; Sec. 4.6) and that they have gas excitation that is lower than what is found in quasar hosts or SMGs (Dannerbauer et al. 2009; Aravena et al. 2011; see Sec. 4.1). However, such measurements are currently restricted to low–J lines only (up to J = 3).
3.6. MIPS/24 micron–selected Galaxies
Spitzer 24 µm–selected galaxies at z ∼ 2 have been studied in molecular gas emission by Yan et al. (2010). At the typical redshift of the sample, the 8 µm PAH feature, a tracer for star formation, is shifted in the 24 micron band. Even though these sources are bright at 24 µm and are thus forming stars at high rates, they are mostly undetected at 1.2 mm using MAMBO. Still they often have CO luminosities comparable to SMGs. These sources often show evidence for mergers, and some host dust–obscured AGNs (Yan et al. 2010, see also Iono et al. 2006a). This population is likely a hodgepodge of sources, including type 2 quasars, SMGs and hot dust sources.
3.7. Lyman–Break Galaxies, Lyα Emitters, and Lyα Blobs
Progress has been made on detecting CO emission from strongly lensed LBGs, corresponding to color-selected galaxies at z ≥ 3. Baker et al. (2004) and Coppin et al. (2007) detected CO 3-2 emission in two LBGs at z ∼ 3 that are lensed by a factor of 30. Riechers et al. (2010b) detect CO 1-0 emission in these two systems, and find relatively low excitation, and gas masses ∼ 4 × 10⁹ (α / 4) M⊙, after correcting for lensing. The first detection of a more massive, unlensed LBG at z = 3.2 has been reported in Magdis et al. (2012a).
CO emission has also been searched for in high–z Lyα emitting galaxies (LAE) and Lyα emitting ‘blobs'. Observations of one strongly lensed LAE at z = 6.5 resulted in a stringent upper limit to the gas mass of 4.9 × 10⁹ (α / 0.8) M⊙ (Wagg et al. 2009). Lyα blobs are typically large (tens of kpc), and their exact origin remains uncertain, possibly being the remnants of radio–mode feedback as seen in the Ly–α halos around powerful radio galaxies (Miley & De Breuck 2008), or even representing cooling gas in dense filaments from the IGM (Dekel et al. 2009). Searches for CO emission have led to non–detections at z ∼ 3 (Yang et al. 2012), and z = 6.6 (Wagg & Kanekar 2012), with gas mass limits of order 1010 (α / 0.8) M⊙.
The advent of ALMA early science has opened the very real and exciting prospect of detecting [C II] 158 µm emission from typical LBGs and LAEs at very high (z > 6) redshift. Even with limited capabilities (1/3 of the final array), a number of typical LBGs and LAEs have already been detected with relative ease in [C II] at z ∼ 5 (Riechers et al. 2013; Wagg et al. 2012; Carilli et al. 2012; Sec. 4.3.2).
3.8. Table of all high–z ISM detections
We have compiled a table of all high–redshift (z > 1) detections of the molecular interstellar medium. Most of the detections are of the CO line, but there are also detections of higher–density molecular gas tracers (observed only in quasar hosts), such as CN, HCN, HNC and HCO+ and the CO isotopomer 13CO. For many sources, multiple–J CO detections are available. The table also includes measurements of the atomic fine structure lines, most notably [C II], but also [N II], [O III] and [C I]. For convenience we have also added the FIR luminosities of these sources, derived through heterogenous ways (see footnotes in the table), following the equations in Sec. 2.9. The table will be available online through the homepage of the Annual Reviews in Astronomy and Astrophysics.
In total, the interstellar medium has now been detected in close to 200 sources at z > 1. In the following we summarize the basic observational parameter space (CO line luminosities and excitation, full width half maximum, sub–millimeter continuum emission, redshift distribution) through some key plots to interpret this rich set of observational data. In all plots we use the same color coding for different groups of galaxies (as defined in Sec. 3). These are the QSOs (quasars), SMGs (submillimeter–selected galaxies, including one Extremely Red Object (ERO) and Herschel–selected galaxies, HSG), CSGs (color–selected star forming galaxies, selected through BzK and BM/BX selection techniques), RG (radio galaxies), SFRG (star forming radio galaxies), Spitzer 24 µm selected galaxies and LBG (Lyman–break galaxies). The classification is therefore entirely based on the selection technique, not on the actual physical properties.
Since the earliest detection of molecular gas in the z = 2.28 quasar IRAS F 10214 by Brown & Vanden Bout (1991) and Solomon et al. (1992) there has been a steady increase in the number of line detections at high redshift. This is illustrated in the left panel of Figure 2 where the cumulative number of detections is presented as a function of discovery year. From this plot it is clear that over the first decade or so, the detections were dominated by quasars, with SMGs picking up in larger numbers around the turn of the millennium. Only recently have CSG been added to the list in significant numbers. The right panel of Figure 2 shows the redshift distribution of all galaxies with a line detection.
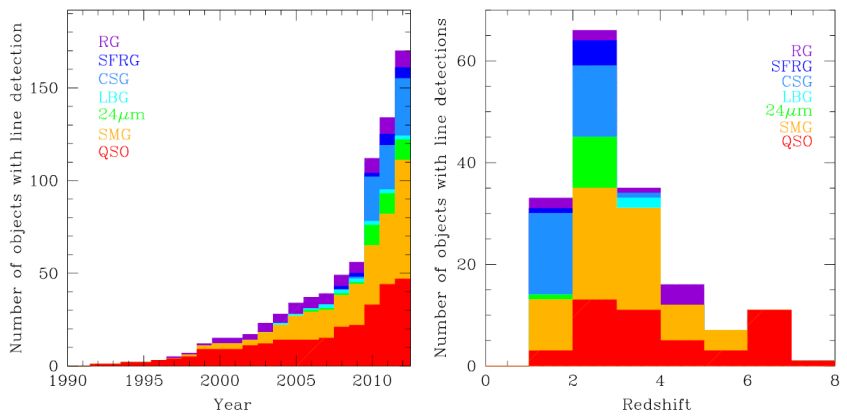 |
Figure 2. Left: Discovery history of high–redshift (z > 1) line detections. The cummulative number of detections is shown, and the different colors indicate the different galaxies populations. Historically, QSOs (Sec. 3.2), SMGs (Sec. 3.3) and radio galaxies (Sec. 3.4) have been the focus of most studies. In recent years, these have been complemented by observations of ‘main sequence' starforming galaxies (CSG, Sec. 3.5). To date close to 200 galaxies have been detected in line emission at z > 1. Right: Redshift distribution of all sources for all z > 1 line detections. The highest redshift sources z > 5 detected are the QSOs, with a growing contribution from SMGs. |