


5.1. Gas dominated disks during the epoch of galaxy assembly
5.1.1. Gas fraction One of the most striking results from the study of CSG is the remarkably high detection rate (between 50–100%) in CO emission (Daddi et al. 2010a; Tacconi et al. 2010; Tacconi et al. 2012). The line strengths are comparable to those seen in the hyperstarbusts, but the star formation rates are almost an order of magnitude smaller (Sec. 4.5). Moreover, these galaxies have a space density more than an order of magnitude larger than SMGs (10−4 Mpc−3 down to Mstars = 1010 M⊙), and they represent the galaxies that dominate the integrated cosmic star formation rate during the ‘epoch of galaxy assembly' (Sec. 1.2).
A series of measurements and consistency arguments lead to a value of αCO ∼ 4 in CSG (Sec. 3.5). The implied H2 masses range from 3 × 10¹⁰ to 1011 M⊙. Interestingly, these gas masses are comparable to, or even larger than, the stellar masses in these galaxies, as first pointed out by Daddi et al. (2010a) and Tacconi et al. (2010). This ratio is very different with respect to large disk galaxies at low redshift, where the stellar masses are close to an order of magnitude larger than the cool gas masses.
In Fig. 10 we plot a compilation of the latest measurements of the gas fraction, defined as fgas ≡ Mgas / Mstars, out to z ∼ 4, where Mgas corresponds to the molecular component, including a 1.36 factor for Helium. At all redshifts, the galaxies were selected to be star forming disk galaxies with stellar masses > 1010 M⊙.
While the scatter in Fig. 10 at any given redshift is large, there is a clear trend for increasing gas fraction with redshift in massive disk galaxies. The mean value at z ∼ 0 is: Mgas / Mstars ∼ 0.1, which increases to Mgas / Mstars ∼ 1 at z > 1.5. A functional form of fgas ∼ 0.1 × (1 + z)2 fits the data reasonable (see also Magdis et al. 2012a; Geach et al. 2011). Note that the high-z CSG CO samples tend to be at the upper end of the mass range for CSGs, but are typical of main sequence galaxies in all other respects (eg. Daddi et al. 2010). Moveover, the recent large study of Tacconi et al. (2012) suggests that the gas fraction in CSGs may increase with decreasing galaxy mass, thereby excentuating the results in Fig. 10.
We note that all points in Fig. 10 are for large disk galaxies (stellar masses > 1010 M⊙), and that the same value of α ∼ 4 M⊙ / (K km s−1 pc2)−1 was used for all sources. Moreover, while stellar masses are nominally based on full SED–fitting, the outcome is predominantly dictated by the observed near–IR data, corresponding to roughly rest frame R band (Daddi priv. comm.). Hence, the ratio on the ordinate of Fig. 10 can be considered approximately empirical, and ∝ L′CO1−0 / Rmagrest.
Narayanan et al. (2012) consider the question of the increasing gas fraction in galaxies with redshift, including SMGs and CSG, and conclude that some of the effect might be attributed to a changing value of α, with α decreasing with redshift due to higher velocity dispersions and gas temperatures in high redshift galaxies.
Overall, the CO measurements of CSG suggest that the peak epoch of cosmic star formation also corresponds to an an epoch when molecular gas masses dominates over stellar masses in common star forming galaxies (see also Swinbank et al. 2012; Geach et al. 2011; Magdis et al. 2012a). This fundamental change in the baryon content of disk galaxies with redshift likely has definitive consequences on the nature of star formation in early galaxies (Sec. 5.2).
Of course, we must keep in mind that the CSG at high redshift may not evolve into low redshift disk galaxies, and demographics suggests that subsequent mergers can lead to substantial morphological evolution. For instance, the space density and clustering of the CSG at z ∼ 2 is consistent with their evolution into early–type galaxies at z ∼ 0 (Shapley 2011; Tacconi et al. 2008).
The gas fraction of molecular gas versus stars in massive disk galaxies increases by an order of magnitude from z = 0 to z ∼ 2. Hence, the peak epoch of cosmic star formation (z ∼ 2) corresponds to the epoch when typical star forming disk galaxies were dominated by cool gas, not stars.
5.1.2. Gas Accretion Gas resupply for star formation in galaxies has become an important issue at both low and high redshift. The most extreme situations are the gas consumption times in QSO host galaxies and SMGs, which are always extremely short, in some cases as short as 10 Million years (Sec. 4.5). However, even CSGs have gas consumption timescales substantially less than the Hubble time (Tacconi et al. 2012). This point is emphasized by Bauermeister et al. (2010), where they conclude based on the short molecular gas consumption timescales in high z galaxies and the lack of evolution of the cosmic HI mass density (from study of damped Lyα absorption systems), that ultimately the gas must be accreted from the IGM.
The clear need for substantial gas resupply over cosmic time has led to a change in thinking on the gas supply to early galaxies. As opposed to either cooling of virialized, hot halo gas (White & Rees 1978), or major, gas–rich mergers (Robertson et al. 2006), the dominant mode of star formation during the epoch of galaxy assembly may be driven by cold mode accretion (CMA), aka stream–fed galaxy formation. A convergence of observations, simulations, and analytic studies suggest that gas accretion in early galaxies occurs along cold streams (T ∼ 104K) from the filamentary IGM that never shock–heat, but stream onto the galaxy at close to the free–fall time (Elmegreen & Burkert 2010; Dekel et al. 2009a, b; Bournaud et al. 2009; Kereš et al. 2005, 2009). This cool gas may form a thick, turbulent, rotating disk (Genzel et al. 2011, 2008, 2006; Daddi et al. 2010). The disks are marginally Toomre–unstable (Swinbank et al. 2011; Tacconi et al. 2010), leading to rapid fragmentation into a few kpc–scale clumps which very efficiently form stars. These clumps can be 100 times larger than Galactic GMCs, and 107 times more luminous (Swinbank et al. 2011). The star forming regions could then migrate to the galaxy center via dynamical friction and viscosity, forming compact stellar bulges (Genzel et al. 2008; Dekel et al. 2009a; Kereš et al. 2009). The process leads to relatively steady, active ( ∼ 100 M⊙ yr−1) star formation in galaxies over timescales of order 1 Gyr, and has been termed ‘rapid secular galaxy evolution' (Genzel et al. 2008).
In these models, the process slows down dramatically as gas supply decreases, and the halo mass increases, generating a virial shock in the accreting gas. Subsequent dry (gas–poor) mergers at z < 2 lead to continued total mass build up, and morphological evolution, but little star formation in such models (Hopkins et al. 2010; Naab et al. 2009, Kereš et al. 2009). In this picture the majority of stars in spheroidal galaxies are thought to form via CMA at z ∼ 2 to 3.
Davé et al. (2010) suggest that the CMA phenomenon may even scale up to HyLIRGs, and that a substantial fraction of high–z SMGs could be fed primarily by CMA, and not major mergers. Hydrodynamical simulations show that quite high gas accretion rates can be achieved in large halos at early epochs, and SFR can be elevated over the average accretion rate by a factor 2 to 3 via (common) minor mergers and general gravitational harassment in the dense environments of SMGs (see also Finlator et al. 2006, Narayanan et al. 2010b).
Physically, there may be a continuum of accretion processes, from relatively continuous CMA, through ‘clumpy' accretion of small satellites, to the rare major gas rich merger. However, current modeling and observations favor a model in which most of the accretion occurs relatively continuously over timescales ≥ 109 years (Dekel et al. 2009; Guo & White 2008).
We emphasize that clumpy, turbulent but rotating gas disks are simply a consistency argument for CMA (Shapiro et al. 2008), and they do not conclusively rule out gas–rich mergers. Robertson & Bullock (2008) have shown that ordered rotation of an extended gas disk can be reestablished shortly after a major merger. Some recent observations detected low–metallicity gas near high–redshift galaxies; the properties of this gas have been argued to be consistent with a CMA picture (e.g. Ribaudo et al. 2011, Kacprzak et al. 2012). The few single detections to date are however not sufficient to conclusively proof the existence of CMA from an observational perspective.
The current evidence for gas accretion through cold mode accretion at z > 1 is circumstantial, based on the similarity between the predicted and observed morphologies of gas–dominated disks in CSG. Low ionization quasar absorption lines may provide the best means by which to prove the existence of these flows.
Deep fields at near–IR wavelengths, and narrow band near–IR surveys, are now systematically detecting galaxies at z ∼ 6 to 10, corresponding to the tail–end of cosmic reionization when the Universe was less than 1Gyr old (Bouwens et al. 2012a, b; Pentericci et al. 2011, Bradac et al. 2012; Coe et al. 2013). Reionization represents the epoch when light from the first galaxies acted to reionize the neutral intergalactic medium that pervaded the Universe after recombination (e.g., Fan et al. 2006). Current studies suggest that the typical star forming galaxies at these redshifts have lower dust content than similar luminosity galaxies at lower redshift (Bouwens et al. 2010).
The search for dust and cool gas into cosmic reionization has focused predominantly on the host galaxies of luminous quasars with good spectroscopic redshifts. One of the most distant, and best studied, of the molecular gas detections remains the quasar SDSS J1148+5251 at z = 6.42 (Walter et al. 2003; 2004, 2009; Riechers et al. 2009a Wang et al. 2013). This (and similar) system represent the coeval formation of massive galaxies and supermassive black holes within 1 Gyr of the Big Bang. Large scale cosmological simulations show that massive galaxies and SMBH can form at z ∼ 6 via gas rich mergers, driving extreme starbursts, and rapid accretion onto the black holes, with subsequent black hole mergers (Li et al. 2007). Such systems are thought to evolve into large galaxies in rich clusters at low–z. More recent simulations suggest that cold accretion from the IGM may also play a role in, and possibly even dominate, the gas resupply (Khandai et al 2012). As the SMBH builds, feedback from the AGN expels gas from the galaxy, and hinders further accretion, thereby terminating star formation in the galaxy (Maiolino et al. 2012).
Exciting results have been obtained via imaging of the [C II] 158µm line in z > 6 galaxies, as demonstrated in Fig. 8. Imaging of [CII] emission from the highest redshift SDSS quasars (z ∼ 6) show velocity gradients indicative of rotation, with disk scales of order a few kpc (Wang et al. 2013). In once case, a ‘maximal starburst disk' is seen on a scale ∼ 1 kpc (Walter et al. 2009; Sec. 4.2). [C II] has also been detected in the most distant quasar with a spectroscopic redshift known, the quasar J 1120+0641 at z = 7.08 (Venemans et al. 2012).
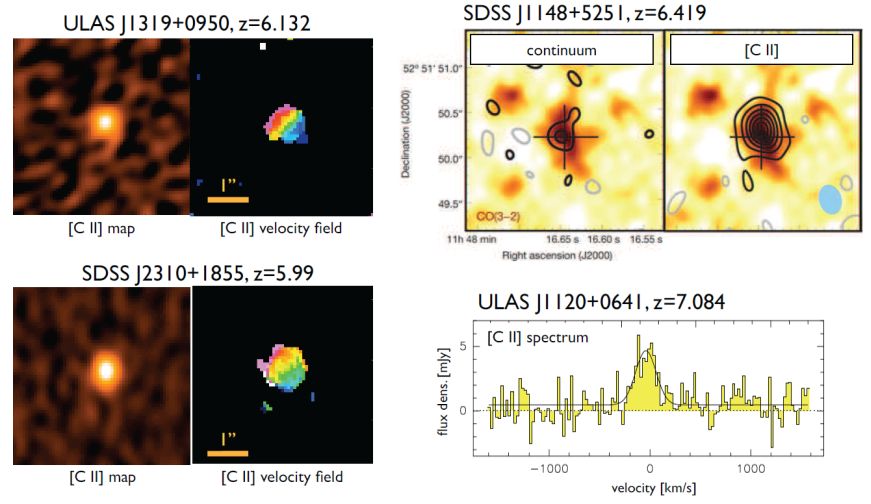 |
Figure 8. Results from observations of [C II] 158µm emission from z ≥ 6 quasars. Left shows ALMA images of the total intesity plus the intensity weighted mean gas velocity for two SDSS quasars (Wang et al. 2013). The velocity range in the top figure is ± 300 km s−1 (red to blue), while that in the bottom frame is ± 100 km s−1. Note the clear velocity gradients, consistent with gas rotation on scales ∼ 7 kpc ( ∼ 1" at z ∼ 6). The upper right shows the VLA CO images of the z = 6.42 SDSS quasar, J 1148+5251, as color scale in both frames. The contours on the left show the 250 GHz continuum emission, and those on the right show the [C II] 158µm emission imaged by the PdBI (from Walter et al. 2009a). The lower right shows the PdBI [C II] 158µm spectrum of the most distant spectroscopic redshift quasar known, a quasar at z = 7.08 (Venemans et al. 2012). |
The gas dynamics in distant quasar host galaxies allows for a study of the evolution of the black hole – bulge mass relation. Wang et al. (2010) present the most detailed analysis to date out to z ∼ 6. In this study, the black hole masses are based on standard line–width relations of ionized gas, and are consistent with simple Eddington arguments. They find that the median black hole–bulge mass ratio is 15 times higher at z ∼ 6 than today, although the scatter is close to an order of magnitude (see also Shields et al. 2006; Coppin et al. 2008). These results suggest that SMBH may assemble before the mass in their host galaxies. Such a deviation has been predicted in hydrodynamical simulations of very early SMBH and massive galaxy formation (Khandai et al. 2012).
 |
Figure 9. Left: L′CO as a function of LFIR for all systems detected at z > 1 (colored points). L′CO was calculated using the lowest available J–measurement and assuming the excitation correction tabulated in Tab. 2 (see table caption for details on different source populations). The grey symbols represent z < 1 measurements: the 0.2 < z < 1 ULIRG sample by Combes et al. 2011 and 2012b (crosses), low–z quasars from the Hamburg–ESO QSO survey (diamonds, Bertram et al. 2007), PG quasars (squares, Evans et al. 2001, Evans 2006, Scoville et al. 2003), nearby spiral galaxies (upward triangles), low–z spirals, starburst galaxies, and ULIRGs (downward and upward triangles, Gao & Solomon 2004a, b), the z < 0.2 IR QSO sample by Xia et al. (2012) and 0.04 < z < 0.11 ULIRG sample by Chung et al. (2009, open circles). The full line is a fit to all data points which gives a slope of 1.35 ± 0.04. The dashed lines indicate the best fits for the main sequence galaxies (grey dashed) and starburst galaxies (red dashed) derived by Genzel et al. (2010) and Daddi et al. (2010). Right: The right hand panel shows the logarithmic ratio LFIR / L′CO as a function of LFIR. LFIR / L′CO is a measure for the star formation efficiency in an object, and under the assumption of a conversion factor is the inverse of the consumption time τconsumption. The consumption time is plotted on the right hand side of the panels for two different values of α, Galactic (red labels) and ULIRG (blue labels). The consumption time for nearby galaxies and the CSG are ∼ 1 Gyr, assuming a Galactic α. The consumption times for the most actively star forming systems are only a few × 107 yr under the typical assumption of a ULIRG α. |
As pointed out in Sec. 4.3.2, the [C II] / FIR increases with decreasing metallicity. Hence, even if the dust content of star forming galaxies at the highest redshifts were indeed to decrease (Bouwens et al. 2010, Walter et al. 2012b), the [C II] line may remain strong, and will be a key redshift determinant, and a primary means to image gas dynamics in the first galaxies, since it traces both PDRs and the CNM.
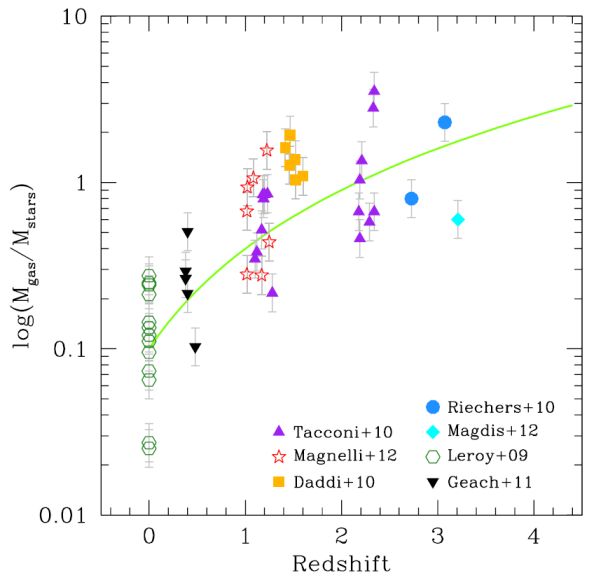 |
Figure 10. The ratio of gas mass to stellar mass (Mgas / Mstars), for various galaxy samples. The green circles are from the z = 0 HERACLES nearby galaxy sample (Leroy et al. 2008) where we only include galaxies with stellar masses > 1010 M⊙, to be consistent with the high–z samples plotted. All the points plotted assume α ∼ 4. The green curve follows Mgas / Mstars = 0.1 × (1 + z)2 (e.g. Geach et al. 2011). |
The presence of detectable CO, [C II] (and dust) emission at redshifts out to z = 7 was almost inconcievable a little more than 10 years ago. At these redshifts, the age of the universe was < 1 Gyr, and there has been little time to enrich the interstellar medium with carbon and oxygen, and then cool to form dust and molecules. The detection of molecular emission and fine structure line emission at z > 6 currently remains limited to hyperluminous infrared galaxies. These results reveal the coeval formation of massive galaxies and supermassive black holes in extreme starburst events within 1 Gyr of the Big Bang. Given the difficulties of detecting CO at the highest redshifts, [C II] and other fine structure lines will likely play the dominant role in the study of the starforming ISM at the earliest epochs.
5.3. Spectral Deep Fields and the Dense Gas History of the Universe
Most observations of the molecular gas phase in the universe have been restricted to galaxy populations that were pre–selected in the UV/optical/IR/FIR, i.e. based on their star formation properties. However, in order to obtain an unbiased census of the molecular gas content in primeval galaxies, there is a clear need for a blind search of molecular gas down to mass limits characteristic of the normal star forming galaxy population, ie. a CO deep field. Such a CO deep field has been out of reach given past instrumentation, both in terms of sensitivity and instantaneous bandwidth. However, this situation is now dramatically changing with the advent of new observational facilities. Clearly, fields with the best photometric supporting data are prefered, for rapid follow–up identification, as well as dense spectroscopic coverage, for possible ‘3D–stacking'.
As an aside, we note that a number of authors have successfully used frequency scans to obtain redshifts from CO emission for sources that were very bright in the FIR, but that had no easily identifiable counterpart in the optical, and therefore no redshift determination (Weiß et al. 2009; Lestrade et al. 2010; Walter et al. 2012; Cox et al. 2011; Combes et al. 2012a, Riechers 2011, Scott et al. 2011). A good example of such a redshift search using CO is the recent GBT spectroscopic survey of Herschel–discovered SMGs, for which redshifts were determined for 11 of 24 galaxies observed (Harris et al. 2012). Recent ALMA observations by Swinbank et al. (2012) have shown the power of the [CII] 158µm line as a redshift determinant at z ≥ 4.
Cosmological simulations have been used to predict the cosmic evolution of the dense gas history of the universe. Most of these models and simulations start with dark–matter simulations, such as the Millenium simulations (Springel et al. 2005). The dark matter halos are then populated with model galaxies and these evolve according to simple rules (‘semi–analytical modeling'). In this modeling, each galaxy today has a well–defined history of growing and merging galaxies. Obreschkow et al. (2009b) applied post–processing to these galaxies to subdivide their cold gas masses into the atomic and molecular gas phases, by assuming that the ISM pressure (Leroy et al. 2008, 2013) sets the phase balance between these two phases. As discussed in Sec. 4.2, an important complication is the CO luminosity to gas mass conversion factor. In a follow–up paper, Obreschkow et al. (2009a) predicted the CO luminosity functions for the various transitions of CO, including a number of effects, such as heating by starbursts and CMB, and metallicity dependence. Power et al. (2010) compared a number of currently favored semi–analytical galaxy models (again applying them to the Millenium simulation). Lagos et al. (2011) used a similar methodology, but a different galaxy formation model to separate the atomic and molecular gas phases of the interstellar medium. Lagos et al. (2012) then refined their model through modeling the various rotational transitions of CO using a PDR code. All these models are scaled such that the CO(1–0) luminosity function at z = 0 is matched (Kereš et al. 2003).
An independent approach to predicting CO and H2 luminosity functions as well as the cosmic evolution of the H2 / CO density is presented in Sargent et al. (2013). They separate the contributions of main–sequence and starburst galaxies to the IR luminosity functions of galaxies at various redshifts, and use the relation between CO luminosities and IR luminosities for these two populations to predict CO luminosities (Sec. 4.5). They also use a metallicity–dependent conversion factor to go from predicted CO luminosities to H2 masses (Sec. 4.2). Other calculations of this type include those by Geach & Papadopoulos (2012) and Carilli & Blain (2002).
Figure 11 summarizes the various predictions put forward to date. The top panel shows the predicted CO luminosities in 5 redshift bins, including z = 0. The CO luminosity function has to date only been measured at z = 0 (see datapoints in top left panel by Kereš et al. 2003). The luminosity functions for all other redshift bins are essentially unconstrained.
 |
Figure 11. Models for the evolution of the CO luminosity function based on semi–analytical cosmological models plus ‘recipes' to relate gas mass to CO luminosity (colored lines). The grey shading is from Sargent et al. (2013) and shows the indirectly inferred redshift evolution of the CO(1–0) luminosity function (grey shading) based on (1) the evolution of the stellar mass function of star-forming galaxies, (2) the redshift evolution of the specific SFR of main-sequence galaxies, (3) the distribution of main-sequence and star-bursting galaxies in the SFR-M⋆-plane (Sargent et al. 2012), (4) distinct prescriptions of the star formation efficiency of main–sequence and star–bursting galaxies, and (5) a metallicity-dependent conversion factor αCO. The CO luminosity function includes contributions both from ‘main–sequence' and starbursts, where the latter is characterised by a more than 10–fold increase of the star-formation efficiency. In the upper left panel the observational constraints on the local CO LF reported in Kereš et al. (2003) are also shown (see Sargent et al. 2013 for details). |
The integral under each of the luminosity curves gives the total CO luminosity which can then, under the assumption of a given conversion factor α, be translated to total molecular gas for each galaxy population. The summed density of this quantity is plotted in Fig. 12, for the models discussed above. We note that the cosmic density in H I determined through studies of damped Lyα absorption line systems, appears to show little evolution at least through the epoch of galaxy assembly (Wolfe et al. 2005).
 |
Figure 12. Left: Representation of the evolution of the cosmic star formation rate density (adopted from the compilation shown in Bouwens et al. 2010). Right: The evolution of the cosmic cool gas mass density (from Sargent et al. 2013), including predictions from semi–analytical cosmological models (Obreschkow et al. 2009a, b, Lagos et al. 2011) as well as the models by Sargent et al. (2013). The latter shows the evolution inferred from the integration of the indirectly inferred molecular gas mass functions underlying the CO luminosity distributions of Fig. 11. Also included are some admittedly extremely rough limits based on what is know about known galaxy populations at z > 1. (see text for details). These points are shown to illqustrate the potential impact of molecular deep field (‘blind') surveys. |
The number of high–z detections of molecular gas in CSG remains limited, and to date no truly deep, wide field spectral search has been performed. However, we are reaching a point where it may be possible to set limits on the evolution of the cosmic density of molecular gas. We here take a very simple approach, based on the measured stellar to gas mass ratios in existing (admittedly limited, e.g. Aravena et al. 2012) samples, and the cosmic stellar mass densities of these populations.
For five sBzK galaxies at z ∼ 1.5 to 2, Daddi et al. (2010) find a mean value of Mgas / Mstars = 1.15. For ten BX/BM galaxies at z ∼ 2 to 2.5, Tacconi et al. (2010) find Mgas / Mstars = 0.79. Tacconi et al. (2012) reach similar conclusions for CSGs at z = 1.2 and 2.2. Riechers et al. (2010b) measure a mean of Mgas / Mstars = 1.4 for two lensed LBGs at z ∼ 3. In all cases, a value of α ∼ 4 +/− 0.4 was assumed (see also Magdis et al. 2012a). In all cases the scatter in the ratio is close to a factor 2, and so for simplicity, we adopt Mgas/Mstars ∼ 1 in all cases. Note that we focus on CSG, since their space density is more than an order of magnitude higher than for HyLIRG, such as quasar hosts and SMGs, and their gas masses appear comparable (although there is a question of duty cycle in the latter samples). In this sense, these calculations represent lower limits.
Grazian et al. (2007) tabulate the total cosmic stellar mass density in different types of galaxies at different redshifts. They also quantify the substantial overlap between populations selected with the different techniques. At z ∼ 1.8, they find the sBzK galaxies dominate the stellar mass density of the star forming galaxy population (we assume only star forming galaxies contribute to the cosmic gas density), with comoving stellar mass density of ρstars = 5.9 × 10⁷ M⊙ Mpc−3. Likewise for BX/BM/LBG at z ∼ 2.5, for which they find ρstars = 2.8 × 10⁷ M⊙ Mpc−3, and at z ∼ 3.3, with ρstars = 1.2 × 10⁷ M⊙ Mpc−3.
Assuming unity ratio with the gas mass we can then establish lower limits to the cosmic gas mass density at the respective epochs, plotted in Fig. 12. We also include the z = 0 measurement of Kereš et al. (2003). Interestingly, the sBzK limit is already pushing the cosmic density into the modeled regime based on e.g., the star formation history of the universe and star formation laws.
We emphasize that this analysis is mainly illustrative, with very substantial uncertainties. First, we assume the unity gas–to–stellar mass ratios hold for galaxies well below the masses of those current observed in CO. In particular, the galaxies in the Daddi et al. (2010) and Tacconi et al. (2010) samples were typically at the high–mass end of the CSG distribution, although having ‘main–sequence' properties otherwise (eg. sSFR, gas consumption timescales). Interestingly, the larger sample of Tacconi et al. (2012) shows a trend for increasing gas fraction with decreasing stellar mass, which would increase the cosmic gas densities in Fig. 12. Second, we adopt a standard GMC value of α, when in fact this value could increase dramatically with e.g. decreasing metallicity, such that the GMC value radically underestimates the total gas mass (e.g., Genzel et al. 2012). And third, we currently cannot rule–out a population of lower–mass, gas rich galaxies that do not appear in any optical survey.
Studies of the molecular medium at high redshift have been restricted to galaxies that have been pre–selected in the optical or infrared wavebands through their star formation activity. This could potentially lead to a biased view of the molecular gas properties of high–redshift galaxies. A promising way forward is through observations of molecular deep fields, i.e. complete frequency scans towards regions in the sky that have superb multi–wavelength observations available. Such observations were prohibitive given the sensitivity and bandwidth of past facilities; a situation that will be changing with ALMA and the JVLA. The principal remaining uncertainty in determining the cosmic space density of molecular gas (ΩH2(z)) will be the calibration of the conversion factor, α.