Although the careful modeling of individual cluster cores and extended regions offers a unique way to characterize the mass distribution and understand cluster physics in detail, analysis of cluster samples provides important insights into cluster assembly and evolution. There have been several statistical studies focused on measuring cluster masses derived from lensing and comparing these with mass estimates from other measurements such as: richness, X-ray luminosity, X-ray temperature, velocity dispersions of cluster galaxies, and the Sunyaev-Zel'dovich decrement. These multi-wavelength comparisons enable a deeper understanding of empirically derived scaling relations between key physical properties of of clusters (e.g. Luppino & Gioia 1992, Loeb & Mao 1994, Miralda-Escude & Babul 1995, Allen 1998, Ota et al 1998, Ono et al 1999, Irgens et al 2002, Huterer & White 2002). These studies also help uncover how mass is partitioned between the different baryonic and non-baryonic components on cluster scales. Studying cluster samples allows the probing of several fundamental questions with regard to the dynamical state of clusters, namely, are clusters relaxed? How much substructure is present in clusters? How triaxial are clusters? How recently has a cluster had a major merger with another sub-cluster and what are the signatures of such an event? How important are projection effects in mass estimates? Are clusters in hydrostatic equilibrium? When did clusters start to assemble? And how have they evolved? Observationally derived answers to these questions from cluster samples can then be directly compared to numerical simulations, thus providing insights and tests of the structure formation paradigm.
Comprehensive multi-wavelength datasets that ideally span a range of spatial scales in clusters are needed for such statistical studies. Collecting such datasets is a big challenge as it requires coordination between researchers working with a range of observational techniques deploying many different resources. Some of the first studies of cluster samples did produce interesting cosmological results, as discussed in Luppino et al (1999), Allen et al (2001, 2002), Dahle et al. (2002) and Smith et al. (2003).
One of the key challenges for these statistical studies lies in the very definition of a sample with robust criteria, that will be complete and volume limited and be representative to avoid systematic biases. Starting from simple selection criteria is therefore very important. For instance, dramatic lensing clusters imaged by HST are likely a biased sample of the most massive clusters at any redshift with enhanced strong lensing cross sections due to an excess of mass along the line of sight from either the cluster itself or the presence of other intervening structures. Most frequently cluster samples are therefore selected on the basis of their X-ray luminosities, which should minimize projection effects that typically plague optically selected clusters. Since X-ray luminosity is proportional to the square of the electron density of the Intra-Cluster-Medium (ICM), this selection should pick genuinely virialized clusters, irrespective of the line of sight distribution of cluster member galaxies or additional background structures. One of the first systematic studies that combined X-ray and lensing data was a sample of 12 z ∼ 0.2 X-ray luminous clusters of galaxies selected from the XBACS catalog (see Figures 26 and 27) with LX > 8 × 1044 erg/s in the 0.1-2.4 keV band. These clusters have been imaged with the WFPC2 camera (Smith et al. 2001, 2005). It is found that the fraction of strong lensing clusters in this sample is 70%. All of the cluster cores also have a significant weak lensing signal, providing independent lensing constraints on cluster masses.
 |
Figure 26. Cluster samples: 3 of the 12 z ∼ 0.2 X-ray luminous clusters of galaxies selected from the XBACS catalog (Ebeling et al. 1996) observed with the HST/WFPC2 camera. Top row is Abell 68, second row is Abell 209 and last row Abell 267. First column is the weak shear field as measured from the HST data. The second column is a zoom of the cluster cores, and shows for Abell 68 the predicted critical lines (black lines). The third column is the strong lensing mass reconstruction and last column is the overlay of the Chandra X-ray map (Smith et al. 2003). |
 |
Figure 27. Left Panel: Central mass fraction (a measure of the dominance of the central dark matter halo), Mcen / Mtot versus central K-band luminosity fraction (measures the dominance of the central galaxy), LK,BCG / LK,tot. There is a remarkably clean separation between a homogeneous population of centrally concentrated clusters (Mcen / Mtot > 0.95, LK,BCG / LK,tot > ∼ 0.55) and a much more diverse population of less concentrated clusters. Center & Right Panels: Mass-LX and Mass-TX relations. The solid and dashed lines show the best-fit relations normalized by the relaxed and unrelaxed clusters respectively. The error bars on each line show the uncertainty on the normalizations. The scatter in the Mass-LX relation appears to be symmetric; in the mass–TX relation the normalization of the unrelaxed clusters appears to be 40% hotter than the relaxed clusters at 2σ significance. Figures from Smith et al. (2005). |
Smith et al. (2005) defined a number of criteria to characterize whether clusters are relaxed and also quantified the amount of substructure in them. Out of 10 clusters, they found that three clusters form a homogeneous sub-sample that have mature, undisturbed gravitational potentials which satisfy the following criteria: a dominant central dark matter halo (Mcen / Mtot > 0.95); a dominant central cluster galaxy K-band luminosity fraction (LK,BCG / LK,tot > ∼ 0.5); close alignment between the center of the mass distribution and the peak of the X-ray flux (Δ rpeak < 3 kpc); a single cluster-scale dark matter halo best-fit for the lens model; and circular or mildly elliptical X-ray flux contours. The remaining seven clusters did not satisfy one or more of these criteria and were classified as disturbed. The disturbed clusters are much more diverse than the undisturbed clusters and typically have a bi- or tri-modal dark matter distribution, irregular X-ray morphology and an offset between X-ray and mass peaks. Comparison of these results with theoretical predictions indicates that the multi-modal dark matter distribution in disturbed clusters is due to recent infall of galaxy groups into the parent cluster since about z = 0.4. The exact scaling relation between lensing mass and X-ray properties appears to be strongly dependent on the dynamical state of the cluster. Relaxed and unrelaxed clusters appear to follow slightly different scaling relations. Furthermore, this sample was also observed with the wide field CFHT12k camera in three bands (B,R,I) in order to probe the wide field mass distribution using the measured weak lensing shear signal out to the virial radius. However, the comparison of the weak lensing determined mass to the cluster luminosity and X-ray mass estimates reported in Bardeau et al. (2007) [see Figure 28] does not reveal an obvious difference between relaxed or unrelaxed clusters. There are some strong limitations though with this dataset as there were scant constraints on the redshift distribution of background sources, and some lingering inconsistencies between strong and weak lensing results. These first results with only 10 clusters set the stage for the need for larger cluster samples to understand the physical origin of such differences.
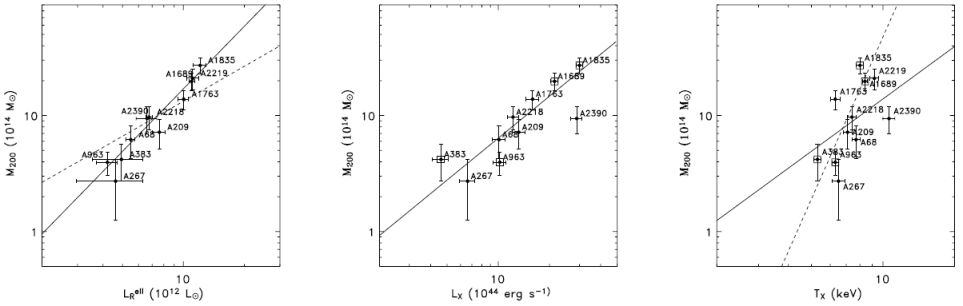 |
Figure 28. Left Panel: Lensing 2D mass versus optical luminosity for the clusters in the Bardeau et al. (2007) sample (12 X-ray bright clusters selected to be at z ∼ 0.2). The lensing mass is computed at the virial radius r200 derived from the best weak lensing fits. The luminosity is computed in the R band for the cluster red sequence galaxies. Dashed line represents a constant M/L ratio of 133 in solar units. The solid line is the best-fit power law M ∝ L1.8. Center Panel: Weak lensing 3D virial mass M200 versus X-ray luminosity. The best-fit line has a slope α = 1.20 ± 0.16. Right Panel: Weak lensing 3D virial mass M200 versus X-ray temperature. The straight line corresponds to a M200 ∝ T3/2 relation while the dashed line corresponds to the best-fit power law relation M ∝ T4.6 ± 0.7. Temperatures are derived from XMM data (Zhang et al. 2007), including A 2219 from ASCA data (Ota et al. 2004). The 4 clusters with cooling core or relaxed properties are marked with empty boxes. (From Bardeau et al. 2007). |
In a parallel paper, Hoekstra (2007) investigated the lensing versus X-ray mass relations for a sample of 20 clusters including those of Bardeau et al. (2007), although their cluster selection was primarily driven by X-ray emission. This investigation has lead to a more ambitious project known as the Canadian Cluster Comparison Project (CCCP) that will add 30 more X-ray selected clusters observed with the CFHT12k or Megacam camera to the initial set of 20 clusters. Lensing results are however still pending at the time of writing this review.
4.2. On-going and future cluster lensing surveys
Clusters of galaxies are complicated systems that are rapidly assembling and evolving, nevertheless they are considered to be very good tracers of the underlying cosmology (and in particular could probe Dark Energy) as well as a way to measure the growth of structure, thus potentially sensitive to gravity and to the nature of Dark Matter. A better understanding of clusters will be possible only with larger cluster samples, as earlier work and conclusions therefrom were limited by statistics. The number of massive clusters with published lensing data is steadily growing, as is the number of cosmological surveys in which clusters can be studied with strong and weak lensing techniques, either directly from the survey data or by further follow-ups.
Four techniques are avidly pursued to search for clusters:
We focus on the latter techniques in the following sub-sections.
4.3. Targeted cluster surveys
4.3.1. The Local Cluster Substructure Survey
(LoCuSS)
LoCuSS extends
Smith et al.'s (2005)
pilot study of 10 X-ray luminous clusters at z = 0.2 to an order
of magnitude larger sample at 0.15 < z < 0.3, drawn from
the ROSAT All-sky Survey Catalogues
(Ebeling et al., 1998,
2000;
Ebeling et al., 2004).
The main lensing-related goals of LoCuSS are to measure the mass,
internal structure, and thermodynamics of a complete volume-limited
sample of 80 clusters observable from Mauna Kea, and thus to obtain
definitive results on the mass-observable scaling relations at low
redshift. The normalization, shape, scatter (and any structural
segregation detected) of these scaling relations will calibrate the
properties of low redshift clusters as an input to cluster-based
cosmology experiments, and to help interpret high-redshift cluster
samples.
To date LoCuSS has published weak lensing analysis of 30 clusters
observed with Suprime-CAM on the Subaru 8.2-m telescope
(Okabe et al. 2010;
see also
Oguri et al. 2010).
The main results from this statistical study are that (i) a simple
color-magnitude selection of background galaxies yields samples that are
statistically consistent with negligible residual contamination by faint
cluster members, albeit with large uncertainties, (ii) cluster density
profiles are curved (in log-log space), and statistically compatible
with the
Navarro, Frenk & White
(1997)
profile, and (iii) based on the NFW profile model fits, the
normalization of the mass-concentration relation of X-ray selected
clusters is consistent with theoretical ΛCDM-based predictions,
although the slope of the observed relation may be steeper than
predicted. The last of these results is particularly interesting in the
context of detailed studies of individual clusters selected to have a
large Einstein radius. As noted in Section 7,
such objects are often found to have concentrations that exceed the CDM
prediction by factors of 2-3
(Comerford & Natarajan
2007;
Oguri et al. 2009).
Okabe et al.'s results from 30 X-ray-selected clusters indicate that the
large Einstein radius selection in earlier work introduces a strong
bias.
Comparison of Okabe et al.'s weak lensing mass measurements with X-ray
and Sunyaev-Zel'dovich (SZ) effect probes has so far been limited by the
presence of outlier clusters in the small samples for which the relevant
data are available. For example, the well-known merging cluster A1914
strongly influences the results in the X-ray/lensing comparison of 12
clusters for which Subaru and XMM-Newton data are available
(Okabe et al., 2010;
Zhang et al., 2010).
More recently,
Marrone et al. (2011)
presented the first weak lensing-based mass-SZ scaling relation based on
Subaru and Sunyaev-Zel'dovich Array (SZA) observations of 18
clusters. Encouragingly, this relation is consistent with self-similar
predictions, although it presents 20% scatter in natural log of mass at
fixed integrated Y-parameter - a factor of 2 more scatter than found in
studies that use X-ray data and assume hydrostatic equilibrium to infer
cluster mass. Indeed, the normalization of the MWL
− Y relation at Δ = 500 (roughly 1Mpc) for
undisturbed clusters is 40% higher in mass than that for disturbed
clusters. Marrone et al. identified several of the undisturbed clusters
as likely prolate spheroids whose major axis is closely aligned with the
line of sight as being largely responsible for this segregation. These
results highlight the feasibility and growing maturity of lensing-based
studies of large cluster samples, and also emphasize that much important
work remains to be done to fully understand the optimal methods for
cluster mass measurement.
4.3.2. The MAssive Cluster Survey
The MAssive Cluster Survey (MACS) is an ongoing project aimed at the
compilation and characterization of a statistically complete sample of
very X-ray luminous (and thus, by inference, massive), distant clusters
of galaxies. The primary goal of MACS was to increase the number of
known massive clusters at z > 0.3 from a handful to a
hundred. To achieve these goals,
Ebeling et al. (2001)
applied an X-ray flux and X-ray hardness-ratio cut to select distant
cluster candidates from the ROSAT Bright Source catalog. Starting from a
list of more than 5,000 X-ray sources within the survey area of 22,735
square degrees they use positional cross-correlations with public
catalogs of Galactic and extragalactic objects, with reference to APM
colors, visual inspection of Digitized Sky Survey images, extensive CCD
imaging, and finally spectroscopic observations with the University of
Hawaii's 2.2m and the Keck 10m telescopes to compile the final cluster
sample. The MACS cluster sample comprises 124 spectroscopically
confirmed clusters at 0.3 < z < 0.7
(Figure 29). Comprehensive follow-up
observations of MACS clusters include: weak lensing mass measurements
using wide-field SUBARU imaging data, virial mass estimates based on
cluster galaxy velocity dispersions measured with the CFHT and Keck, SZ
observations with the BIMA mm-wave radio interferometer, measurements of
the cluster gas and temperature distribution with Chandra, and
both deep, multi-passband and snapshot images with HST. A large
number of MACS clusters are strong lenses and some of them have been
studied in detail: MACS J1206-0847
(Ebeling et al. 2009);
MACS J1149.5+2223
(Smith et al. 2009);
MACS J1423.8+2404
(Limousin et al. 2010;
Morandi et al. 2010).
MACS J0025.4-1222
(Bradač et al. 2008)
was identified as a merging cluster with some similarity to the
“Bullet Cluster”.
Zitrin et al. (2011a)
presented the results of a strong lensing analysis of the complete
sample of the 12 MACS clusters at z > 0.5 using HST
images. The distribution of Einstein radii has a median value of
∼ 28 arcseconds (for a source redshift of zS
∼ 2), twice as large as other lower-z samples, making the MACS
sample a truly massive cluster sample confirmed by the numerous strong
lensing discoveries. One of the most extreme clusters known presently is
likely MACS J0717.5+3745
(Ebeling et al. 2004)
which was recognized as a complex merger of 4 individual substructures,
with a long tailed filamentary structure. The 4 substructures have all
been identified in a recent lensing mass reconstruction by
Limousin et al. (2011)
and the filamentary structure was directly measured by weak lensing
measurements with a 18-pointing HST mosaic
(Jauzac et al. 2012).
Horesh et al. (2010),
investigated the statistics of strong lensed arcs in the X-ray selected
MACS clusters versus the optically-selected RCS clusters (see
below). They measured the lensed-arc statistics of 97 clusters imaged
with HST, identifying lensed arcs using two automated
arc-detection algorithms. They compile a catalog of 42 arcs in MACS and
7 arcs in the RCS. At 0.3 < z < 0.7, MACS clusters have a
significantly higher mean frequency of arcs, 1.2 ± 0.2 per cluster,
versus 0.2 ± 0.1 in RCS, which can easily be explained by the nature
of the selection of these two different cluster samples.
Figure 29. The Luminosity versus redshift
plot comparing the MACS surveys to a number of other X-ray surveys:
EMSS, eBCS, WARPS, the 400 square degree survey. It is evident from
this figure that MACS is very efficient in selecting the most massive
X-ray clusters at z > 0.3.
4.3.3. ESO distant cluster survey
Nevertheless, optical selection is still common specially for
high-redshift clusters (z > 0.6) where X-ray selection is
limited. A particular focused and productive survey is the ESO distant
cluster survey (EDiSC,
White et al. 2005).
EDiSC is a survey of 20 fields containing distant galaxy clusters (0.4
< z < 1.0) chosen amongst the brightest objects identified
in the Las Campanas Distant Cluster Survey. They were confirmed by
identifying red sequences in moderately deep two color data from
VLT/FORS2, and further investigations with VLT in spectroscopy, the ESO
Wide Field Imager, and HST/ACS mosaic images for 10 of the most
distant clusters. Using the deep VLT/FORS2 data,
Clowe et al. (2006)
measured the masses for the EDiSC clusters. In particular, they compared
the mass measurements of 13 of the EDiSC clusters with luminosity
measurements from cluster galaxies selected using photometric redshifts
and find evidence of a dependence of the cluster mass-to-light ratio
with redshift.
4.3.4. Red-sequence cluster surveys
Another important optically selected cluster survey is the 100
deg2 Red-Sequence Cluster Survey (RCS,
Gladders 2002,
Gladders & Yee 2005)
and its 1000 deg2 RCS-2 extension
(Gilbank et al. 2011),
that are based on shallow multi-color imaging with the CFHT12k and
Megacam cameras. RCS-2 covers ∼ 1000 deg2 and includes
the first RCS area, it reaches 5σ point-source limiting magnitudes
in [g, r, i, z] = [24.4, 24.3, 23.7, 22.8], approximately 1-2 magnitudes
deeper than the SDSS. RCS-2 is designed to detect clusters over the
redshift range 0.1 < z < 1, building a statistically complete,
large (∼ 104) sample of clusters, covering a
sufficiently long redshift baseline to be able to place constraints on
cosmological parameters probed via the evolution of the cluster mass
function. Furthermore, a large sample of strongly lensed arcs associated
with these clusters has been derived (e.g.
Gladders et al. 2002,
2003),
and weak lensing measurements from the most massive clusters detected in
RCS-2 is likely possible.
4.3.5. The Multi-Cluster Treasury: CLASH
survey
The recently approved MCT (Multi-Cluster Treasury) program on HST
will achieve multi-band imaging of a sample of 25 X-ray selected
clusters
(Postman et al. 2011),
thus providing detailed photometric redshift estimates for
multiple-images. This sample with appropriate ground based follow-up is
likely to provide important insights into many of the current unsolved
problems in cluster assembly and evolution. Dedicated lensing studies
will enable detailed investigation of their mass distributions
(Zitrin et al. 2011b,
2011c)
and will help find some efficient lenses that can be exploited to study
the distant Universe by using them as gravitational telescopes
(Richard et al. 2011)
- a topic that will be discussed further in the next section.
4.4. Cluster lenses in wide cosmological
surveys
The previous sub-section focused on targeted cluster surveys. However
cluster lenses can also be found in wide cosmological surveys (e.g.
Wittman et al. 2001,
2003;
Hamana et al. 2004;
Maturi et al. 2005).
We briefly outline some of the most representative surveys of this
decade starting from the widest to the deepest.
4.4.1. The Sloan Digital Sky Survey
The Sloan Digital Sky Survey (SDSS) is an imaging and spectroscopic
survey covering 10,000 deg2
(Aihara et al. 2011).
Although, this survey was not designed or optimized to
measure cluster lensing, interesting results have been produced from
detected strong and weak lensing measurements of clusters.
Estrada et al. (2007)
investigated the Sloan images of 825 SDSS galaxy clusters searching for
giant arcs. Both a visual inspection of the images and an automated
search were performed, and no arcs were found. They nevertheless report
a serendipitous discovery of a bright arc in the Sloan images of an as
yet unknown cluster. Hennawi et al. (2008) presented the first results
of a strong lensing imaging survey (using the WIYN and UH 2m telescope)
targeting the richest clusters (with 0.1 < z < 0.6)
selected from SDSS. From a total of 240 clusters followed-up, they
uncovered 16 new lensing clusters with definite giant arcs, 12 systems
for which the lensing interpretation is very likely, and 9 possible
lenses which contain shorter arclets or candidate arcs which require
further observations to confirm their lensing origin. The new lenses
discovered in this survey will enable future systematic studies of the
statistics of strong lensing and their implications for cosmology and
the current structure formation paradigm.
Kubo et al. (2009)
and then
Diehl et al. (2009)
identified 10 strongly lensed galaxies as part of the “Sloan
Bright Arcs Survey”. Follow-up imaging identified the lensing
systems as group-scale lenses, an intermediate regime between isolated
galaxies and galaxy clusters (see
Cabanac et al. 2007).
Baylis et al. (2011)
presented the results from a spectroscopic program targeting 26 strong
lensing clusters (0.2 < z < 0.65) visually identified in
SDSS or RCS-2 revealing 69 unique background sources with redshifts as
high as z = 5.2, which will enable robust strong lensing mass
models to be constructed for these clusters (some of the most remarkable
clusters discovered are presented in Figure 30).
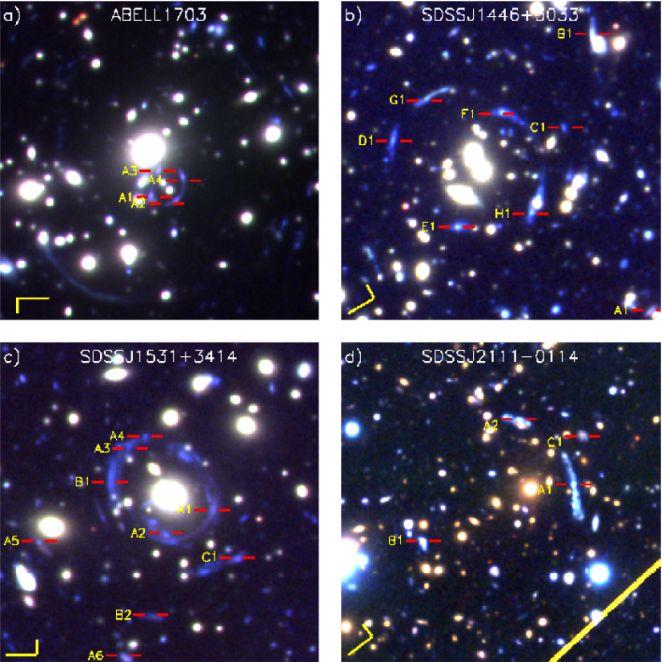
Figure 30. SDSS discovered strong lensing
clusters – a) Abell 1703, b) SDSS J1446+3033,
c) SDSS J1531+3414, and d) SDSS J2111-0114. Color composite
images are made from g, r, i imaging obtained with
Subaru/SuprimeCam. All images are 75″ × 75″.
Background sources are bracketed by red lines and labeled. Source labels
with the same letter but different numbers (e.g. A1, A2, etc.) have
the same redshifts to within the measurement errors, and
are presumed to be the same source, multiply imaged (Figure from
Bayliss et al. 2011).
On the weak lensing side, the first measurement was conducted by
Sheldon et al (2001).
Later on
Rykoff et al. (2008)
measured the scaling relation between X-ray luminosity and the total
mass for 17,000 galaxy clusters in the SDSS maxBCG cluster sample. To
achieve this, they stacked subsamples of clusters within fixed ranges of
optical richness, and they measured the mean X-ray luminosity
LX, and the weak lensing mean mass, <
M200 >. For rich clusters, they found a power law
correlation between LX and M200 with
a slope compatible with previous estimates based on X-ray selected
catalogs. Furthermore,
Rozo et al. (2010)
used the abundance and weak lensing mass measurements of the SDSS maxBCG
cluster catalog to simultaneously constrain cosmology and the cluster
richness-mass relation. Assuming a flat ΛCDM cosmology, they found
that σ8(Ωm / 0.25)0.41 =
0.832 ± 0.033. These constraints are fully consistent with those
derived from WMAP five-year data. With this remarkable consistency they
claim that optically selected cluster samples may produce precision
constraints on cosmological parameters in future wide-field imaging
cosmological surveys.
Soon after the first light of the Megacam camera at CFHT, a legacy
survey (LS) was started. It comprises
a deep ugriz (i ∼ 27.5) survey of 4 square degrees
in four independent fields spread across the sky,
and a wide synoptic u, g, r, i, z
(i ∼ 24.5) survey of 170 square degrees in four patches of
25 to 72 square degrees. Due to the excellent seeing delivered by CFHT,
the Legacy Survey has lead to intensive strong and weak lensing
studies.
In particular,
Cabanac et al. (2007)
have searched for strong lensing arcs and Einstein rings around galaxies
in both the deep and wide part of the CFHT-LS. Most of the systems
uncovered have deflection angles ranging between 2 and 15
arcseconds. Such samples have thus uncovered a large population of
strong lenses from galaxy groups with typical halo masses of about
1013 h−1 M⊙. The
13 most massive systems have been studied in detail by
Limousin et al. (2009),
and detailed analysis of the mass distribution on small and large scales
has been investigated by
Suyu & Halkola (2010)
and
Limousin et al. (2010),
respectively. A weak lensing search for galaxy clusters in the 4
square degrees of the 4 CFHT-LS deep fields was performed and results
are presented in
Gavazzi & Soucail
(2007).
Using deep i-band images they performed weak lensing mass
reconstructions and identified high convergence
peaks. They used galaxy photometric-redshifts to improve the weak
lensing analysis. Among the 14 peaks found above 3.5σ, nine were
considered as secure detections
upon cross-correlation studies with optical and X-ray catalogs.
Berge et al. (2008)
conducted a joint weak lensing and X-ray analysis of (only) 4 square
degrees from the CFHTLS and XMM-LSS surveys. They identified 6 weak
lensing-detected clusters of galaxies, and showed that their counts can
be used to constrain the power-spectrum normalization
σ8 = 0.92−0.30+0.26 for
Ωm = 0.24. They showed that deep surveys should be
dedicated to the study of the physics of clusters and groups of
galaxies, and wide surveys are preferred for the measurement of
cosmological parameters. A first catalogue of lensing selected cluster
has been recently published by
Shan et al. (2012)
on the CFHT-LS W1 field. They perform a weak lensing mass map
reconstruction and identify high signal-to-noise ratio convergence
peaks, that were then correlated with the optically selected cluster
catalogue of
Thanjavur et al. (2011).
They then used tomographic techniques to validate their most
significant detections and estimate a tomographic redshift.
More weak lensing cluster analyses are expected to be published from
CFHT-LS in the near future.
With only 2 square degrees the COSMOS Survey focused on the relatively
high-redshift Universe. Due to the relatively small volume probed,
COSMOS is unlikely to find the most massive structures in the Universe,
but it has delivered interesting constraints on the redshift evolution
of clusters and the scaling relations between observables. Thanks to the
deep X-ray observation of COSMOS fields, clusters can be efficiently
selected in principle out to z ∼ 2.
Taking advantage of the X-ray selected catalog,
Leauthaud et al. (2010)
have investigated the
scaling relation between X-ray luminosity (LX) and the
weak lensing halo mass (M200) for
about 200 X-ray-selected galaxy groups. Weak lensing profiles and halo
masses were derived for 9 sub-samples, narrowly
binned in luminosity and redshift. The COSMOS data alone are well fit by
a power law, M200 ∝
LXα, with
a slope α = 0.66 ± 0.14. These observations significantly
extend the dynamic range for which the halo masses of X-ray-selected
structures have been measured with weak gravitational lensing as shown
in Figure (31). Combining with other measurements
demonstrates that the M − LX relation is
well described by a single power law with α = 0.64 ± 0.03,
over two decades in mass: M200 ∼
1013.5 − 1015.5
h72−1 M⊙. These
results confirm that clusters do not follow the self-similar evolution
model with α = 0.75 proposed by
Kaiser (1986).
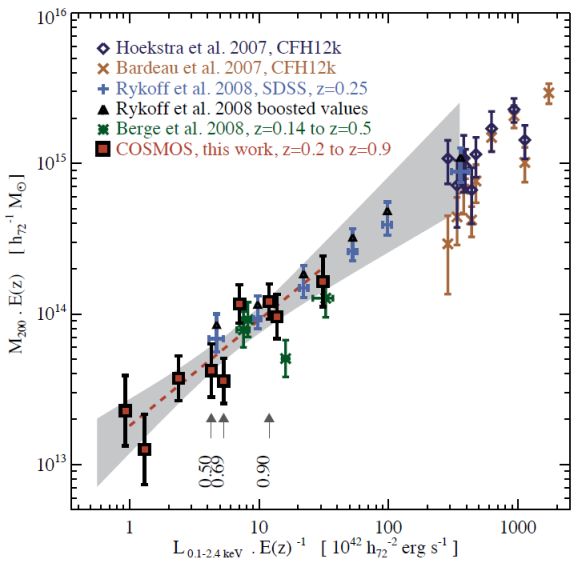
Figure 31. The COSMOS
M−LX relation from
Leauthaud et al. (2010).
Dark blue diamonds show individually detected clusters from
Hoekstra et al. (2007)
with updated masses from
Madhavi et al. (2008).
Sienna cross symbols show data points from
Bardeau et al. (2007).
Light blue plus symbols represent the
Rykoff et al. (2008)
results from a stacked analysis in the SDSS and black diamonds take
into account a recent correction to these masses due to a new
calibration of the source distribution. The upper error bars have been
adjusted to account for the redshift uncertainty. Green asterisks show
four data points at intermediate masses from
Berge et al. (2008).
Finally, the red squares depict our COSMOS results which extend
previous results to lower masses and to higher redshifts. Three arrows
highlight the highest redshift COSMOS data points. The grey shaded
region shows the upper and lower envelope of the ensemble of lines with
a slope and intercept that lie within the 68 percent confidence
region.