Copyright © 2017 by Annual Reviews. All rights reserved
| Annu. Rev. Astron. Astrophys. 2017. 55:343-387
Copyright © 2017 by Annual Reviews. All rights reserved |


The CDM paradigm as summarized in the previous section emerged among other dark matter variants in the early 1980s (Peebles 1982, Blumenthal et al. 1984, Davis et al. 1985) with model parameters gradually settling to their current precise state (including Λ) in the wake of overwhelming evidence from large-scale galaxy clustering, supernovae measurements of cosmic acceleration, and cosmic microwave background studies, among other data. The 1990s saw the first N-body simulations to resolve the internal structure of CDM halos on small scales. Almost immediately researchers pinpointed the two most well-known challenges to the theory: the cusp-core problem (Flores & Primack 1994, Moore 1994) and the missing satellites problem (Klypin et al. 1999b, Moore et al. 1999). This section discusses these two classic issues from a current perspective goes on to describe a third problem, too-big-to-fail (Boylan-Kolchin, Bullock & Kaplinghat 2011), which is in some sense is a confluence of the first two. Finally, we conclude this section with a more limited discussion of two other challenges faced by ΛCDM on small scales: the apparent planar distributions seen for Local Group satellites and the dynamical scaling relations seen in galaxy populations.
The highest-resolution cosmological simulations of MW-size halos in the ΛCDM paradigm have demonstrated that dark matter (DM) clumps exist at all resolved masses, with no break in the subhalo mass function down to the numerical convergence limit (e.g., Springel et al. 2008, Kuhlen, Madau & Silk 2009, Stadel et al. 2009, Garrison-Kimmel et al. 2014, Griffen et al. 2016). We expect thousands of subhalos with masses that are (in principle) large enough to have supported molecular cooling (Mpeak ≳ 107 M⊙). Meanwhile, only ∼ 50 satellite galaxies down to ∼ 300 M⊙ in stars are known to orbit within the virial radius of the Milky Way (Drlica-Wagner et al. 2015). Even though there is real hope that future surveys could bring the census of ultra-faint dwarf galaxies into the hundreds (Tollerud et al. 2008, Hargis, Willman & Peter 2014), it seems unlikely there are thousands of undiscovered dwarf galaxies to this limit within the virial volume of the Milky Way. The current situation is depicted in Figure 7, which shows the dark matter distribution around a Milky Way size galaxy as predicted by a ΛCDM simulation next to a map of the known galaxies of the Milky Way on the same scale.
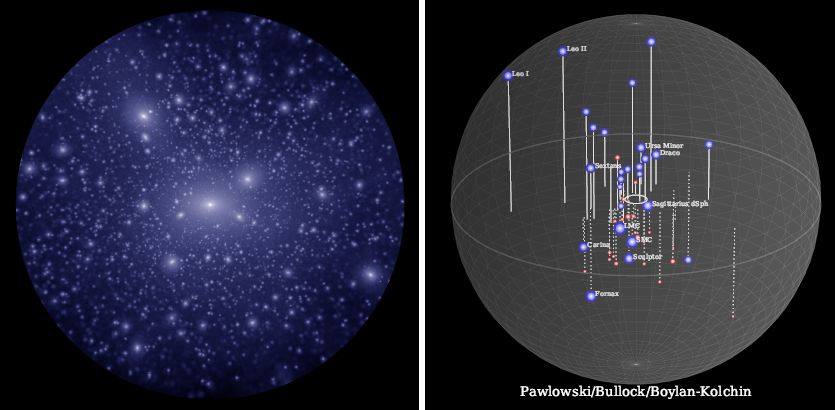 |
Figure 7. The Missing Satellites Problem: Predicted ΛCDM substructure (left) vs. known Milky Way satellites (right). The image on the left shows the ΛCDM dark matter distribution within a sphere of radius 250 kpc around the center of a Milky-Way size dark matter halo (simulation by V. Robles and T. Kelley in collaboration with the authors). The image on the right (by M. Pawlowski in collaboration with the authors) shows the current census of Milky Way satellite galaxies, with galaxies discovered since 2015 in red. The Galactic disk is represented by a circle of radius 15 kpc at the center and the outer sphere has a radius of 250 kpc. The 11 brightest (classical) Milky Way satellites are labeled by name. Sizes of the symbols are not to scale but are rather proportional to the log of each satellite galaxy’s stellar mass. Currently, there are ∼ 50 satellite galaxies of the Milky Way compared to thousands of predicted subhalos with Mpeak ≳ 107 M⊙. |
Given the discussion of abundance matching in Section 1.5 and the associated Figure 6, it is reasonable to expect that dark matter halos become increasingly inefficient at making galaxies at low masses and at some point go completely dark. Physical mass scales of interest in this regard include the mass below which reionization UV feedback likely suppresses gas accretion Mvir ≈ 109 M⊙ (Vmax ≳ 30 km s−1; e.g., Efstathiou 1992, Bullock, Kravtsov & Weinberg 2000, Benson et al. 2002, Bovill & Ricotti 2009, Sawala et al. 2016) and the minimum mass for atomic cooling in the early Universe, Mvir ≈ 108 M⊙ (Vmax ≳ 15 km s−1; see, e.g., Rees & Ostriker 1977). According to Figure 6, these physical effects are likely to become dominant in the regime of ultra-faint galaxies M⋆ ≲ 105 M⊙.
The question then becomes: can we simply adopt the abundance-matching relation derived from field galaxies to “solve” the Missing Satellites Problem down to the scale of the classical MW satellites (i.e., Mvir ≃ 1010 M⊙ ↔ M⋆ ≃ 106 M⊙)? Figure 8 (modified from Garrison-Kimmel et al. 2017a) shows that the answer is likely “yes.” Shown in magenta is the cumulative count of Milky Way satellite galaxies within 300 kpc of the Galaxy plotted down to the stellar mass completeness limit within that volume. The shaded band shows the 68% range predicted stellar mass functions from the dark-matter-only ELVIS simulations (Garrison-Kimmel et al. 2014) combined with the AM relation shown in Figure 6 with zero scatter. The agreement is not perfect, but there is no over-prediction. The dashed lines show how the predicted satellite stellar mass functions would change for different assumed (field galaxy) faint-end slopes in the calculating the AM relation. An important avenue going forward will be to push these comparisons down to the ultra-faint regime, where strong baryonic feedback effects are expected to begin shutting down galaxy formation altogether.
 |
Figure 8. “Solving” the Missing Satellites Problem with abundance matching. The cumulative count of dwarf galaxies around the Milky Way (magenta) plotted down to completeness limits from Garrison-Kimmel et al. (2017a). The gray shaded region shows the predicted stellar mass function from the dark-matter-only ELVIS simulations (Garrison-Kimmel et al. 2014) combined with the fiducial AM relation shown in Figure 6, assuming zero scatter. If the faint end slope of the stellar mass function is shallower (dashed) or steeper (dotted), the predicted abundance of satellites with M⋆ > 104 M⊙ throughout the Milky Way’s virial volume differs by a factor of 10. Local Group counts can therefore serve as strong constraints on galaxy formation models. |
2.2. Cusp, Cores, and Excess Mass
As discussed in Section 1, ΛCDM simulations that include only dark matter predict that dark matter halos should have density profiles that rise steeply at small radius ρ(r) ∝ r−γ, with γ ≃ 0.8−1.4 over the radii of interest for small galaxies (Navarro et al. 2010). This is in contrast to many (though not all) low-mass dark-matter-dominated galaxies with well-measured rotation curves, which prefer fits with constant-density cores (γ ≈ 0−0.5; e.g., McGaugh, Rubin & de Blok 2001, Marchesini et al. 2002, Simon et al. 2005, de Blok et al. 2008, Kuzio de Naray, McGaugh & de Blok 2008). A related issue is that fiducial ΛCDM simulations predict more dark matter in the central regions of galaxies than is measured for the galaxies that they should host according to AM. This “central density problem” is an issue of normalization and exists independent of the precise slope of the central density profile (Alam, Bullock & Weinberg 2002, Oman et al. 2015). While these problems are in principle distinct issues, as the second refers to a tension in total cumulative mass and the first is an issue with the derivative, it is likely that they point to a common tension. Dark-matter-only ΛCDM halos are too dense and too cuspy in their centers compared to many observed galaxies.
Figure 9 summarizes the basic problem. Shown as a dashed line is the typical circular velocity curve predicted for an NFW ΛCDM dark matter halo with Vmax ≈ 40 km s−1 compared to the observed rotation curves for two galaxies with the same asymptotic velocity from Oh et al. 2015. The observed rotation curves rise much more slowly than the ΛCDM expectation, reflecting core densities that are lower and more core-like than the fiducial prediction.
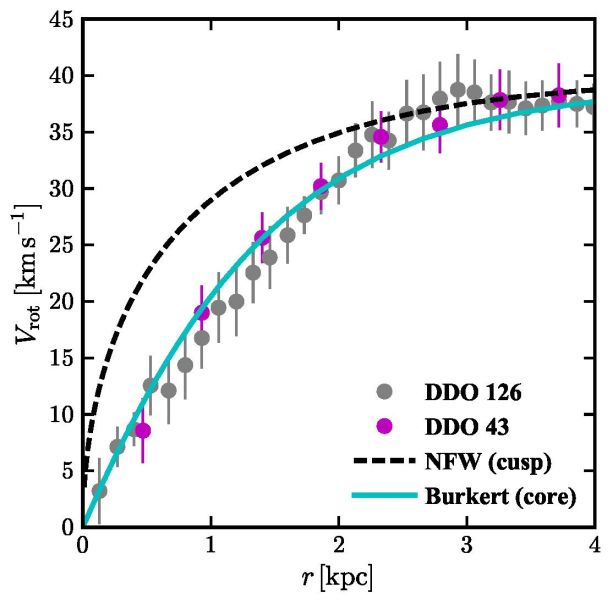 |
Figure 9. The Cusp-Core problem. The dashed line shows the naive ΛCDM expectation (NFW, from dark-matter-only simulations) for a typical rotation curve of a Vmax ≈ 40 km s−1 galaxy. This rotation curve rises quickly, reflecting a central density profile that rises as a cusp with ρ ∝ 1/r. The data points show the rotation curves of two example galaxies of this size from the LITTLE THINGS survey (Oh et al. 2015), which are more slowly rising and better fit by a density profile with a constant density core (Burkert 1995, cyan line). |
As discussed above, a straightforward and natural solution to the missing satellites problem within ΛCDM is to assign the known Milky Way satellites to the largest dark matter subhalos (where largest is in terms of either present-day mass or peak mass) and attribute the lack of observed galaxies in in the remaining smaller subhalos to galaxy formation physics. As pointed out by Boylan-Kolchin, Bullock & Kaplinghat 2011, this solution makes a testable prediction: the inferred central masses of Milky Way satellites should be consistent with the central masses of the most massive subhalos in ΛCDM simulations of Milky Way-mass halos. Their comparison of observed central masses to ΛCDM predictions from the Aquarius (Springel et al. 2008) and Via Lactea II (Diemand et al. 2008) simulations revealed that the most massive ΛCDM subhalos were systematically too centrally dense to host the bright Milky Way satellites (Boylan-Kolchin, Bullock & Kaplinghat 2011, Boylan-Kolchin, Bullock & Kaplinghat 2012). While there are subhalos with central masses comparable to the Milky Way satellites, these subhalos were never among the ∼10 most massive (Figure 10). Why would galaxies fail to form in the most massive subhalos, yet form in dark matter satellites of lower mass? The most massive satellites should be “too big to fail” at forming galaxies if the lower-mass satellites are capable of doing so (thus the origin of the name of this problem). In short, while the number of massive subhalos in dark-matter-only simulations matches the number of classical dwarfs observed (see Figure 8), the central densities of these simulated dwarfs are higher than the central densities observed in the real galaxies (see Figure 10).
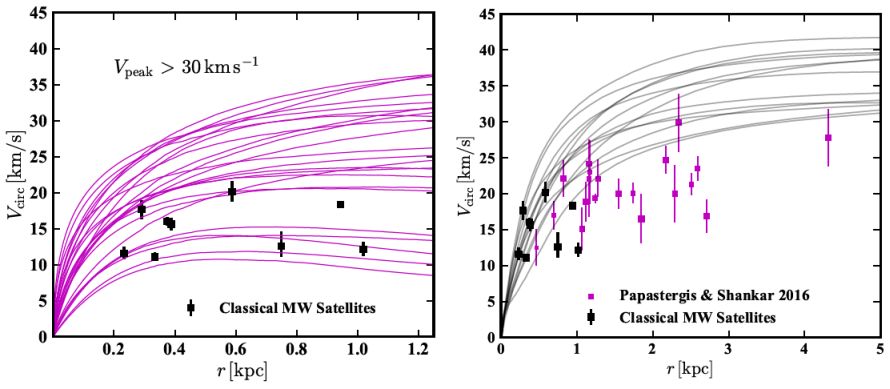 |
Figure 10. The Too-Big-to-Fail Problem. Left: Data points show the circular velocities of classical Milky Way satellite galaxies with M⋆ ≃ 105−7 M⊙ measured at their half-light radii r1/2. The magenta lines show the circular velocity curves of subhalos from one of the (dark matter only) Aquarius simulations. These are specifically the subhalos of a Milky Way-size host that have peak maximum circular velocities Vmax > 30 km s−1 at some point in their histories. Halos that are this massive are likely resistant to strong star formation suppression by reionization and thus naively too big to have failed to form stars (modified from Boylan-Kolchin, Bullock & Kaplinghat 2012). The existence of a large population of such satellites with greater central masses than any of the Milky Way's dwarf spheroidals is the original Too-Big-to-Fail problem. Right: The same problem – a mismatch between central masses of simulated dark matter systems and observed galaxies – persists for field dwarfs (magenta points), indicating it is not a satellite-specific process (modified from Papastergis & Ponomareva 2017). The field galaxies shown all have stellar masses in the range 5.75 ≤ log10(M⋆ / M⊙) ≤ 7.5. The gray curves are predictions for ΛCDM halos from the fully self-consistent hydrodynamic simulations of Fitts et al. (2016) that span the same stellar mass range in the simulations as the observed galaxies. |
While too-big-to-fail was originally identified for satellites of the Milky Way, it was subsequently found to exist in Andromeda (Tollerud, Boylan-Kolchin & Bullock 2014) and field galaxies in the Local Group (those outside the virial radius of the Milky Way and M31; Kirby et al. 2014). Similar discrepancies were also pointed out for more isolated low-mass galaxies, first based on HI rotation curve data (Ferrero et al. 2012) and subsequently using velocity width measurements (Papastergis et al. 2015, Papastergis & Shankar 2016). This version of too-big-to-fail in the field is also manifested in the velocity function of field galaxies 4 (Zavala et al. 2009, Klypin et al. 2015, Trujillo-Gomez et al. 2016, Schneider et al. 2016, though see Macciò et al. 2016 and Brooks et al. 2017 for arguments that no discrepancy exists). The generic observation in the low-redshift Universe, then, is that the inferred central masses of galaxies with 105 ≲ M⋆ / M⊙ ≲ 108 are ∼ 50% smaller than expected from dissipationless ΛCDM simulations.
The too-big-to-fail and core/cusp problems would be naturally connected if low-mass galaxies generically have dark matter cores, as this would reduce their central densities relative to CDM expectations 5. However, the problems are, in principle, separate: one could imagine galaxies that have large constant-density cores yet still with too much central mass relative to CDM predictions (solving the core/cusp problem but not too-big-to-fail), or having cuspy profiles with overall lower density amplitudes than CDM (solving too-big-to-fail but not core/cusp).
Kunkel & Demers (1976) and Lynden-Bell (1976) pointed out that satellite galaxies appeared to lie in a polar great circle around the Milky Way. Insofar as this cannot be explained in a theory of structure formation, this observation pre-dates all other small-scale structure issues in the Local Group by approximately two decades. The anisotropic distribution of Galactic satellites received scant attention until a decade ago, when Kroupa, Theis & Boily (2005) argued that it proved that satellite galaxies cannot be related to dark matter substructures (and thereby constituted another crisis for CDM). Kroupa et al. examined classical, pre-SDSS dwarf galaxies in and around the Milky Way and found that the observed distribution was strongly non-spherical. From this analysis, based on the distribution of angles between the normal of the best-fitting plane of dwarfs and the position vector of each MW satellite in the Galacto-centric reference frame, Kroupa et al. argued that “the mismatch between the number and spatial distribution of MW dwarves compared to the theoretical distribution challenges the claim that the MW dwarves are cosmological sub-structures that ought to populate the MW halo.”
This claim was quickly disputed by Zentner et al. (2005), who investigated the spatial distribution of dark matter subhalos in simulated CDM halos and determined that it was highly inconsistent with a spherical distribution. They found that the planar distribution of MW satellites was marginally consistent with being a random sample of the subhalo distributions in their simulations, and furthermore, the distribution of satellites they considered likely to be luminous (corresponding to the more massive subhalos) was even more consistent with observations. A similar result was obtained at roughly the same time by Kang et al. (2005). Slightly later, Metz, Kroupa & Jerjen (2007) argued that the distribution of MW satellite galaxies was inconsistent, at the 99.5% level, with isotropic or prolate substructure distributions (as might be expected in ΛCDM).
Related analysis of Milky Way satellite objects has further supported the idea that the configuration is highly unusual compared to ΛCDM subhalo distributions (Pawlowski, Pflamm-Altenburg & Kroupa 2012), with the 3D motions of satellites suggesting that there is a preferred orbital pole aligned perpendicular to the observed spatial plane (Pawlowski & Kroupa 2013). The left hand side of Figure 11 shows the current distribution of satellites (galaxies and star clusters) around the Milky Way looking edge-on at the planar configuration. Note that the disk of the Milky Way could, in principle, bias discoveries away from the MW disk axis, but it is not obvious that the orbital poles would be biased by this effect. Taken together, the orbital poles and spatial configuration of MW satellites is highly unusual for a randomly drawn sample of ΛCDM subhalos (Pawlowski et al. 2015).
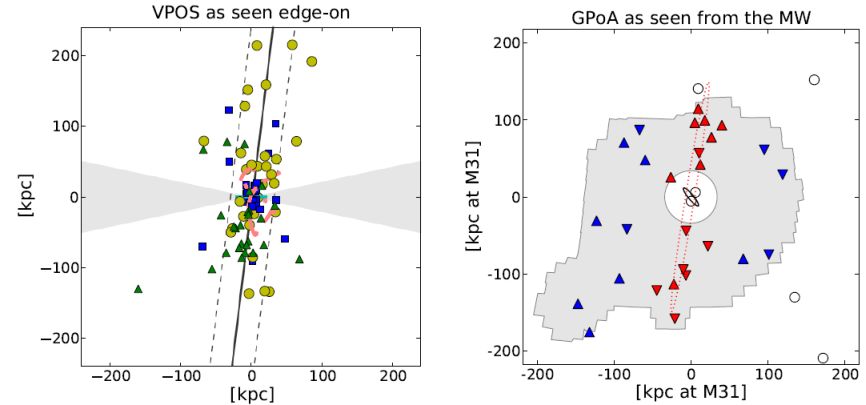 |
Figure 11. Planes of Satellites. Left: Edge-on view of the satellite distribution around the Milky Way (updated from Pawlowski, McGaugh & Jerjen 2015) with the satellite galaxies in yellow, young halo globular clusters and star clusters in blue, and all other newly-discovered objects (unconfirmed dwarf galaxies or star clusters) are shown as green triangles. The red lines in the center dictate the position and orientation of streams in the MW halo. The gray wedges span 24 degrees about the plane of the MW disk, where satellite discovery might be obscured by the Galaxy. Right: The satellite distribution around Andromeda (modified by M. Pawlowski from Ibata et al. 2013) where the red points are satellites belonging to the identified kinematic plane. Triangles pointing up are receding relative to M31. Triangles pointing down are approaching. |
As shown in the right-hand panel of Figure 11, the M31 satellite galaxies also show evidence for having a disk-like configuration (Metz, Kroupa & Jerjen 2007). Following the discovery of new M31 satellites and the characterization of their velocities, Conn et al. (2013) and Ibata et al. (2013) presented evidence that 15 of 27 Andromeda dwarf galaxies indeed lie in a thin plane, and further, that the southern satellites are mostly approaching us with respect to M31, while the northern satellites are mostly receding (as coded by the direction of the red triangles in Figure 11). This suggests that the plane could be rotationally supported. Our view of this plane is essentially edge-on, meaning we have excellent knowledge of in-plane motions and essentially no knowledge of velocities perpendicular to the plane. Nevertheless, even a transient plane of this kind would be exceedingly rare for ΛCDM subhalos (e.g., Ahmed, Brooks & Christensen 2017).
Work in a similar vein has argued for the existence of planar structures in the Centaurus A group (Tully et al. 2015) and for rotationally-supported systems of satellites in a statistical sample of galaxies from the SDSS (Ibata et al. 2015). Libeskind et al. 2015 have used ΛCDM simulations to suggest that some alignment of satellite systems in the local Universe may be naturally explained by the ambient shear field, though they cannot explain thin planes this way. Importantly, Phillips et al. (2015) have re-analyzed the SDSS data and argued that it is not consistent with a ubiquitous co-rotating satellite population and rather more likely a statistical fluctuation. More data that enables a statistical sample of hosts down to fainter satellites will be needed to determine whether the configurations seen in the Local Group are common.
2.5. Regularity in the Face of Diversity
Among the more puzzling aspects of galaxy phenomenology in the context of ΛCDM are the tight scaling relations between dynamical properties and baryonic properties, even within systems that are dark matter dominated. One well-known example of this is the baryonic Tully-Fisher relation (McGaugh 2012), which shows a remarkably tight connection between the total baryonic mass of a galaxy (gas plus stars) and its circular velocity Vflat (≃ Vmax): Mb ∝ Vflat4. Understanding this correlation with ΛCDM models requires care for the low-mass galaxies of most concern in this review (Brook, Santos-Santos & Stinson 2016).
A generalization of the baryonic Tully-Fisher relation known as the radial acceleration relation (RAR) was recently introduced by McGaugh, Lelli & Schombert (2016). Plotted in left-hand Figure 12, the RAR shows a tight correlation between the radial acceleration traced by rotation curves (gobs = V2 / r) and that predicted solely by the observed distribution of baryons (gbar) 6. The upper right “high-acceleration” portion of the relation correspond to baryon-dominated regions of (mostly large) galaxies. Here the relation tracks the one-to-one line, as it must. However, rotation curve points begin to peel away from the line, towards an acceleration larger than what can be explained by the baryons alone below a characteristic acceleration of a0 ≃ 10−10 m s−2. It is this additional acceleration that we attribute to dark matter. The outer parts of large galaxies contribute to this region, as do virtually all parts of small galaxies. It is surprising, however, that the dark matter contribution in the low-acceleration regime tracks the baryonic distribution so closely, particularly in light of the diversity in galaxy rotation curves seen among galaxies of at a fixed Vflat, as we now discuss.
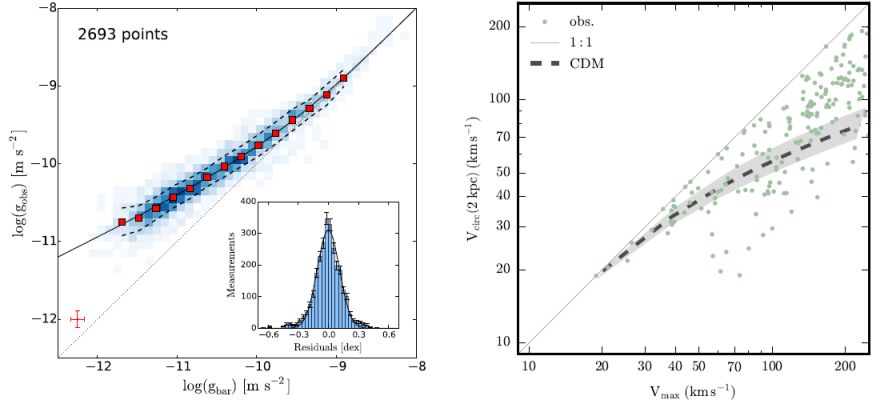 |
Figure 12. Regularity vs. Diversity. Left: The radial acceleration relation from McGaugh, Lelli & Schombert (2016, slightly modified) showing the centripetal acceleration observed in rotation curves, gobs = V2 / r, plotted versus the expected acceleration from observed baryons gbar for 2700 individual data points from 153 galaxy rotation curves. Large squares show the mean and the dashed line lines show the rms width. Right: Green points show the circular velocities of observed galaxies measured at 2 kpc as a function of Vmax from Oman et al. (2015) as re-created by Creasey et al. (2017). For comparison, the gray band shows expectations from dark matter only ΛCDM simulations. There is much more scatter at fixed Vmax than predicted by the simulations. Note that the galaxies used in the RAR in left-hand panel have Vmax values that span the range shown on the right. The tightness of the acceleration relation is remarkable (consistent with zero scatter given observational error, red cross), especially given the variation in central densities seen on the right. |
The right-hand panel of Figure 12 illustrates the diversity in rotation curve shapes seen from galaxy to galaxy. Shown is a slightly modified version of a figure introduced by Oman et al. (2015) and recreated by Creasey et al. (2017). Each data point corresponds to a single galaxy rotation curve. The horizontal axis shows the observed value of Vflat (≈ Vmax) for each galaxy and the vertical axis plots the value of the circular velocity at 2 kpc from the galaxy center. Note that at fixed Vflat, galaxies demonstrate a huge diversity in central densities. Remarkably, this diversity is apparently correlated with the baryonic content in such a way as to drive the tight relation seen on the left. The gray band in the right panel shows the expected relationship between Vmax and Vc(2 kpc) for halos in ΛCDM dark-matter-only simulations. Clearly, the real galaxies demonstrate much more diversity than is naively predicted.
The real challenge, as we see it, is to understand how galaxies can have so much diversity in their rotation curve shapes compared to naive ΛCDM expectations while also yielding tight correlations with baryonic content. The fact that there is a tight correlation with baryonic mass and not stellar mass (which presumably correlates more closely with total feedback energy) makes the question all the more interesting.
4 We note that the mismatch between the observed and predicted velocity function can also be interpreted as a “missing dwarfs” problem if one considers the discrepancy as one in numbers at fixed Vhalo. We believe, however, that the more more plausible interpretation is a discrepancy in Vhalo at fixed number density. Back.
5 For a sense of the problem, the amount of mass that would need to be removed to alleviate the issue on classical dwarf scales is ∼ 107 M⊙ within ∼ 300 pc. Back.
6 This type of relation is what is generally expected in MOND, though the precise shape of the relation depends on the MOND interpolation function assumed (see McGaugh, Lelli & Schombert 2016 for a brief discussion). Back.