Copyright © 2017 by Annual Reviews. All rights reserved
| Annu. Rev. Astron. Astrophys. 2017. 55:343-387
Copyright © 2017 by Annual Reviews. All rights reserved |


In this subsection, we explore some of the most popular and promising solutions to the problems discussed above. We take as our starting point the basic ΛCDM model plus reionization, i.e., we take it as a fundamental prediction of ΛCDM that the heating of the intergalactic medium to ∼ 104 K by cosmic reionization will suppress galaxy formation in halos with virial temperatures below ∼104 K (or equivalently, with Vvir ≲ 20 km s−1) at z ≲ 6.
3.1.1. Feedback-induced cores. Many of the most advanced hydrodynamic simulations today have shown that it is possible for baryonic feedback to erase the central cusps shown in the density profiles in Figure 3 and produce core-like density profiles as inferred from rotation curves such as those shown in Figure 9 (Mashchenko, Wadsley & Couchman 2008, Pontzen & Governato 2012, Madau, Shen & Governato 2014, Oñorbe et al. 2015, Read, Agertz & Collins 2016). One key prediction is that the effect of core creation will vary with the mass in stars formed (Governato et al. 2012, Di Cintio et al. 2014). If galaxies form enough stars, there will be enough supernovae energy to redistribute dark matter and create significant cores. If too many baryons end up in stars, however, the excess central mass can compensate and drag dark matter back in. At the other extreme, if too few stars are formed, there will not be enough energy in supernovae to alter halo density structure and the resultant dark matter distribution will resemble dark-matter-only simulations. While the possible importance of supernova-driven blowouts for the central dark matter structure of dwarf galaxies was already appreciated by Navarro, Eke & Frenk (1996) and Gnedin & Zhao (2002), an important recent development is the understanding that even low-level star formation over an extended period can drive gravitational potential fluctuations that lead to dark matter core formation.
This general behavior is illustrated in Figure 13, which shows the impact of baryonic feedback on the inner slopes of dark matter halos α measured at 1−2% of the halo virial radii. Core-like density profiles have α → 0. The magenta stars show results from the NIHAO hydrodynamic simulations as a function of M⋆ / Mvir, the ratio of stellar mass to the total halo mass (Tollet et al. 2016). The cyan stars show results from an entirely different set of simulations from the FIRE-2 collaboration (Wetzel et al. 2016, Fitts et al. 2016, Garrison-Kimmel et al. 2017b, Chan et al., in preparation). The shaded gray band shows the expected slopes for NFW halos with the predicted range of concentrations from dark-matter-only simulations. We see that both sets of simulations find core formation to be fairly efficient M⋆ / Mvir ≈ 0.005. This “peak core formation” ratio maps to M⋆ ≃ 108−9 M⊙, corresponding to the brightest dwarfs. At ratios below M⋆ / Mvir ≈ 10−4, however, the impact of baryonic feedback is negligible. The ratio below which core formation is difficult corresponds to M⋆ ≈ 106 M⊙ – the mass-range of interest for the too-big-to-fail problem.
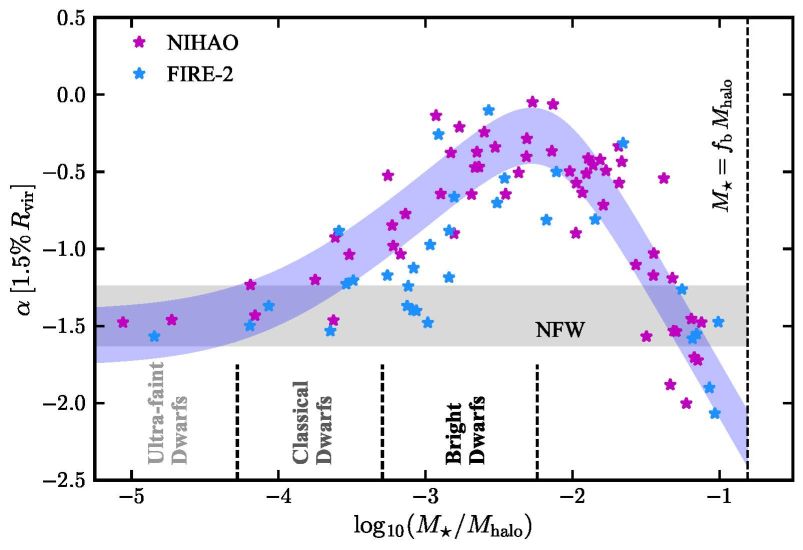 |
Figure 13. The impact of baryonic feedback on the inner profiles of dark matter halos. Plotted is the inner dark matter density slope α at r = 0.015 Rvir as a function of M⋆ / Mvir for simulated galaxies at z = 0. Larger values of α ≈ 0 imply core profiles, while lower values of α ≲ 0.8 imply cusps. The shaded gray band shows the expected range of dark matter profile slopes for NFW profiles as derived from dark-matter-only simulations (including concentration scatter). The filled magenta stars and shaded purple band (to guide the eye) show the predicted inner density slopes from the NIHAO cosmological hydrodynamic simulations by Tollet et al. (2016). The cyan stars are a similar prediction from an entirely different suite of simulations from the FIRE-2 simulations (Fitts et al. 2016, Hopkins et al. 2017, Chan et al., in preparation). Note that at dark matter core formation peaks in efficiency at M⋆ / Mvir ≈ 0.005, in the regime of the brightest dwarfs. Both simulations find that for M⋆ / Mvir ≲ 10−4, the impact of baryonic feedback is negligible. This critical ratio below which core formation via stellar feedback is difficult corresponds to the regime of classical dwarfs and ultra-faint dwarfs. |
The effect of feedback on density profile shapes as a function of stellar mass is further illustrated in Figure 14. Here we show simulation results from Fitts et al. (2016) for three galaxies (from a cosmological sample of fourteen), all formed in halos with Mvir(z = 0) ≈ 1010 M⊙ using the FIRE-2 galaxy formation prescriptions (Hopkins et al. 2014 and in preparation). The dark matter density profiles of the resultant hydrodynamical runs are shown as solid black lines in each panel, with stellar mass labeled, increasing from left to right. The dashed lines in each panel show dark-matter-only versions of the same halos. We see that only in the run that forms the most stars (M⋆ ≈ 107 M⊙, M⋆ / Mvir ≈ 10−3) does the feedback produce a large core. Being conservative, for systems with M⋆ / Mvir ≲ 10−4, feedback is likely to be ineffective in altering dark matter profiles significantly compared to dark-matter-only simulations.
 |
Figure 14. Dark matter density profiles from full hydrodynamic FIRE-2 simulations (Fitts et al. 2016). Shown are three different galaxy halos, each at mass Mvir ≈ 1010 M⊙. Solid lines show the hydro runs while the dashed show the same halos run with dark matter only. The hatched band at the left of each panel marks the region where numerical relaxation may artificially modify density profiles and the vertical dotted line shows the half-light radius of the galaxy formed. The stellar mass of the galaxy formed increases from left to right: M⋆ ≈ 5 × 10⁵, 4 × 10⁶, and 107 M⊙, respectively. As M⋆ increases, so does the effect of feedback. The smallest galaxy has no effect on the density structure of its host halo. |
SCALE WHERE FEEDBACK BECOMES INEFFECTIVE IN
PRODUCING CORES]
|
It is important to note that while many independent groups are now obtaining similar results in cosmological simulations of dwarf galaxies (Governato et al. 2012, Munshi et al. 2013, Madau, Shen & Governato 2014, Chan et al. 2015, Oñorbe et al. 2015, Tollet et al. 2016, Fitts et al. 2016) – indicating a threshold mass of M⋆ ∼ 106 M⊙ or Mvir ∼ 1010 M⊙ – this is not an ab initio ΛCDM prediction, and it depends on various adopted parameters in galaxy formation modeling. For example, Sawala et al. (2016) do not obtain cores in their simulations of dwarf galaxies, yet they still produce systems that match observations well owing to a combination of feedback effects that lower central densities of satellites (thereby avoiding the too-big-to-fail problem). On the other hand, the very high resolution, non-cosmological simulations presented in Read, Agertz & Collins (2016) produce cores in galaxies of all stellar masses. We note that Read et al.'s galaxies have somewhat higher M⋆ at a given Mvir than the cosmological runs described cited above; this leads to additional feedback energy per unit dark matter mass, likely explaining the differences with cosmological simulations and pointing to a testable prediction for dwarf galaxies’ M⋆ / Mvir.
3.1.2. Resolving too-big-to-fail. The baryon-induced cores described in Section 3.1.1 have their origins in stellar feedback. The existence of such cores for galaxies above the critical mass scale of M⋆ ≈ 106 M⊙ would explain why ∼half of the classical Milky Way dwarfs – those above this mass – have low observed densities. However, about half of the MW’s classical dwarfs have M⋆ < 106 M⊙, so the scenario described in Section 3.1.1 does not explain these systems’ low central masses. Several other mechanisms exist to reconcile ΛCDM with the internal structure of low-mass halos, however.
Interactions between satellites and the Milky Way – tidal stripping, disk shocking, and ram pressure stripping – all act as additional forms of feedback that can reduce the central masses of satellites. Many numerical simulations of galaxy formation point to the importance of such interactions (which are generally absent in dark-matter-only simulations 7), and these environmental influences are often invoked in explaining too-big-to-fail (e.g., Zolotov et al. 2012, Arraki et al. 2014, Brooks & Zolotov 2014, Brook & Di Cintio 2015, Wetzel et al. 2016, Tomozeiu, Mayer & Quinn 2016, Sawala et al. 2016, Dutton et al. 2016). In many of these papers, environmental effects are limited to 1-2 virial radii from the host galaxy. Several Local Group galaxies reside at greater distances. While only a handful of these systems have M⋆ < 106 M⊙ (most are M⋆ ∼ 107 M⊙), these galaxies provide an initial test of the importance of external feedback: if environmental factors are key in setting the central densities of low-mass systems, satellites should differ systematically from field galaxies. The results of Kirby et al. (2014) find no such difference; further progress will likely have to await the discovery of fainter systems an larger optical telescopes to provide spectroscopic samples for performing dynamical analyses. Other forms of feedback may persist to larger distances. For example, Benítez-Llambay et al. (2013) note that “cosmic web stripping” (ram pressure from large-scale filaments or pancakes) may be important in dwarf galaxy evolution.
None of these solutions would explain too-big-to-fail in isolated field dwarfs. However, a number of factors could influence the conversion between observed HI line widths and the underlying gravitational potential, complicating the interpretation of systematically low densities (for a discussion of some of these issues, see Papastergis & Ponomareva 2017). Some examples are: (1) gas may not have the radial extent necessary to reach the maximum of the dark matter halo rotation curve; (2) the contribution of non-rotational support (pressure from turbulent motions) may be non-negligible and not correctly handled; and (3) determinations of inclinations angles of galaxies may be systematically wrong. Macciò et al. (2016) find good agreement between their simulations and the observed abundance of field dwarf galaxies in large part because the gas distributions in the simulated dwarfs do not extend to the peak of the dark matter rotation curve (see also Kormendy & Freeman 2016 for a similar conclusion reached via different considerations). A more complete understanding of observational samples and very careful comparisons between observations and simulations are crucial for quantifying the magnitude of any discrepancies between observations and theory.
3.1.3. Explaining planes. Even prior to the Ibata et al. (2013) result on the potential rotationally-supported plane in M31, multiple groups continued to study the observed distribution of satellite galaxies, their orbits, and the consistency of these with ΛCDM. Libeskind et al. (2009) and Lovell et al. (2011) argued that the MW satellite configuration and orbital distribution are consistent with predictions from ΛCDM simulations, while Metz, Kroupa & Jerjen (2009) and Pawlowski, Pflamm-Altenburg & Kroupa (2012) argued that evidence of a serious discrepancy had only become stronger. A major point of disagreement was whether or not filamentary accretion within ΛCDM is sufficient to explain satellite orbits. Given that SDSS only surveyed about 1/3 of the northern sky (centered on the North Galactic Pole, thereby focusing on the portion of the sky where the polar plane was claimed to lie), areal coverage was a serious concern when trying to understand the significance of the polar distribution of satellites. DES has mitigated this concern somewhat, but it is also surveying near the polar plane. Pawlowski (2016) has recently argued that incomplete sky coverage is not the driving factor in assessing phase-space alignments in the Milky Way; future surveys with coverage nearer the Galactic plane should definitively test this assertion.
Following Ibata et al. (2013), the question of whether the M31 configuration (right-hand side of Figure 11) is expected in ΛCDM also became a topic of substantial interest. The general consensus of work rooted in ΛCDM is that planes qualitatively similar (though not as thin) as the M31 plane are not particularly uncommon in ΛCDM simulations, but that these planes are not rotationally-supported structures (e.g., Bahl & Baumgardt 2014, Gillet et al. 2015, Buck, Dutton & Macciò 2016). Since we view the M31 plane almost perfectly edge-on, proper motions of dwarf galaxies in the plane would provide a clean test of its nature. Should this plane turn out to be rotationally supported, it would be extremely difficult to explain with our current understanding of the ΛCDM model. These proper motions may be possible with a combination of Hubble and James Webb Space Telescope data. Skillman et al. (2017) presented preliminary observations of three plane and three non-plane galaxies, finding no obvious differences between the two sets of galaxies. Future observations of this sort could help shed light on the M31 plane and its nature.
3.1.4. Explaining the radial acceleration relation. Almost immediately after McGaugh, Lelli & Schombert (2016) published their RAR relation paper, Keller & Wadsley (2017) responded by demonstrating that a similar relation can be obtained using ΛCDM hydrodynamic simulations of disk galaxies. Importantly, however, the systems simulated did not include low-mass galaxies, which are dark-matter-dominated throughout. The smallest galaxies are the ones with low acceleration in their centers as well as in their outer parts, and they remain the most puzzling to explain (see Milgrom 2016 for a discussion related to this issue).
More recently, Navarro et al. (2016) have argued that ΛCDM can naturally produce an acceleration relation similar to that shown in Figure 12. A particularly compelling section of their argument follows directly from abundance-matching (Figure 6): the most massive disk galaxies that exist are not expected to be in halos much larger than 5 × 10¹² M⊙. This sets a maximum acceleration scale (∼ 10−10 m s−2) above which any observed acceleration must track the baryonic acceleration. The implication is that any mass-discrepancy attributable to dark matter will only begin to appear at accelerations below this scale. Stated slightly differently, any successful model of galaxy formation set within a ΛCDM context must produce a relation that begins to peel above the one-to-one only below the characteristic scale observed.
It remains to be seen whether the absolute normalization and shape of the RAR in the low-acceleration regime can be reproduced in ΛCDM simulations that span the full range of galaxy types that are observed to obey the RAR. As stated previously, these same simulations must also simultaneously reproduce the observed diversity of galaxies at fixed Vmax that is seen in the data (e.g., as shown in the right-panel of Figure 12).
3.2. Solutions requiring modifications to ΛCDM
3.2.1. Modifying linear theory predictions. As discussed in Section 1.6, the dominant impact of dark matter particle nature on the linear theory power spectrum for CDM models is in the high-k cut-off (see labeled curves in Figure 2). This cut-off is set by the free-streaming or collisional damping scale associated with CDM and is of order 1 comoving pc (corresponding to perturbations of 10−6 M⊙) for canonical WIMPs (Green, Hofmann & Schwarz 2004) or 0.001 comoving pc (corresponding to 10−15 M⊙) for a m ≈ 10 µeV QCD axion (Nambu & Sasaki 1990). In these models, the dark matter halo hierarchy should therefore extend 18 to 27 orders of magnitude below the mass scale of the Milky Way (1012 M⊙; see Fig. 2).
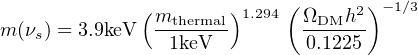
A variety of dark matter models result in a truncation of linear perturbations at much larger masses, however. For example, WDM models have an effective free-streaming length λfs that scales inversely with particle mass (Bode, Ostriker & Turok 2001, Viel et al. 2005); in the Planck (2016) cosmology, this relation is approximately
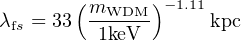 |
(8) |
and the corresponding free-streaming mass is
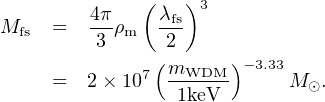 |
(9) |
The effects of power spectrum truncation are not limited to the free-streaming scale, however: power is substantially suppressed for significantly larger scales (smaller wavenumbers k). A characterization of the scale at which power is significantly affected is given by the half-mode scale khm = 2 π / λhm, where the transfer function is reduced by 50% relative to CDM. The half-mode wavelength λhm is approximately fourteen times larger than the free-streaming length (Schneider et al. 2012), meaning that structure below ∼ 5 × 10¹⁰ M⊙ is significantly different from CDM in a 1 keV thermal dark matter model:
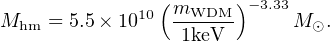 |
(10) |
Examples of power suppression for several thermal WDM models are shown by the dashed, dotted, and dash-dotted lines in Fig. 2.
The lack of small-scale power in models with warm (or hot) dark matter is a testable prediction. As the free-streaming length is increased and higher-mass dark matter substructure is erased, the expected number of dark matter satellites inside of a Milky Way-mass halo decreases. The observed number of dark-matter-dominated satellites sets a lower limit on the number of subhalos within the Milky Way, and therefore, a lower limit on the warm dark matter particle mass. Polisensky & Ricotti (2011) find this constraint is m > 2.3 keV (95% confidence) while Lovell et al. (2014) find m > 1.6 keV; these differences come from slightly different cosmologies, assumptions about the mass of the Milky Way's dark matter halo, and modeling of completeness limits for satellite detections.
It is important to note that particle mass and the free-streaming scale are not uniquely related: the free-streaming scale depends on the particle production mechanism and is set by the momentum distribution of the dark matter particles. For example, a resonantly-produced sterile neutrino can have a much “cooler” momentum distribution than a particle of the same mass that is produced by a process in thermal equilibrium (Shi & Fuller 1999). Constraints therefore must be computed separately for each production mechanism (Merle & Schneider 2015, Venumadhav et al. 2016). As an example, the effects of Dodelson-Widrow (1994) sterile neutrinos, which are produced through non-resonant oscillations from active neutrinos, can be matched to effects of thermal relics via the following relation:
 |
(11) |
(Abazajian 2006, Bozek et al. 2016).
The effects of power spectrum suppression are not limited to pure number counts of dark matter halos: since cosmological structure form hierarchically, the erasure of small perturbations affects the collapse of more massive objects. The primary result of this effect is to delay the assembly of halos of a given mass relative to the case of no power spectrum suppression. Since the central densities of dark matter halos reflect the density of the Universe at the time of their formation, models with reduced small-scale power also result in shallower central gravitational potentials at fixed total mass for halos within 2-3 dex of the free-streaming mass. This effect is highlighted in the lower-middle panel of Figure 15. It compares Vmax values for a CDM simulation and a WDM simulation that assumes a thermal-equivalent mass of 2 keV but is otherwise identical to the CDM simulation. Massive halos (Vmax ≳ 50 km s−1) have identical structure; at lower masses, WDM halos have systematically lower Vmax values than their CDM counterparts. This effect comes from a reduction of Vmax for a given halo in the WDM runs, not from there being fewer objects. The reduction in central density due to power spectrum suppression for halos near or just below the half-mode mass (but significantly more massive than the free-streaming mass) is how WDM can solve the too-big-to-fail problem (Anderhalden et al. 2013).
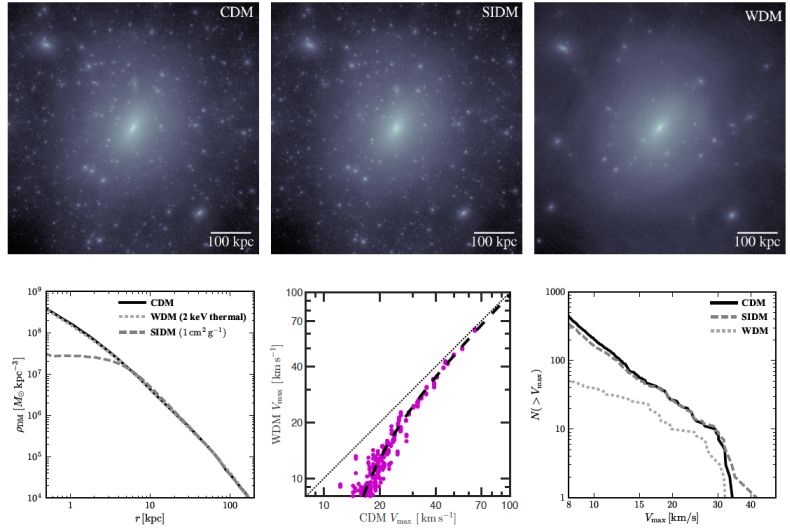 |
Figure 15. Dark matter phenomenology in the halo of the Milky Way. The three images in the upper row show the same Milky-Way-size dark matter halo simulated with CDM, SIDM (σ/m = 1 cm2 / g), and WDM (a Shi-Fuller resonant model with a thermal equivalent mass of 2 keV). The left panel in the bottom row shows the dark matter density profiles of the same three halos while the bottom-right panel shows the subhalo velocity functions for each as well. The middle panel on the bottom shows that while the host halos have virtually identical density structure in WDM and CDM, individual subhalos identified in both simulations smaller Vmax values in WDM (Bozek et al. 2016). This effect can explain the bulk of the differences seen in the Vmax functions (bottom right panel). Note that SIDM does not reduce the abundance of substructure (unless the power spectrum is truncated) but it does naturally produce large constant-density cores in the dark matter distribution. WDM does not produce large constant-density cores at Milky Way-mass scales but does result in fewer subhalos near the free-streaming mass and reduces Vmax of a given subhalo (through reduced concentration) near the half-mode mass (Mhalo ≲ 1010 M⊙ for the plotted 2 keV thermal equivalent model). |
3.2.2. Modifying non-linear predictions. The non-linear evolution of CDM is described by the Collisionless Boltzmann equation. Gravitational interactions are the only ones that are relevant for CDM particles, and these interactions operate in the mean field limit (that is, gravitational interactions between individual DM particles are negligible compared to interactions between a dark matter particle and the large-scale gravitational potential). The question of how strong the constraints are on non-gravitational interactions between individual dark matter particles is therefore crucial for evaluating non-CDM models.
There has been long-standing interest in models that involve dark matter self-interactions (Carlson, Machacek & Hall 1992, Spergel & Steinhardt 2000). In its simplest form, self-interacting dark matter (SIDM, sometimes called collisional dark matter) is characterized by an energy-exchange interaction cross section σ. The mean free path λ of dark matter particles is then λ = (n σ)−1, where n is the local number density of dark matter particles. Since the mass of the dark matter particle is not known, it is often useful to express the mean free path as (ρ σ / m)−1 and to quantify self-interactions in terms of the cross section per unit particle mass, σ / m. If λ(r) / r ≪ 1 at radius r from the center of a dark matter halo, many scattering events occur per local dynamical time and SIDM acts like a fluid, with conductive transport of heat. In the opposite regime, λ(r) / r ≫ 1, particles are unlikely to scatter over a local dynamical time and SIDM is effectively an optically thin (rarefied) gas, with elastic scattering between dark matter particles. Most work in recent years has been far from the fluid limit.
As originally envisioned by Spergel & Steinhardt (2000) in the context of solving the missing satellites and cusp/core problems, the mean free path for self-interactions is of order 1 kpc ≲ λ ≲ 1 Mpc at densities characteristic of the Milky Way's dark matter halo (0.4 GeV / cm3; Read 2014), leading to self-interaction cross sections of 400 ≳ σ / m ≳ 0.4 cm2 / g (800 ≳ σ / m ≳ 0.8 barn / GeV). This scale (∼ barn / GeV) is enormous in particle physics terms – it is comparable to the cross-section for neutron-neutron scattering – yet it remains difficult to exclude observationally. It is important to emphasize that the dark matter particle self-interaction strength can, in principle, be completely decoupled from the dark matter’s interaction strength with Standard Model particles and thus standard direct detection constraints offer no absolute model-independent limits on σ/m for the dark matter. Astrophysical constraints are therefore essential for understanding dark matter physics.
Though the SIDM cross section estimates put forth by Spergel & Steinhardt (2000) were based on analytic arguments, the interaction scale they proposed to alleviate the cusp/core problem does overlap (at the low end) with more modern results based on fully self-consistent cosmological simulations. Several groups have now run cosmological simulations with dark matter self-interactions and have found that models with σ / m ≈ 0.5−10 cm2 / g produce dark matter cores in dwarf galaxies with sizes ∼ 0.3−1.5 kpc and central densities 2−0.2 × 10⁸ M⊙ kpc−3 = 7.4−0.74 GeV cm−3 that can alleviate the cusp/core and too-big-to-fail problems discussed above (e.g., Vogelsberger, Zavala & Loeb 2012, Peter et al. 2013, Fry et al. 2015, Elbert et al. 2015). SIDM does not, however, significantly alleviate the missing satellites problem, as the substructure counts in SIDM simulations are almost identical to those in CDM simulations (Rocha et al. 2013; see Figure 15).
One important constraint on possible SIDM models comes from galaxy clusters. The high central dark matter densities observed in clusters exclude SIDM models with σ / m ≳ 0.5 cm2 / g, though SIDM with σ / m ≃ 0.1 cm2 / g may be preferred over CDM (e.g., Kaplinghat, Tulin & Yu 2016, Elbert et al. 2016). This means that in order for SIDM is to alleviate the small-scale problems that arise in standard CDM and also match constraints seen on the galaxy cluster scale, it needs to have a velocity-dependent cross section σ(v) that decreases as the rms speed of dark matter particles involved in the scattering rises from the scale of dwarfs (v ∼ 10 km s−1) to galaxy clusters (v ∼ 1000 km s−1). Velocity-dependent scattering cross sections are not uncommon among Standard Model particles.
Figure 15 shows the results of three high-resolution cosmological simulations (performed by V. Robles, T. Kelley, and B. Bozek in collaboration with the authors) of the same Milky Way mass halo done with CDM, SIDM (σ / m = 1 cm2 / g), and WDM (a 7 keV resonant model, with thermal-equivalent mass of 2 keV). The images show density maps spanning 600 kpc. It is clear that while WDM produces many fewer subhalos than CDM, the SIDM model yields a subhalo distribution that is very similar to CDM, with only slightly less substructure near the halo core, which itself is slightly lower density than the CDM case.
These visual impressions are quantified in the bottom three panels, which show the main halo density profiles (left) and the subhalo Vmax functions for all three simulations (right). The middle panel shows the relationship between the Vmax values of individual halos identified in both CDM and WDM simulations (Bozek et al. 2016). The left panel shows clearly that SIDM produces a large, constant-density core in the main halo, while the WDM profile is almost identical to the CDM case. However, for mass scales close to the half-mode suppression mass of the WDM model (Mhalo ≲ 1010 M⊙ for this case), the density structure is affected significantly. This effect accounts for most of the difference seen in the right panel: WDM subhalos have Vmax values that are greatly reduced compared to their CDM counterparts, meaning there is a Vmax-dependent shift leftward at fixed number (i.e., subhalos at this mass scale are not being destroyed, which would result in a reduction in number at fixed Vmax).
Finally, we conclude by noting that it is possible to write down SIDM models that have both truncated power spectra and significant self-interactions. Such models produce results that are a hybrid between traditional WDM and SIDM with scale-invariant spectra (e.g. Cyr-Racine et al. 2016, Vogelsberger et al. 2016). Specifically, it is possible to modify dark matter in such a way that it produces both fewer subhalos (owing to power spectra effects) and constant density cores (owing to particle self-interactions) and thus solve the substructure problem and core/cusp problem simultaneously without appealing to strong baryonic feedback.
7 We note that capturing these effects is extremely demanding numerically, and it is not clear that any published cosmological hydrodynamical simulation of a Milky Way-size system can resolve the mass within 300−500 pc of satellite galaxies with the accuracy required to address this issue. Back.