


The metallicities of stars in UFDs are important both for classifying them as galaxies (Section 2.2) and for connecting them to the broader field of galaxy formation (Section 9.3). Fortunately, the same spectra of individual stars from which the stellar kinematics are determined can often be used to measure metallicities. With spectral synthesis techniques developed over the last decade and other methods, abundances of several elements other than iron can also be obtained from medium-resolution spectra of dwarf galaxy stars (e.g., Kirby et al., 2009, Norris et al., 2010b, Kirby et al., 2011, Vargas et al., 2013, Koposov et al., 2015b). Mean metallicities based on such data have now been obtained for 26 out of 42 confirmed/candidate UFDs. Detailed chemical abundance patterns generally require observations at higher spectral resolution, which are challenging for dwarf galaxies because even their brightest stars are usually rather faint.
The first spectroscopic metallicity measurements for ultra-faint dwarfs were provided by Muñoz et al. (2006), Martin et al. (2007), and Simon & Geha (2007). Collectively, these studies showed that the ultra-faint dwarfs have very low metallicities ([Fe/H] ≲ −2) and that the stars in each object span a range in metallicity. The latter property distinguishes UFDs from globular clusters, and indicates both that star formation in these objects extended for a long enough period of time for supernova (SN) enrichment to occur and that their gravitational potential is deep enough that not all of the supernova ejecta can escape the system. Kirby et al. (2008) used more accurate metallicity measurements to show that many of the ultra-faint dwarfs contain extremely metal-poor (EMP) stars with [Fe/H] < −3, again distinct from globular clusters and (at the time) classical dSphs.
UFDs are particularly appealing systems in which to study early chemical evolution and nucleosynthesis because their small stellar masses imply that they have hosted relatively few SN explosions. That fact, combined with the short time periods during which they were forming stars (see Section 5), means that UFDs may preserve the unpolluted chemical signatures of small numbers of nucleosynthetic events (Bland-Hawthorn et al., 2010, Karlsson, Bromm & Bland-Hawthorn, 2013), perhaps even individual explosions (e.g., Frebel & Bromm, 2012, Ji, Frebel & Bromm, 2015). Koch et al. (2008) began the process of analyzing the detailed chemical abundances of UFD stars with high-resolution Magellan/MIKE spectra of two stars in Hercules. Frebel et al. (2010) and Norris et al. (2010c), Norris et al. (2010a) extended this effort to more dwarfs and lower metallicities. Even from these earliest studies, it was clear that the UFDs are enhanced in α elements such as oxygen, magnesium, calcium, and silicon, and unusually deficient in neutron-capture elements including barium and strontium, as detailed further in Section 3.4.
3.1. The Mass-Metallicity Relation
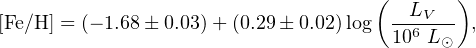
A correlation between the stellar mass or luminosity of a galaxy and its mean metallicity has been known for decades (e.g., Tremonti et al., 2004, and references therein). Simon & Geha (2007) and Kirby et al. (2008) showed that such a relationship also exists even in the ultra-faint dwarf regime, more than five orders of magnitude in luminosity below the galaxies examined by Tremonti et al. Kirby et al. (2013b) carefully quantified the stellar mass-metallicity relation for Local Group dwarfs, demonstrating that a single relation holds for all types of dwarf galaxies throughout the Local Group:
 |
(2) |
with a standard deviation around the fit of only 0.16 dex. Including measurements made since 2013 for a larger sample of Milky Way satellites (see Figure 5), we find a best fit consistent with that reported by Kirby et al. (2013b), although with an increased intrinsic scatter of ∼ 0.25 dex primarily attributable to the faintest dwarfs.
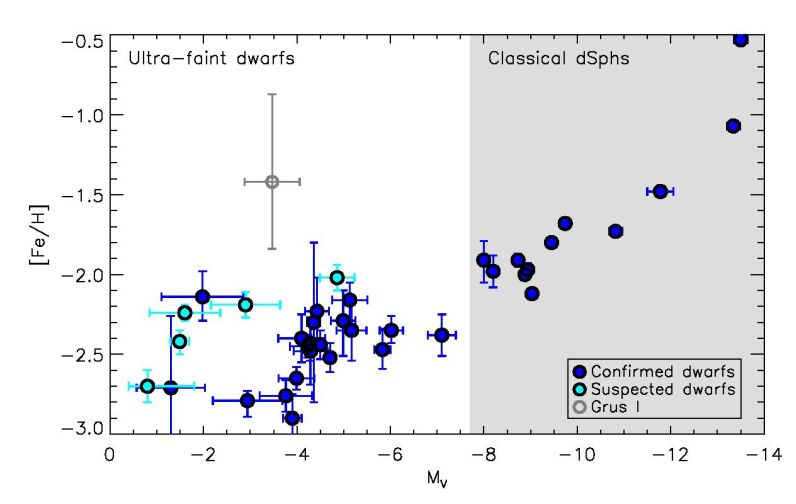 |
Figure 5. Mean stellar metallicities of Milky Way satellites as a function of absolute magnitude. Confirmed dwarf galaxies are displayed as dark blue filled circles, and objects suspected to be dwarf galaxies but for which the available data are not conclusive are shown as cyan filled circles. Grus I, for which there is no published classification, is shown as an open gray circle. The error bars in the vertical direction indicate the uncertainty on the mean metallicity of each object. The dwarf galaxy/candidate data included in this plot are listed in Table 1. The overall relationship between metallicity and luminosity is clear, although the scatter is large at the faint end. |
The existence of a tight correlation between luminosity and metallicity argues against severe tidal stripping of the stellar components of dwarf galaxies. Tidal stripping reduces the luminosity of a system without significantly changing its metallicity. 8 Stripping will therefore tend to increase the scatter in the correlation; indeed, the two dwarfs known to be stripped because of the presence of substantial tidal tails, Sagittarius and Tuc III, lie ∼ 0.8 dex and ∼ 0.5 dex above the correlation. The fact that the correlation remains in place therefore puts an upper limit on the amount of stripping that could have occurred for the bulk of the dwarf galaxy population. However, since the dark matter halos of galaxies are much more extended than their stars, a large fraction of the dark matter in dSphs and UFDs could be removed without affecting the luminosity-metallicity relation.
The reader may observe that the scatter in the luminosity-metallicity relation appears to increase substantially for UFDs around MV ≳ −5.5, and even more so at MV ≳ −4.0. This increased dispersion could be interpreted as evidence that the faintest dwarfs have suffered more stripping than the classical dSphs. Alternatively, (underestimated) observational uncertainties and errors may be responsible for some or all of the larger scatter at the lowest luminosities. In particular, the metallicities of some of the outliers above the relation are currently determined from only two member stars (e.g., Willman 1 and Tri II). If the brightest stars in those systems happen not to be representative of the overall metallicity distribution then the derived mean metallicity will be incorrect. The most significant outlier is Grus I, which is reported by Walker et al. (2016) to contain four stars (out of seven measured) with [Fe/H] > −1.4. No other UFD contains so many metal-rich stars, suggesting that some of them are probably foreground contaminants and that the system is actually more metal-poor.
3.2. Metallicity Distribution Functions
In contrast to the classical dSphs, relatively little work has been done on the metallicity distribution functions (MDFs) in ultra-faint dwarfs. This lack of attention is largely a result of the small samples of metallicity measurements typically available for UFDs. The best-studied object is Boo I, for which Norris et al. (2010b) derived an MDF with 16 stars and Lai et al. (2011) determined an MDF with 41 stars. The shape of the Boo I MDF is qualitatively similar to those obtained by Kirby et al. (2011) for the classical dSphs, although with a narrower peak. Kirby et al. (2008) showed that the combined MDF of seven UFDs and CVn I is very similar to the MDF of the Milky Way halo over the metallicity range from [Fe/H] = −2 to [Fe/H] = −3.5. Brown et al. (2014) determined MDFs for six UFDs, finding suggestions of multiple peaks in the metallicity distributions in several cases (most notably Boo I and Hercules). However, given the sparseness of the data for most galaxies, few authors have attempted to draw conclusions about the evolutionary history of UFDs from the observed MDFs (see Section 3.3). Lai et al. (2011) found that the Extra Gas model of Kirby et al. (2011) provides the best fit to the Boo I MDF, with most of the stars forming from an accreted reservoir of pristine gas, although the alternative Kirby et al. models (Pre-Enriched and Pristine) also fit the data acceptably well. The effective yield derived by Lai et al. (2011) for any of the three models continues the trend found by Kirby et al. (2011) of decreasing effective yield with decreasing stellar mass.
3.3. Chemical Evolution Histories
Beyond the MDF, the most basic feature of galactic chemical evolution is the dependence of the abundance of α elements on metallicity. At low metallicity, high [α/Fe] ratios are observed, while more metal-rich stars have low [α/Fe] ratios. This behavior results from the different chemical yields from different types of SNe. Core-collapse SNe from massive stars explode quickly after star formation occurs, producing large quantities of α elements. As time passes, Type Ia SNe begin to explode, producing primarily iron-peak elements and thereby lowering the [α/Fe] ratio (Tinsley, 1979).
The timing of the transition between chemical enrichment dominated by core-collapse SNe and SNe Ia varies from galaxy to galaxy because it depends on the star formation rate (e.g., Venn et al., 2004, Kirby et al., 2011). In the compilation of 7 UFDs by Vargas et al. (2013), this transition appears to occur rather sharply at [Fe/H] = −2.3 when the data for the entire sample are combined. The observation of high [α/Fe] at [Fe/H] < −2.3 and ∼ solar [α/Fe] at [Fe/H] > −2.3 is interpreted in the standard picture as evidence that Type Ia SNe began to contribute significantly to chemical enrichment at [Fe/H] ≈ −2.3. In that case, star formation in UFDs must have continued for ≳ 100 Myr so that some SNe Ia exploded before the cessation of star formation (e.g., Vargas et al., 2013). However, Jeon, Besla & Bromm (2017) suggested instead that the lack of a clear knee in the [α/Fe] vs. [Fe/H] diagram indicates that the UFDs were predominantly enriched by core-collapse SNe.
Only one galaxy, Segue 1, shows no evidence for a change in [α/Fe] over a broad range in metallicity (Vargas et al., 2013, Frebel, Simon & Kirby, 2014). This abundance pattern is consistent with the one-shot enrichment scenario of Frebel & Bromm (2012, although see Webster, Frebel & Bland-Hawthorn (2016) for alternative possibilities), with star formation in Segue 1 likely lasting for less than a few hundred Myr and ending before any SNe Ia occurred.
Analytical chemical evolution models can provide insight into star formation and nucleosynthesis processes in galaxies (e.g., Searle & Sargent, 1972, see Audouze & Tinsley (1976) and Nomoto, Kobayashi & Tominaga (2013) for reviews). Thus far, such models have only been applied to two UFDs, Hercules and Boo I (Vincenzo et al., 2014, Romano et al., 2015). By simultaneously fitting the observed stellar masses, MDFs, and [α/Fe] ratios, Vincenzo et al. (2014) showed that the UFDs formed with smaller gas reservoirs and star formation efficiencies a factor of ∼ 10 lower than the classical dSphs. In agreement with previous results from the classical dSphs (e.g., Kirby, Martin & Finlator, 2011), Vincenzo et al. (2014) found that most of the gas and metals are removed from the galaxies by galactic winds, although Romano et al. (2015) concluded that gas removal by tidal and ram-pressure stripping is more likely for Boo I. Extending these models to a larger sample of UFDs covering a wider range of parameter space would be very interesting, but requires increased numbers of metallicity and [α/Fe] measurements to be feasible.
Several recent numerical studies have explored the chemical evolution of UFD galaxies via hydrodynamic simulations. Using idealized models, Webster, Sutherland & Bland-Hawthorn (2014) and Bland-Hawthorn, Sutherland & Webster (2015) showed that dark matter halos as small as 107 M⊙ can retain gas after SN explosions, while less massive halos are evacuated after a single SN. They also found that only SNe near the center of a galaxy have a significant impact on its gas content; most of the energy from SNe that explode in the outskirts is lost to the intergalactic medium. In these models, the observed behavior of [α/Fe] as a function of metallicity from Vargas et al. (2013) can be reproduced if the duration of star formation is a few hundred Myr. Webster, Bland-Hawthorn & Sutherland (2015) extended this work by examining the effect of different star formation histories. They concluded that multiple well-separated bursts of star formation, as modeled by, e.g., Brown et al. (2014), produce more extremely metal-poor stars and fewer low [α/Fe] stars than observed. However, a model with continuous star formation (with brief pauses as the gas is heated by SNe) and ongoing self-enrichment provides a reasonable match to the data. More sophisticated simulations have been carried out by Jeon, Besla & Bromm (2017), who studied the formation of several UFDs in a cosmological context with a chemical reaction network. Jeon, Besla & Bromm (2017) demonstrated that a combination of reionization and SN feedback is necessary to quench star formation in these objects. Each of the dwarfs they simulated experienced several mergers at early times, with ∼ 10−20% of the stars forming outside the main progenitor halo. In these models, the lowest metallicity UFD stars formed in halos that were enriched by Population III SN explosions in neighboring halos, while stars at [Fe/H] ≳ −3 primarily formed in situ with enrichment dominated by Population II SNe. As with the simpler models of Webster, Bland-Hawthorn & Sutherland (2015), the chemical abundances predicted by the Jeon, Besla & Bromm simulations ([C/Fe] and [α/Fe]) are in reasonable agreement with observed UFDs.
3.4. Chemical Abundance Patterns
Early studies of the detailed chemical abundance patterns of stars in UFDs focused on broad trends as a function of metallicity, which for the most part resemble the abundance trends of Milky Way halo stars in the same metallicity range (e.g., Koch et al., 2008, Frebel et al., 2010, Norris et al., 2010c, Norris et al., 2010a). Ultra-faint dwarf stars are enhanced in α elements by ∼ 0.3 dex, have Cr abundances that increase linearly with metallicity, are sometimes enhanced in carbon, and have low abundances of neutron-capture elements. Stars that are outliers from these general results in specific abundance ratios do exist, but their frequency does not seem to be high (e.g., Vargas et al., 2013).
3.4.1. Typical Ultra-Faint Dwarfs. Chemical abundance measurements from high-resolution spectroscopy are now available for at least one star in 16 UFDs. This sample currently contains more than 50 stars, with metallicities ranging from [Fe/H] = −1.4 to [Fe/H] = −3.8. With a handful of exceptions, the abundance patterns of different ultra-faint dwarfs closely resemble each other (see, e.g., Chiti et al., 2018), such that the galaxy in which a star is located cannot be discerned by examining its chemical abundances (see Figure 6). Some of the examples of distinct abundance patterns include the low [α/Fe] ratios in Horologium I (Nagasawa et al., 2018) and low [Sc/Fe] ratios in Com Ber and possibly Segue 2 (Frebel et al., 2010, Roederer & Kirby, 2014).
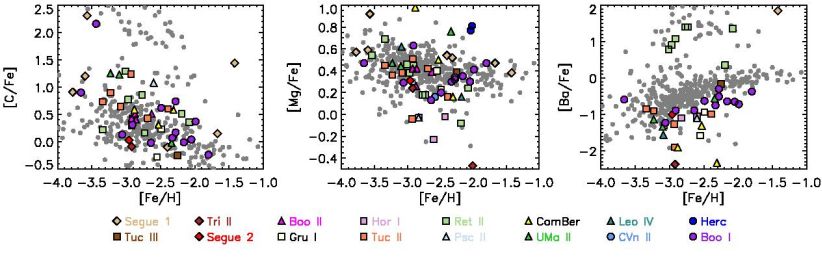 |
Figure 6. Chemical abundance patterns of stars in UFDs. The left, middle, and right panels show [C/Fe], [Mg/Fe], and [Ba/Fe] ratios as a function of metallicity, respectively. UFD stars are plotted as colored diamonds, squares, triangles, and circles, as listed in the legend at bottom. The UFD data have been adopted from Koch et al. (2008), Feltzing et al. (2009), Frebel et al. (2010, 2016), Simon et al. (2010), Norris et al. (2010a, 2010b), Norris et al. (2010c), Lai et al. (2011), Gilmore et al. (2013), Koch et al. (2013), Frebel, Simon & Kirby (2014), Ishigaki et al. (2014), Roederer & Kirby (2014), Ji et al. (2016b, 2016c), François et al. (2016), Kirby et al. (2017), Hansen et al. (2017), Nagasawa et al. (2018), Chiti et al. (2018), Spite et al. (2018), and Ji et al. (2018). A sample of metal-poor Milky Way halos stars from Cohen et al. (2013) and Roederer et al. (2014) is displayed as small gray circles for comparison. |
For elements through the iron peak, the abundances of ultra-faint dwarf stars closely follow the halo trend as a function of metallicity (Fig. 6). This result strongly suggests that nucleosynthesis and chemical evolution at early times do not depend significantly on galactic environment (e.g., Tolstoy, Hill & Tosi, 2009, Simon et al., 2010). Whether the dispersion in abundance for each element at a constant metallicity matches between halo stars and the UFDs has not been investigated, but could be illuminating as to early chemical evolution and star formation. At the lowest metallicities, a significant fraction of UFD stars have high carbon abundances (e.g., Frebel et al., 2010, Norris et al., 2010a, Salvadori, Skúladóttir & Tolstoy, 2015, Ji et al., 2016b, Spite et al., 2018), again matching previous findings for the halo.
The only clear distinction between the abundance patterns of UFDs and halo stars is seen in the heaviest elements. For most UFD stars these measurements are limited to Ba and Sr, which have the strongest lines at optical wavelengths for typical enrichment levels. The UFD [Ba/Fe] and [Sr/Fe] abundance ratios are not usually outside the distribution of Ba and Sr abundances in the Milky Way halo, but most UFDs have abundance ratios that are significantly (≳ 1 dex) lower than the average ratios for halo stars. Despite the much larger sample of halo stars available in the literature, some of the lowest Ba and Sr abundances ever measured are found in UFDs. Very low abundances of neutron-capture elements have been suggested as a possible characteristic for distinguishing UFDs from globular clusters in difficult cases (Ji et al., 2018); low aluminum abundances may also separate dwarfs from clusters.
3.4.2. Rare Enrichment Events in Ultra-Faint Dwarfs. Perhaps the biggest surprise from chemical abundance measurements in UFDs was the recent discovery of extreme enrichment of r-process elements in Reticulum II (Ji et al., 2016a, Roederer et al., 2016). Out of nine Ret II stars for which high-resolution spectra have been obtained, seven have [Eu/Fe] > 0.9 and [Ba/Fe] > 0.3 (Ji et al., 2016a). From the full sample of previously-studied ultra-faint dwarf stars, none have [Ba/Fe] > 0 and only one (an s-process-enhanced binary in Segue 1) has [Eu/Fe] > 0. In fact, the Segue 1 binary, which was presumably contaminated with heavy elements by a companion that went through an AGB phase, was the only previous star in which Eu had been detected at all. Compared to most stars in UFDs, Ret II is enriched in Sr and Eu by a factor of >30, and in Ba by a factor of ≳ 100. As shown by Ji et al. (2016a), Ji et al. (2016b) and Roederer et al. (2016), the abundance patterns of the Eu-rich stars in Ret II perfectly match the r-process enrichment pattern seen in r-process-enhanced Milky Way stars and the Sun.
The only viable explanation for the chemical abundances of Ret II is that a single nucleosynthetic event early in the history of the galaxy produced a large quantity of r-process material (∼ 10−5 M⊙ of Eu; Ji et al. (2016a)). Given that nine other UFDs had been observed prior to Ret II, and no sign of significant r-process enrichment was detected in any of them, whatever produced the neutron-capture elements in Ret II must have been a rare occurrence. Ret II does not have a large stellar mass among UFDs, so it is very unlikely that an event would take place multiple times in Ret II and never in any other similar galaxies. Therefore, the very large overabundance of r-process elements also indicates that this single event must have produced copious amounts of such elements. Ordinary SNe do not have these characteristics, leaving a neutron star merger or a magneto-rotationally driven SN as the possible sites for r-process nucleosynthesis in Ret II (Ji et al., 2016a, Roederer et al., 2016). As a result of the observational evidence for r-process nucleosynthesis by the neutron star merger GW170817 (e.g., Chornock et al., 2017, Cowperthwaite et al., 2017, Drout et al., 2017, Kasliwal et al., 2017, Pian et al., 2017, Shappee et al., 2017, Smartt et al., 2017), as well as the approximate agreement in the inferred rates of such events, a neutron star merger is heavily favored as the primary origin of r-process elements in Ret II and other dwarf galaxies.
Subsequent to the identification of Ret II as an r-process-rich galaxy, Hansen et al. (2017) showed that the brightest star in Tuc III is also enhanced in r-process elements. The rate of r-process enhancement in UFDs can therefore be updated to two out of 14 galaxies. The r-process abundances in Tuc III are significantly lower than in Ret II, but still well above those in any other UFD. This abundance pattern implies that either the nucleosynthetic event in Tuc III produced less r-process material, it was diluted into a larger mass of gas, or that a larger fraction of the r-process yield of the event escaped the galaxy.
Although the abundance of r-process elements in other ultra-faint dwarfs is several orders of magnitude lower than in Ret II and Tuc III, those elements are still detected at very low levels in almost every galaxy for which sufficient data exist (e.g., Frebel et al., 2010, Roederer, 2013, Gilmore et al., 2013, Frebel, Simon & Kirby, 2014, Ishigaki et al., 2014, Chiti et al., 2018). If Ret II was enriched by a single r-process event, then the only way the same mechanism could account for much lower — but nonzero — r-process abundances in other UFDs is if the gas masses of those systems were much larger than in Ret II or the retention fraction of r-process ejecta were much lower. Straightforward calculations indicate that these possibilities are unlikely (see below). Therefore, the natural conclusion is that a second site of r-process nucleosynthesis exists, which produces much smaller amounts of r-process material (Ji et al., 2016b). This alternate pathway of creating heavy elements can likely be identified with core-collapse SNe (e.g., Lee et al., 2013).
Theoretical modeling of the r-process enrichment of UFDs is still in its early stages. However, the work that has been done from several different directions confirms that the scenario proposed by Ji et al. (2016a) is both physically plausible and can quantitatively explain the observed r-process abundances. Specifically, Beniamini, Hotokezaka & Piran (2016a, b) and Beniamini, Dvorkin & Silk (2018) used analytical calculations to demonstrate that (1) binary neutron stars can be retained in low-mass dwarfs despite possible SN kicks, (2) a non-negligible fraction of such binaries will merge in less than ∼ 100 Myr, (3) each nucleosynthesis event must produce ∼ 10−5 M⊙ of Eu and occur at a rate of one per ∼ 2000 SNe, (4) up to ∼ 90% of the r-process material synthesized should remain in the galaxy, and (5) ∼ 7% of UFDs should be enriched by an r-process event. Chemical evolution modeling by Komiya & Shigeyama (2016) showed that r-process synthesis by neutron star mergers can also reproduce the distribution of [Eu/Fe] and [Ba/Fe] abundance ratios for metal-poor stars in the Milky Way halo, under the assumptions of a lower star formation efficiency in dwarf galaxies and a size-dependent escape fraction for r-process material. Hydrodynamic simulations of UFDs by Safarzadeh & Scannapieco (2017) also support this picture, showing that a neutron star merger near the center of Ret II can reasonably account for the observed distribution of [Eu/H] and [Fe/H] values. If the merger occurred in the outskirts of the galaxy, on the other hand, lower Eu abundances that are uncorrelated with metallicity would be expected.
| Dwarf | MV | R1/2 | Distance | vhel | σ | [Fe/H] | σ[Fe/H] | References a,b |
| (pc) | (kpc) | (km s−1) | (km s−1) | |||||
| Tucana IV | −3.50−0.28+0.28 | 127− 22+ 26 | 48.0− 4.0+ 4.0 | 1,1,1,-,-,-,- | ||||
| Sculptor | −10.82−0.14+0.14 | 279− 16+ 16 | 86.0− 5.0+ 5.0 | −111.4−0.1+0.1 | 09.2−1.1+1.1 | −1.73−0.02+0.03 | 0.44 −0.02+0.02 | 2,2,3,4,5,6,6 |
| Cetus II | 0.00−0.68+0.68 | 17− 5+ 9 | 30.0− 3.0+ 3.0 | 1,1,1,-,-,-,- | ||||
| Cetus III | −2.45−0.56+0.57 | 90− 14+ 32 | 251.0−11.0+24.0 | 7,7,7,-,-,-,- | ||||
| Triangulum II | −1.60−0.76+0.76 | 16− 4+ 4 | 28.4− 1.6+ 1.6 | −381.7−1.1+1.1 | <3.4c | −2.24−0.05+0.05 | 0.53 −0.38+0.12 | 2,2,8,9,9,9,9 |
| Segue 2 | −1.98−0.88+0.88 | 40− 4+ 4 | 37.0− 3.0+ 3.0 | 0−40.2−0.9+0.9 | <2.2c | −2.14−0.15+0.16 | 0.39 −0.13+0.12 | 2,2,10,11,11,6,6 |
| DESJ0225+0304 | −1.10−0.30+0.50 | 19− 5+ 9 | 23.8− 0.5+ 0.7 | 12,12,12,-,-,-,- | ||||
| Hydrus I | −4.71−0.08+0.08 | 53− 4+ 4 | 27.6− 0.5+ 0.5 | −080.4−0.6+0.6 | 02.7−0.4+0.5 | −2.52−0.09+0.09 | 0.41 −0.08+0.08 | 13,13,13,13,13,13,13 |
| Fornax | −13.34−0.14+0.14 | 792− 18+ 18 | 139.0− 3.0+ 3.0 | −055.2−0.1+0.1 | 11.7−0.9+0.9 | −1.07−0.01+0.02 | 0.27 −0.01+0.01 | 2,14,15,4,5,6,6 |
| Horologium I | −3.76−0.56+0.56 | 40− 9+ 10 | 87.0−11.0+13.0 | −112.8−2.6+2.5 | 04.9−0.9+2.8 | −2.76−0.10+0.10 | 0.17 −0.03+0.20 | 2,2,16,17,18,18,18 |
| Horologium II | −1.56−1.02+1.02 | 44− 14+ 15 | 78.0− 7.0+ 8.0 | 2,2,19,-,-,-,- | ||||
| Reticulum II | −3.99−0.38+0.38 | 51− 3+ 3 | 31.6− 1.4+ 1.5 | −062.8−0.5+0.5 | 03.3−0.7+0.7 | −2.65−0.07+0.07 | 0.28 −0.09+0.09 | 2,2,20,21,21,21,21 |
| Eridanus II | −7.10−0.30+0.30 | 246− 17+ 17 | 366.0−17.0+17.0 | −075.6−1.3+1.3 | 06.9−0.9+1.2 | −2.38−0.13+0.13 | 0.47 −0.09+0.12 | 22,22,22,23,23,23,23 |
| Reticulum III | −3.30−0.29+0.29 | 64− 23+ 26 | 92.0−13.0+13.0 | 1,1,1,-,-,-,- | ||||
| Pictor I | −3.67−0.60+0.60 | 32− 15+ 15 | 126.0−16.0+19.0 | 2,2,16,-,-,-,- | ||||
| Columba I | −4.20−0.20+0.20 | 117− 12+ 12 | 183.0−10.0+10.0 | 8,8,8,-,-,-,- | ||||
| Carina | −9.45−0.05+0.05 | 311− 15+ 15 | 106.0− 5.0+ 5.0 | −222.9−0.1+0.1 | 06.6−1.2+1.2 | −1.80−0.02+0.02 | 0.24 d | 2,2,24,4,5,25,25 |
| Pictor II | −3.20−0.50+0.40 | 47− 13+ 20 | 45.0− 4.0+ 5.0 | 26,26,26,-,-,-,- | ||||
| Carina II | −4.50−0.10+0.10 | 92− 8+ 8 | 36.2− 0.6+ 0.6 | −477.2−1.2+1.2 | 03.4−0.8+1.2 | −2.44−0.09+0.09 | 0.22 −0.07+0.10 | 27,27,27,28,28,28,28 |
| Carina III | −2.40−0.20+0.20 | 30− 8+ 8 | 27.8− 0.6+ 0.6 | −284.6−3.1+3.4 | 05.6−2.1+4.3 | 27,27,27,28,28,-,- | ||
| Ursa Major II | −4.43−0.26+0.26 | 139− 9+ 9 | 34.7− 1.9+ 2.0 | −116.5−1.9+1.9 | 05.6−1.4+1.4 | −2.23−0.24+0.21 | 0.67 −0.15+0.20 | 2,2,29,30,31,6,6 |
| Leo T | −8.00e | 118− 11+ 11 | 409.0−27.0+29.0 | −038.1−2.0+2.0 | 07.5−1.6+1.6 | −1.91−0.14+0.12 | 0.43−0.09+0.13 | 32,32,33,30,30,6,6 |
| Segue 1 | −1.30−0.73+0.73 | 24− 4+ 4 | 23.0− 2.0+ 2.0 | −208.5−0.9+0.9 | 03.7−1.1+1.4 | −2.71−0.39+0.45 | 0.95 −0.26+0.42 | 2,2,34,35,35,36,36 |
| Leo I | −11.78−0.28+0.28 | 270− 16+ 17 | 254.0−15.0+16.0 | −282.9−0.5+0.5 | 09.2−0.4+0.4 | −1.48−0.01+0.02 | 0.26 −0.01+0.01 | 2,2,37,38,38,6,6 |
| Sextans | −8.94−0.06+0.06 | 456− 15+ 15 | 95.0− 3.0+ 3.0 | −224.3−0.1+0.1 | 07.9−1.3+1.3 | −1.97−0.04+0.04 | 0.38 −0.03+0.03 | 2,2,39,4,5,6,6 |
| Ursa Major I | −5.13−0.38+0.38 | 295− 28+ 28 | 97.3− 5.7+ 6.0 | 0−55.3−1.4+1.4 | 07.0−1.0+1.0 | −2.16−0.13+0.11 | 0.62 −0.08+0.10 | 2,40,41,30,31,6,6 |
| Willman 1 | −2.90−0.74+0.74 | 33− 8+ 8 | 45.0−10.0+10.0 | 0−14.1−1.0+1.0 | 04.0−0.8+0.8 | −2.19−0.08+0.08 | 2,2,42,43,43,43,- | |
| Leo II | −9.74−0.04+0.04 | 171− 10+ 10 | 233.0−14.0+14.0 | −078.3−0.6+0.6 | 07.4−0.4+0.4 | −1.68−0.03+0.02 | 0.34 −0.02+0.02 | 2,2,44,45,45,6,6 |
| Leo V | −4.29−0.36+0.36 | 49− 16+ 16 | 169.0− 4.0+ 4.0 | −170.9−1.9+2.1 | 02.3−1.6+3.2 | −2.48−0.21+0.21 | 0.47 −0.13+0.23 | 2,2,46,47,47,47,47 |
| Leo IV | −4.99−0.26+0.26 | 114− 13+ 13 | 154.0− 5.0+ 5.0 | −132.3−1.4+1.4 | 03.3−1.7+1.7 | −2.29−0.22+0.19 | 0.56 −0.14+0.19 | 2,2,48,30,30,6,6 |
| Crater II | −8.20−0.10+0.10 | 1066− 86+ 86 | 117.5− 1.1+ 1.1 | −087.5−0.4+0.4 | 02.7−0.3+0.3 | −1.98−0.10+0.10 | 0.22 −0.03+0.04 | 49,49,49,50,50,50,50 |
| Virgo I | −0.80−0.90+0.90 | 38− 11+ 12 | 87.0− 8.0+13.0 | 51,51,51,-,-,-,- | ||||
| Hydra II | −4.86−0.37+0.37 | 67− 13+ 13 | 151.0− 7.0+ 8.0 | −303.1−1.4+1.4 | <3.6c | −2.02−0.08+0.08 | 0.40 −0.26+0.48 | 2,2,52,53,53,53,53 |
| Coma Berenices | −4.28−0.25+0.25 | 69− 4+ 5 | 42.0− 1.5+ 1.6 | −098.1−0.9+0.9 | 04.6−0.8+0.8 | −2.43−0.11+0.11 | 0.46 −0.08+0.09 | 2,2,54,30,30,6,6 |
| Canes Venatici II | −5.17−0.32+0.32 | 71− 11+ 11 | 160.0− 4.0+ 4.0 | −128.9−1.2+1.2 | 04.6−1.0+1.0 | −2.35−0.19+0.16 | 0.57 −0.12+0.15 | 2,2,55,30,30,6,6 |
| Canes Venatici I | −8.73−0.06+0.06 | 437− 18+ 18 | 211.0− 6.0+ 6.0 | −030.9−0.6+0.6 | 07.6−0.4+0.4 | −1.91−0.04+0.04 | 0.39 −0.02+0.03 | 2,2,56,30,30,6,6 |
| Boötes II | −2.94−0.75+0.74 | 39− 5+ 5 | 42.0− 1.0+ 1.0 | −117.0−5.2+5.2 | 10.5−7.4+7.4 | −2.79−0.10+0.06 | <0.35c | 2,2,57,58,58,59,59 |
| Boötes I | −6.02−0.25+0.25 | 191− 8+ 8 | 66.0− 2.0+ 2.0 | −101.8−0.7+0.7 | 04.6−0.6+0.8 | −2.35−0.08+0.09 | 0.44 −0.06+0.07 | 2,2,60,61,61,62,62 |
| Ursa Minor | −9.03−0.05+0.05 | 405− 21+ 21 | 76.0− 4.0+ 4.0 | −247.2−0.8+0.8 | 09.5−1.2+1.2 | −2.12−0.02+0.03 | 0.33 −0.03+0.02 | 2,2,63,64,4,6,6 |
| Draco II | −0.80−1.00+0.40 | 19− 3+ 4 | 21.5− 0.4+ 0.4 | −342.5−1.2+1.1 | <5.9c | −2.70−0.10+0.10 | <0.24c | 65,65,65,65,65,65,65 |
| Hercules | −5.83−0.17+0.17 | 216− 20+ 20 | 132.0− 6.0+ 6.0 | −045.0−1.1+1.1 | 05.1−0.9+0.9 | −2.47−0.12+0.13 | 0.47 −0.08+0.11 | 2,2,66,30,30,6,6 |
| Draco | −8.88−0.05+0.05 | 231− 17+ 17 | 82.0− 6.0+ 6.0 | −290.7−0.8+0.7 | 09.1−1.2+1.2 | −2.00−0.02+0.02 | 0.34 −0.02+0.02 | 2,2,67,64,4,6,6 |
| Sagittarius | −13.50−0.15+0.15 | 2662−193+193 | 26.7− 1.3+ 1.3 | −139.4−0.6+0.6 | 09.6−0.4+0.4 | −0.53−0.02+0.03 | 0.17 −0.02+0.02 | 68,68,69,70,70,71,71 |
| Sagittarius II | −5.20−0.10+0.10 | 33− 2+ 2 | 70.1− 2.3+ 2.3 | 20,20,20,-,-,-,- | ||||
| Indus II | −4.30−0.19+0.19 | 181− 64+ 70 | 214.0−16.0+16.0 | 1,1,1,-,-,-,- | ||||
| Grus II | −3.90−0.22+0.22 | 93− 12+ 16 | 53.0− 5.0+ 5.0 | 1,1,1,-,-,-,- | ||||
| Pegasus III | −4.10−0.50+0.50 | 78− 25+ 31 | 205.0−20.0+20.0 | −222.9−2.6+2.6 | 05.4−2.5+3.0 | −2.40−0.15+0.15 | 72,72,72,73,73,73,- | |
| Aquarius II | −4.36−0.14+0.14 | 160− 26+ 26 | 107.9− 3.3+ 3.3 | 0−71.1−2.5+2.5 | 05.4−0.9+3.4 | −2.30−0.50+0.50 | 74,74,74,74,74,49,- | |
| Tucana II | −3.90−0.20+0.20 | 121− 35+ 35 | 58.0− 8.0+ 8.0 | −129.1−3.5+3.5 | 08.6−2.7+4.4 | −2.90−0.16+0.15 | 0.29 −0.12+0.15 | 16,16,16,75,75,76,76 |
| Grus I | −3.47−0.59+0.59 | 28− 23+ 23 | 120.0−11.0+12.0 | −140.5−1.6+2.4 | 02.9−1.0+2.1 | −1.42−0.42+0.55 | 0.41 −0.23+0.49 | 2,2,17,75,75,75,75 |
| Pisces II | −4.23−0.38+0.38 | 60− 10+ 10 | 183.0−15.0+15.0 | −226.5−2.7+2.7 | 05.4−2.4+3.6 | −2.45−0.07+0.07 | 0.48 −0.29+0.70 | 2,2,77,53,53,53,53 |
| Tucana V | −1.60−0.49+0.49 | 16− 5+ 5 | 55.0− 9.0+ 9.0 | 1,1,1,-,-,-,- | ||||
| Phoenix II | −2.70−0.40+0.40 | 37− 8+ 8 | 84.3− 4.0+ 4.0 | 20,20,20,-,-,-,- | ||||
| Tucana III | −1.49−0.20+0.20 | 37− 9+ 9 | 25.0− 2.0+ 2.0 | −102.3−0.4+0.4 | <1.2c | −2.42−0.08+0.07 | <0.19c | 20,20,1,78,78,78,78 |
| Note. - These data are provided as a convenience to the community. However, in recognition of the effort invested by many researchers to obtain, reduce, analyze, and publish these measurements, we strongly encourage authors to cite the original references (which are listed below), not just this compilation, where possible. | ||||||||
| a References: (1) Drlica-Wagner et al. (2015); (2) Muñoz et al. (2018); (3) Pietrzyński et al. (2008); (4) Walker et al. (2009a); (5) Walker, Mateo & Olszewski (2009); (6) Kirby et al. (2013b); (7) Homma et al. (2018); (8) Carlin et al. (2017); (9) Kirby et al. (2017); (10) Boettcher et al. (2013); (11) Kirby et al. (2013a); (12) Luque et al. (2017); (13) Koposov et al. (2018); (14) Battaglia et al. (2006); (15) Rizzi et al. (2007); (16) Bechtol et al. (2015); (17) Koposov et al. (2015a); (18) Koposov et al. (2015b); (19) Kim & Jerjen (2015); (20) Mutlu-Pakdil et al. (2018); (21) Simon et al. (2015); (22) Crnojević et al. (2016a); (23) Li et al. (2017); (24) Karczmarek et al. (2015); (25) Fabrizio et al. (2012); (26) Drlica-Wagner et al. (2016); (27) Torrealba et al. (2018); (28) Li et al. (2018b); (29) Dall’Ora et al. (2012); (30) Simon & Geha (2007); (31) this work (32) de Jong et al. (2008); (33) Clementini et al. (2012); (34) Belokurov et al. (2007); (35) Simon et al. (2011); (36) Frebel, Simon & Kirby (2014); (37) Bellazzini et al. (2004); (38) Mateo, Olszewski & Walker (2008); (39) Lee et al. (2003); (40) Okamoto et al. (2008); (41) Garofalo et al. (2013); (42) Willman et al. (2005a); (43) Willman et al. (2011); (44) Bellazzini, Gennari & Ferraro (2005); (45) Spencer et al. (2017); (46) Medina et al. (2018); (47) Collins et al. (2017); (48) Moretti et al. (2009); (49) Torrealba et al. (2016a); (50) Caldwell et al. (2017); (51) Homma et al. (2016); (52) Vivas et al. (2016); (53) Kirby, Simon & Cohen (2015); (54) Musella et al. (2009); (55) Greco et al. (2008); (56) Kuehn et al. (2008); (57) Walsh et al. (2008); (58) Koch et al. (2009); (59) Ji et al. (2016c); (60) Dall’Ora et al. (2006); (61) Koposov et al. (2011); (62) Brown et al. (2014); (63) Bellazzini et al. (2002); (64) Muñoz et al. (2005); (65) Longeard et al. (2018); (66) Musella et al. (2012); (67) Kinemuchi et al. (2008); (68) Majewski et al. (2003); (69) Hamanowicz et al. (2016); (70) Bellazzini et al. (2008); (71) Mucciarelli et al. (2017); (72) Kim et al. (2015a); (73) Kim et al. (2016); (74) Torrealba et al. (2016b); (75) Walker et al. (2016); (76) Chiti et al. (2018); (77) Sand et al. (2012); (78) Simon et al. (2017). | ||||||||
| b The references listed for each object are for, in order: (1) MV, (2) R1/2, (3) distance, (4) vhel, (5) σ, (6) [Fe/H], and (7) σ[Fe/H]. Inasmuch as the properties of some galaxies have been determined by multiple studies, this reference list is not intended to be complete. Instead, it represents our assessment of the best available data. In cases where no velocity and/or metallicity measurements are available in the literature, a dash is listed in place of the corresponding reference. | ||||||||
| c Upper limits are at 90% confidence. Where the original reference does not provide a value at that confidence interval, we have determined one from the data. dNo uncertainty on the metallicity dispersion of Carina was provided by Fabrizio et al. (2012). | ||||||||
| d No uncertainty on the absolute magnitude of Leo T was provided by de Jong et al. (2008). | ||||||||
8 In the case of a metallicity gradient with the most metal-rich stars near the center of the galaxy, stripping would actually increase the overall metallicity slightly as low metallicity stars in the outskirts are preferentially stripped. Back.