


11.1. Predictions for non-evolving source populations in the mid-IR
A zero-th order approach to interprete the deep count observations is to
compare them with the expectations of
models assuming no-evolution for cosmic sources. Any such calculations
have to account for the effects of the very complex spectrum of
galaxies in the mid-IR (including strong PAH emission and
silicate absorption features, see Fig. 9) in the
K-correction factor appearing in
eq. (8.19), which in terms of the system transmission function
T(![]() )
is more appropriately written as:
)
is more appropriately written as:
|
The effect on the source flux and on the counts [eq. 8.18] may be particularly important in the wide LW3 (12-18 µm) filter. The prominent mid-IR features imply a complication when interpreting the counts, but at the same time they imply an enhanced sensitivity of the LW3 source selection to the details of the evolution of sources in the redshift interval 0.5 < z < 1.3, which is known to be so critical for the formation of structures in the universe.
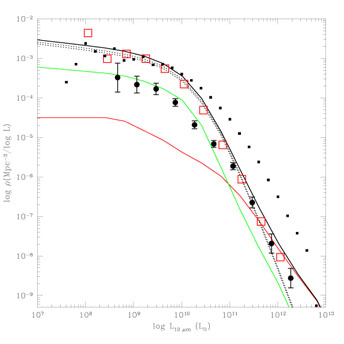
Local mid-IR luminosity functions have been published by Rush et al. (1993), Xu et al. (1998) and Fang et al. (1998) based on the 12 µm all-sky IRAS survey, see Figure 8. Unfortunately, in spite of the proximity of the CAM LW3 and IRAS 12 micron bands, at the moment we do not have a reliable LLF at 15 µm because of: a) uncertainties in the IRAS 12 µm photometry, b) the effects of local inhomogeneities, particularly the local Virgo super-cluster; and c) the flux conversion between the IRAS and CAM-LW3 bands (Elbaz et al. 1999).
|
Figure 8. Galaxy LLF's at 12 µm from Xu et al. (1998, red open squares) compared with the IRAS 60 µm LLF by Saunders et al. (1990, small filled squares). Black ellipses are an estimate of the 12 µm LLF of active galaxies (including type-I [red line] and type-II AGNs plus starbursts [green line]) based on the (revised) catalogue by Rush et al. (1993). Active galaxies clearly dominate the LLF at high luminosities. |
The dotted line in Fig. 5 corresponds to the present best estimate of the contribution from a non-evolving population with a luminosity function consistent with that in the IRAS 12 µm band derived by Xu et al. and Fang et al. The correction to the CAM LW3 band is made assuming a 12 to 15 µm flux ratio which is a function of the 12 µm luminosity: for the less luminous objects the ratio is based on the observed mid-IR spectrum of quiescent spirals, while for the highest luminosity galaxies the ratio is the one expected for ultraluminous IR galaxies, and for intermediate objects it is close to a typical starburst spectrum like the one of M82 (see continuous line in Fig. 9). The 15 to 12 µm flux ratio increases continuously with luminosity, the flux at long-wavelength being increasingly dominated by the starburst emission.
|
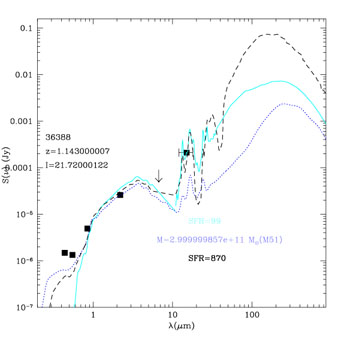
Figure 9. Broad-band spectrum of a mid-IR source selected by ISOCAM LW3 in the Hubble Deep Field North (Aussel et al. 1999), compared with the SED's of M82 (thick continuous line), Arp 220 (dashed line), and M51 (dotted line). Estimates of the SF rate [based on the M82 and Arp 220 templates] and of the stellar mass [based on the M51 template] are indicated. |
It is clear that the no-evolution prediction, even taking into account the
effects of the PAH features on the K-corrections, falls very short of the
observed counts at fluxes fainter than a few mJy. Also the observed slope
in the 0.4 to 4 mJy flux range (N[S] ![]() S-3±0.1)
is very significantly different from the no-evolution predicted dependence
N(S)
S-3±0.1)
is very significantly different from the no-evolution predicted dependence
N(S) ![]() S-2.
The extrapolation to the bright fluxes is instead consistent, within the
uncertainties,
with the IRAS 12 µm counts with a slope close to
Eclidean.
S-2.
The extrapolation to the bright fluxes is instead consistent, within the
uncertainties,
with the IRAS 12 µm counts with a slope close to
Eclidean.
11.2. Evidence for a strongly evolving population of mid-IR galaxies
The shape of the differential counts shown in Fig. 5 contains relevant indications about the properties of the contributing source populations. In particular the almost flat (Euclidean) normalized counts extending from the bright IRAS fluxes down to a few mJy, followed by the sudden upturn below, suggests that is not likely the whole population of IR galaxies that evolve: in this case and for the observed IR galaxy LLF, the super-Euclidean increase in the counts would appear at brighter fluxes and not be as abrupt. This behaviour is better consistent with a locally small fraction of IR galaxies to evolve.
The IR counts in Fig. 5 are reproduced
with the contribution of two
source populations, one evolving, the other with constant properties as
a function of time. The local fraction of the evolving starburst
population is only several percent of the total, consistent with the
observed fraction of interacting galaxies (![]() 5% locally), the quick upturn in the counts then
requiring quite a strong evolution to match the peak in the normalized
counts around S15
5% locally), the quick upturn in the counts then
requiring quite a strong evolution to match the peak in the normalized
counts around S15 ![]() 0.5 mJy.
The details of the fit depend on the assumed values for the
geometrical parameters of the universe. For a zero-
0.5 mJy.
The details of the fit depend on the assumed values for the
geometrical parameters of the universe. For a zero-![]() open universe (in our case
H0 = 50 Km/sec/Mpc,
open universe (in our case
H0 = 50 Km/sec/Mpc, ![]() = 0.3),
a physically credible solution would require a redshift increase of the
comoving density of the starburst sub-population and at the same time an
increase of the luminosities respectively as
= 0.3),
a physically credible solution would require a redshift increase of the
comoving density of the starburst sub-population and at the same time an
increase of the luminosities respectively as

| (11.27) |
These are quite extreme evolution rates, if compared with those observed
in optical samples for the merging and interacting galaxies (e.g.
Le Fevre et al. 2000).
The inclusion of a non-zero cosmological constant, and the corresponding
increase of the cosmic
timescale from z = 0 to 1, tend to make the best-fitting evolution rates
less extreme. For
H0 = 50 Km/sec/Mpc, ![]() = 0.2,
= 0.2, ![]() = 0.8, a best-fit to the counts
requires:
= 0.8, a best-fit to the counts
requires:

| (11.28) |
To be consistent with data on the z-distributions from the ISO
source samples in the HDF
(Aussel et al. 1999,
2000,
see Fig. 10) and with the observed
CIRB intensity, this fast evolution should turn over
at z ![]() 1 and the IR emissivity should keep roughly constant
at higher z. An accurate probe, however, of hidden SF in the
interval
1
1 and the IR emissivity should keep roughly constant
at higher z. An accurate probe, however, of hidden SF in the
interval
1 ![]() z
z ![]() 2 will only
be possible with the longer-wavelength broad-band channel of SIRTF at
2 will only
be possible with the longer-wavelength broad-band channel of SIRTF at
![]() = 24 µm.
= 24 µm.
In our scheme, any single galaxy would be expected to spend most of its life in the quiescent (non-evolving) phase, being occasionally put by interactions in a short-lived (few 107 yrs) starbursting state. The evolution for the latter may simply be due to an increased probability in the past to find a galaxy in such an excited mode. Then the density evolution in eq. (11.28) scales with redshift as the rate of interactions due to a simple geometric effect following the increased source volume density. The luminosity evolution may be interpreted as an effect of the larger gas mass available to the starbursts at higher z.
Note, however, that the above evolutionary scheme is by no means the only one able to fit the data, other solutions may be devised (e.g. the one by Xu [2000] allowing the whole local population to evolve with cosmic time).
11.3. A panchromatic view of IR galaxy evolution
Deep surveys at various IR/sub-mm wavelengths can be exploited to simultaneously constrain the evolution properties and broad-band spectra of faint IR sources. Franceschini et al. (2000) have compared the 15 µm survey data with those coming from the IRAS 60 µm, the FIRBACK 175 µm, the ELAIS 90 µm, and the SCUBA 850 µm surveys, which are the deepest, most reliable available at the moment. Information on both number counts and the source redshift distributions were used in these comparisons.
Further essential constraints, providing the local boundary conditions on the evolution histories, are given by the multi-wavelength local luminosity functions. In addition to the 12 and 15 µm LLF's, as discussed in Section 11.1, the galaxy LLF is particularly well known at 60 µm after the IRAS all-sky surveys and their extensive spectroscopic follow-up (Saunders et al. 1990). Dunne et al. (2000, see also Franceschini, Andreani, Danese 1998) attempted to constrain the galaxy LLF in the millimeter, based on mm observations of complete samples of IRAS 60 µm galaxies.
As previously mentioned, the properties of LLF's observed at various IR/sub-mm wavelengths can be explained only assuming that the galaxy IR SED's depend on bolometric luminosity. Fig. 8 shows that the 60µm LLF has a flatter (power-law) shape at high-L compared with the mid-IR LLF's (a fact explained in Sect. 6.6 as an effect of spectra for luminous active galaxies showing excess 60 µm emission compared to inactive galaxies [see also the L-dependence of the IRAS colours]).
Franceschini et al. (2000) have modelled in some detail the redshift-dependent multi-wavelength LLF's of galaxies by assuming for both non-evolving spirals and active starburst galaxies spectral energy distributions dependent on luminosity, with spectra ranging from those typical of inactive spirals for low-luminosities, to the 60µm-peaked spectra of luminous and ultra-luminous IR galaxies as previously described. For the SED's of intermediate luminosity objects, linear interpolations between the two as a function of bolometric luminosity were assumed. This allows to simultaneously fit the LLF's at the various wavelengths. For comparison, solutions with single spectral energy distributions for the evolving populations were also tried.
Altogether, the observed long-wavelength counts and CIRB intensity, when compared with typical galaxy SED's and the multi-wavelength LLFs, require a substantial increase of the IR volume emissivity of galaxies with redshift (see Figs. 3, 5, 7).
Should one assume that the IR SED of the ultra-luminous galaxy Arp 220 is representative of the average spectrum of the evolving population detected by ISOCAM LW3, then the consequence would be that the observed far-IR counts and the CIRB intensity are far exceeded. On the contrary, if we assume for the IR evolving sources a more typical starburst spectrum (like the one of M82, by all means similar to those of other luminous starbursts observed by ISO), then most of the observed properties of far-IR galaxy samples (number counts, redshift distributions, luminosity functions) are appropriately reproduced. Best-fits to the counts based on the M82 template are given in Figs. 6 and 7.
The good match to the multi-wavelength counts obtained by assuming a typical starburst spectrum for the evolving population already indicates that the faint IR-selected source population is likely dominated by processes of star-formation in distant galaxies more than by AGN emissions. This seems indeed the result of the first spectroscopic studies of faint ISO sources (Sect. 12.1), although a more substantial effort is required to confirm it. Considering the different shapes of the IR SEDs for SBs and AGNs, this would imply that the population detected by ISO in the mid-IR not only contributes a major fraction of CIRB at 15µ, but is also responsible for a majority contribution of the CIRB at any wavelengths.