Abstract. Current ideas about the nature of interstellar dust in
galaxies are
reviewed, with a strong emphasis on the nature of the very small grain
component
needed to explain the mid-infrared diffuse emission and unidentified
infrared features.
Models for the infrared spectra of galaxies are reviewed and the
evidence that most of
the radiation in star-forming regions is being absorbed by a high
visible-uv optical
depth of dust is summarized. The evidence for destruction of very small
grains in regions of high radiation intensity is discussed.
A new model for interstellar grains in galaxies is presented, based on a
revised version of the model of Rowan-Robinson (1986) and is compared
to observed far
infrared colour-colour diagrams and to far infrared spectra of galaxies
which have
been mapped at 800 µm by Hughes et al (1989). Work on far infrared and
submillimeter mapping of galaxies is reviewed, as also is recent work on
infrared
emission from ellipticals and lenticulars. The determination of dust
mass in galaxies is briefly discussed.
Table of Contents
 INTRODUCTION
- GRAIN MODELS
- FIRST ATTEMPTS TO EXPLAIN THE INFRARED SPECTRA OF
IRAS GALAXIES
- THE DESTRUCTION OF VERY SMALL GRAINS
- TOWARDS A NEW PICTURE OF INTERSTELLAR DUST IN
GALAXIES
- FAR INFRARED AND SUBMILLIMETRE MAPPING OF GALAXIES
- DETERMINATION OF DUST MASS IN GALAXIES
- DUST IN ELLIPTICALS AND LENTICULARS
- REFERENCES
1. INTRODUCTION
My task in reviewing interstellar dust in galaxies is greatly simplified
by the
appearance of several excellent review articles on this area during the
past year or so.
Although each covers only a specific aspect of the subject, together
they comprise a good introduction to our current knowledge.
A comprehensive review of infrared emission from our Galaxy, with much
historical background, has been given by
Cox and Mezger
(1989).
They emphasize that the
results from IRAS have led to a major reappraisal of estimates of the
fraction of the
infrared emission from our Galaxy which comes from interstellar dust
illuminated by
the interstellar radiation field, as opposed to regions of massive star
formation. The
latter are now believed to contribute only about 10% of the total
infrared emission from the Galaxy.
Boulanger and
Perault (1988)
have given an authoritative
discussion of the infrared emission observed by IRAS from the different
components of diffuse emission from our Galaxy, and the correlations
between them, which must be the starting point for any analysis of the
interstellar dust in normal galaxies. A
general review of the IRAS view of the extragalactic sky has been given
by
Soifer et al (1987).
Telesco (1988)
has reviewed enhanced star formation and infrared
emission in the centers of galaxies, with a strong emphasis on imaging and
spectroscopic data derived from ground-based studies.
Helou (1989)
has reviewed
the far infrared emission from Galactic and extragalactic dust seen by IRAS,
emphasizing the similarity in the range of far infrared colors seen in
external galaxies and in reflection nebulae in our Galaxy.
Roche (1988)
has given an interesting summary of the results from near and middle
infrared spectroscopy of galaxies.
Puget and Leger
(1989)
have given a very thorough review of the evidence
for small grains and large aromatic molecules in the interstellar medium
of our own and other galaxies. Finally
Draine (1989)
has reviewed interstellar extinction in the infrared.
In this review I shall concentrate on those areas where major
controversy exists and
where significant progress may be expected in the next few years. The
topics I have
selected are grain models, first attempts to explain the infrared
spectra of IRAS
galaxies, the destruction of the very small grain component, a new
picture of
interstellar dust in galaxies, results from far infrared and
submillimeter mapping of
galaxies, determination of the dust mass in galaxies, and dust in
ellipticals and lenticulars.
2. GRAIN MODELS
Classical grain models consisting of silicate and carbon grains of
radius 0.01-0.1 µ, for example those of
Mathis et al (1977),
Draine and Lee
(1984),
Rowan-Robinson
(1986),
Tielens and
Allamandola (1987),
are successful in accounting for the
observed visible and ultraviolet extinction curve and the emission
longward of 60 µ.
However there is not yet a concensus on the grain properties longward of
300 µ, as emphasized by
Draine (1989).
I will discuss this further in section 5 below. The
observations which the classical grain model definitely can not account
for are (i)
excess diffuse emission from the Milky Way at 2-20 µ
(Price 1981,
Boulanger et al
1985),
(ii) 2-20 µ emission from reflection nebulae with color temperature
approximately independent of distance from the star
(Sellgren 1984)
and (iii) the
broad features at 3.3, 6.2, 7.7, 8.6 and 11.3 µ seen ubiquitously
in emission
(Gillett et al
1973).
Current models for these three phenomena all involve the non-equilibrium
response of very small particles to absorption of an ultraviolet photon
(Greenberg 1968,
Duley 1973,
Allen and Robinson
1975,
Purcell 1976,
Andriesse 1978,
Sellgren 1984,
Draine and Anderson
1985).
The main contenders are:
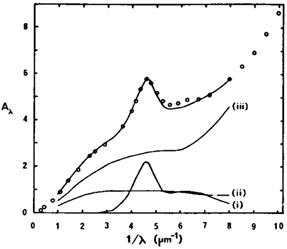
(A) Polycyclic aromatic hydrocarbons (PAH), which can be thought of as
hydrogenated graphite platelets consisting of about 50 atoms
(Platt 1956,
Donn 1968,
Leger and Puget
1984,
Allamandola et al
1985,
Puget and Leger
1989).
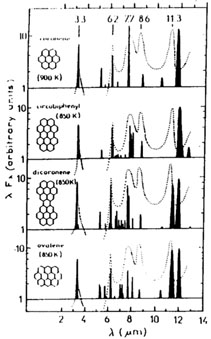
To account for the full range of observed phenomena,
Puget and Leger
(1989)
have to include also a very small carbonaceous grain (VSG) component
with radii in the range
0.0015-0.01 µ. Fig 1a shows how some
particular examples of PAHs can give at least qualitative agreement in
the wavelengths of (most of) the 3-12 µ broad-band features
(Puget and Leger
1989).
Fig 1b shows Puget and Legets fit to the
interstellar extinction curve in the visible and ultraviolet.
|
|
Figure 1. (a) Emission spectra of several
PAHs calculated from their laboratory
absorption spectra, compared with observations of the reflection nebula
NGC2023. (b) Fit to the interstellar extinction curve
(Puget and Leger
1989)
|
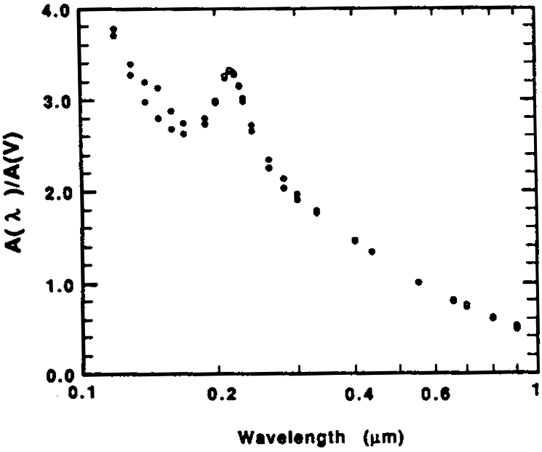
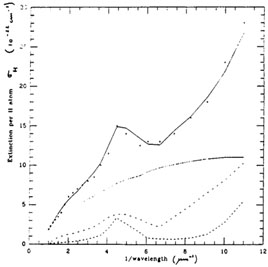
(B) Hydrogenated amorphous carbon (HAC), which can be thought of as poorly
connected PAH islands in a larger structure
(Duley and Williams
1981,
1988a,
b,
Duley 1987,
Jones et al 1987,
Williams 1989).
They attribute the 0.22 µ feature to
small silicate particles. Fig 2 shows their fit
to the visible and ultraviolet
interstellar extinction curve. Broad-band emission in the 0.6-0.9
µm region is
attributed to luminescence from a diamond-like component in the HAC
(Duley and Williams
1988b).
|
Figure 2. Fit by
Jones et al (1987)
to the interstellar extinction curve in the visible and ultraviolet.
|
(C) Quenched carbonaceous composite (QCC) has been proposed by Sakato et al
(1983,
1984).
This material is made in the laboratory in a process intended to
simulate the expanding atmospheres of carbon stars.
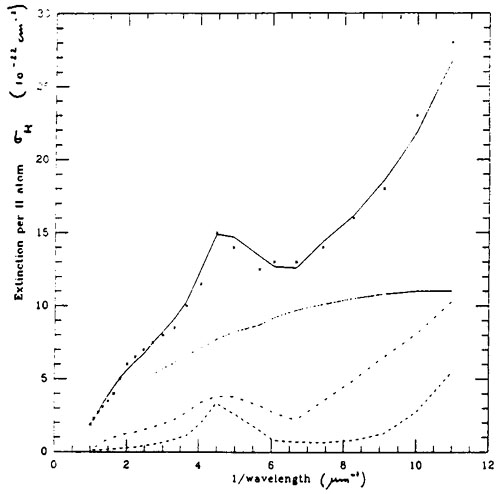
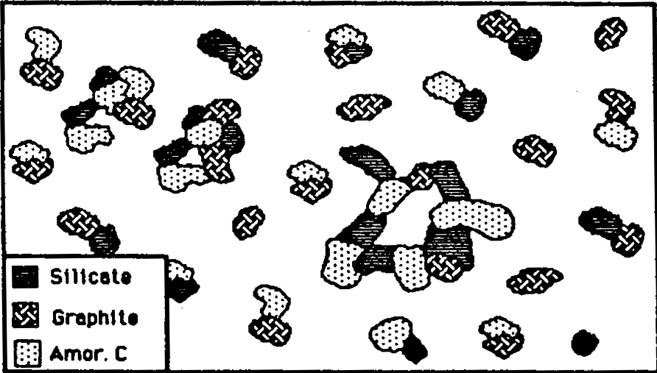
(D) Amorphous aggregates of small particles of silicates, amorphous
carbon and graphite
(Mathis and Whiffen
1989).
These authors show that the optical properties
of an aggregate can be significantly different from a simple sum of the
ingredients in
the aggregate. Fig 3a illustrates the
appearance of the Mathis and Whiffen composite
grains, Fig 3b shows their fit to the visible
and ultraviolet extinction curve and Fig 3c
shows the properties of their grains at 1-1000 µ.
It is clear that in the aggregate models (B-D), the very small grain
component must
retain its thermodynamic identity in order to explain the phenomena
(i-iii) above.
From the point of view of understanding infrared emission from dust, it
may therefore
be academic whether the very small grain component is integrated into a
larger
structure or not, since this integration must be so weak as to leave the
specific properties of the component intact.
Puget and Leger
(1989)
in fact query whether
aggregate grain models can localize the energy of an incident photon for
the several seconds required for infrared emission.
Draine (1988)
has reviewed the variety of models which have been put forward
specifically to explain the 0.2175 µ feature. The models which he
considers are
graphite, nongraphitic carbonaceous solids, OH- on small
silicate grains, PAH, small
MgO or CaO particles, dessicated microorganisms, radiation-damaged
SiO2, charge
transfer on Si, Fe or Mg, and finally the absorption edge in silicate
grains. He
concludes that only two are consistent with all the available
observations, graphite or
OH- on small silicate grains, and he notes that the latter
hypothesis is less well developed than the graphite hypothesis.
In section 5 below I shall try to pull
together some of these ingredients into a simple
but comprehensive picture for interstellar dust in galaxies.
3. FIRST ATTEMPTS TO EXPLAIN THE INFRARED SPECTRA OF IRAS
GALAXIES
Models for IRAS galaxy spectra have been reviewed by Rowan-Robinson
(1987a,
b)
and Helou (1989).
The first model proposed was a simple 2-component model
consisting of warm (50 K) dust in molecular clouds/HII regions and cool
(20 K) dust
in the interstellar medium heated by the interstellar radiation field
(de Jong et al
1984).
This model has been developed further by
de Jong and Brink
(1987)
and has been criticized by
Eales and Devereux
(1990).
The model is rather similar to that
proposed by Cox and Mezger over a number of years (see
Cox and Mezger
1989).
Helou (1986)
proposed an extension of this model in which the warm component
becomes a one-parameter family, with the heating intensity as the
parameter. As the
intensity increases from that found in the solar neighborhood to the
much higher
value found in star-forming regions, the dust temperature increases from
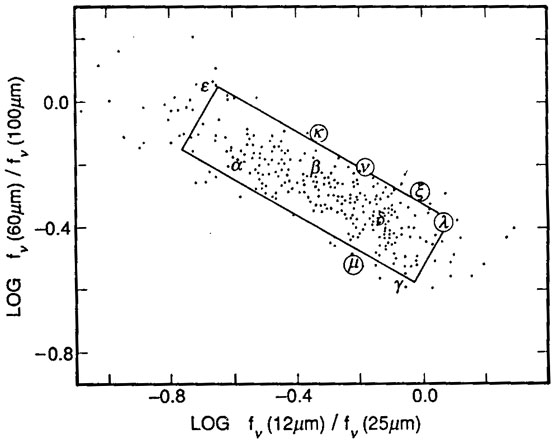
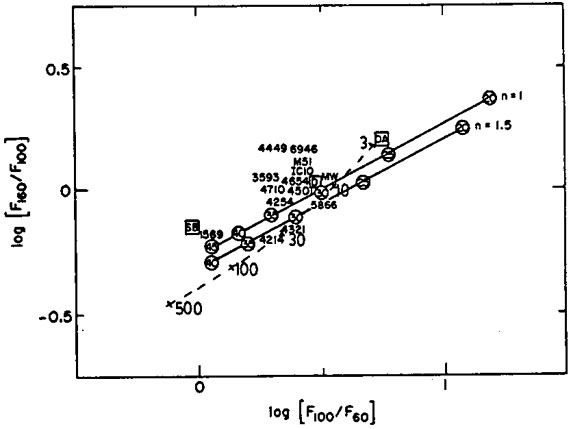
20 to 50 K. More recently,
Helou (1989)
emphasizes the similar range of IRAS colors found in
galaxies and in Galactic sources. Fig 4a shows
log{ S(60) / S(100)} versus log{ S(12)IS(25)} for IRAS galaxies and
Fig 4b shows the same diagram for Galactic
sources. The sequence of colors found in the reflection nebulosity
surrounding  Per by
Boulanger et al
(1988)
with increasing distance from the star is also shown. This
appears to be telling support for Helous hypothesis that the variation
of color is
simply due to variation of the heating intensity experienced by the
grains.
Per by
Boulanger et al
(1988)
with increasing distance from the star is also shown. This
appears to be telling support for Helous hypothesis that the variation
of color is
simply due to variation of the heating intensity experienced by the
grains.
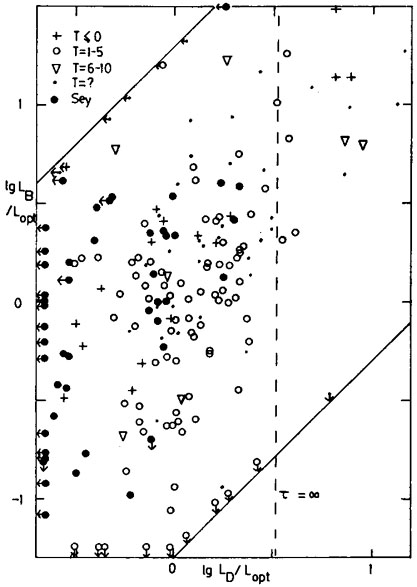
Rowan-Robinson and Crawford
(1986,
1989)
have also used the analogy with Galactic
sources to derive a rather different model for IRAS galaxy spectra. They
propose that
the galaxy spectra are a mixture of three components, the general disc
emission of the
galaxy consisting of reradiation of the interstellar radiation field
absorbed by
interstellar grains (Fig 5a), a component
present in Seyferts peaking at 25 µm due to
dust in the narrow-line region, and a starburst component with a
spectrum similar to
that for Galactic compact HII regions. Their models for the latter
(Crawford and
Rowan-Robinson 1986)
are optically thick at visible and ultraviolet wavelengths,
with AV  20 (they
are optically thin in the far infrared, of course).
Fig 5b compares their starburst model spectrum
with the
Telesco et al (1984)
spectrum of the
NGC1068 starburst component and with the average
spectrum for Galactic
compact HII regions/regions of massive star formation derived by
Rowan-Robinson
(1979).
Confirmation of the fact that most of the massive star formation in
galaxy starbursts
takes place at high visible-uv optical depth comes from a comparison of
the 60 µ luminosity of a large sample of IRAS galaxies with their
H
20 (they
are optically thin in the far infrared, of course).
Fig 5b compares their starburst model spectrum
with the
Telesco et al (1984)
spectrum of the
NGC1068 starburst component and with the average
spectrum for Galactic
compact HII regions/regions of massive star formation derived by
Rowan-Robinson
(1979).
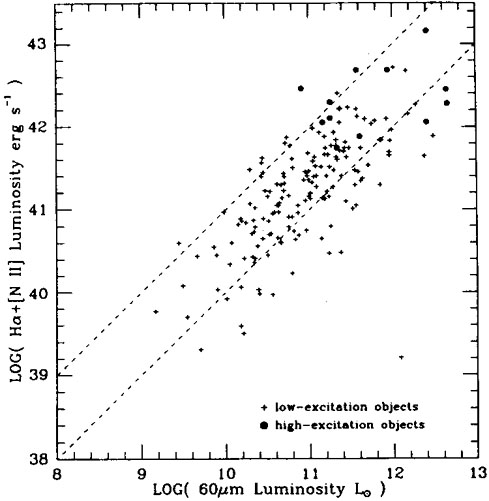
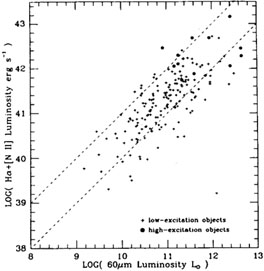
Confirmation of the fact that most of the massive star formation in
galaxy starbursts
takes place at high visible-uv optical depth comes from a comparison of
the 60 µ luminosity of a large sample of IRAS galaxies with their
H luminosity
(Leech et al 1988,
Fig 5c). Ratios of these luminosities range
from 200-4000, compared with
30-100 for the nearby normal galaxies studied by
Persson and Helou
(1987).
The H /
H
luminosity
(Leech et al 1988,
Fig 5c). Ratios of these luminosities range
from 200-4000, compared with
30-100 for the nearby normal galaxies studied by
Persson and Helou
(1987).
The H /
H ratios for these IRAS galaxies
indicate values for AV of only a few, so the bulk
of the far infrared radiation must come from stars whose visible light
is heavily extinguished, while the
H
radiation must come from near the surface of the star-forming volume
(Leech et al 1989).
Further evidence for high visual extinction
comes from the Brackett-alpha and -gamma observations of
Kawara et al (1989)
for a sample of starburst galaxies. From these they infer values for
AV in the range 7-33. These values are in agreement with
those inferred from the depth of the 10 µm
silicate feature in these galaxies.
ratios for these IRAS galaxies
indicate values for AV of only a few, so the bulk
of the far infrared radiation must come from stars whose visible light
is heavily extinguished, while the
H
radiation must come from near the surface of the star-forming volume
(Leech et al 1989).
Further evidence for high visual extinction
comes from the Brackett-alpha and -gamma observations of
Kawara et al (1989)
for a sample of starburst galaxies. From these they infer values for
AV in the range 7-33. These values are in agreement with
those inferred from the depth of the 10 µm
silicate feature in these galaxies.

|

|
Figure 5. Models by
Rowan-Robinson &
Crawford (1989)
for (a) the cirrus and (b) the
starburst components in galaxy spectra. The broken curve in
Fig (b)
shows the effect
of changing the wavelength at which the grain absorption efficiency
steepens to 80 µm.
|
|
Figure 5c. H-alpha luminosity versus
infrared luminosity for sample of IRAS galaxies
(Leech et al 1988).
The broken lines correspond to L(60µm) / L(H-alpha) = 400
and 4000.
|
Once we are dealing with dust clouds with AV >> 1, then the
illumination geometry
becomes of critical importance for models of the infrared
spectra. Evolved HII regions
in our Galaxy show strong deviations from spherical geometry, often
displaying a
blister geometry, although it is possible that for young compact HII
regions spherical symmetry is a reasonable approximation
(Rowan-Robinson
1982,
Crawford and
Rowan-Robinson 1986).
Efstathiou and
Rowan-Robinson (1990)
have developed an
accurate radiative transfer code for axially symmetric dust clouds.
Fig 6 illustrates
the crucial importance of the aspect angle when viewing a non
spherically-symmetric system.
Leisawitz (1990)
has also studied the role of non-spherical geometry in
star-forming regions.
An improved model for IRAS galaxy spectra, which is essentially a fusion
of the
approaches of Helou and of Rowan-Robinson and Crawford, will be
described in section 5.
4. THE DESTRUCTION OF VERY SMALL GRAINS
In the past two years several lines of evidence have begun to point
towards the
destruction of very small grains in regions of very high uv radiation
intensity. The most direct evidence comes from infrared spectroscopy.
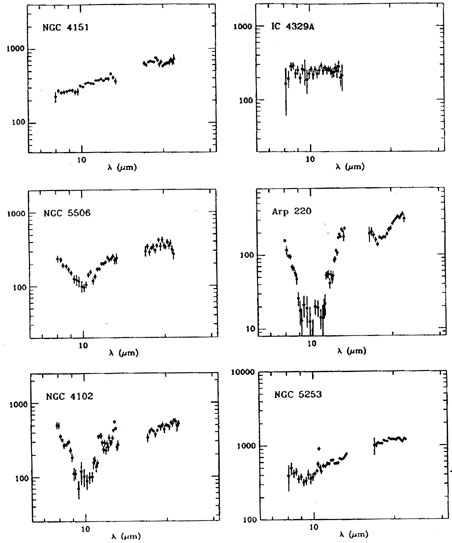
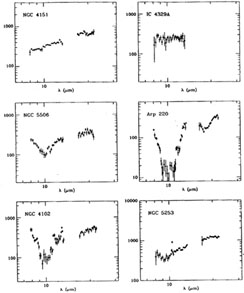
Roche (1988) and
Desert and Dennefeld
(1988)
have shown that the broad 3-12 µ features attributed to very
small grains are absent in the spectra of many Seyfert galaxies
(Fig 7a). Destruction
of very small grains is also presumably the reason that
Rowan-Robinson and
Crawford (1989)
found that the disc component was very weak or absent in many Seyferts
(Fig 7b).
|
Figure 7. (a) 8-13µm and 17-22µm
spectra of six galaxy nuclei. Note that the
unidentified ir features are completely absent from the Seyferts
NGC4151 and IC4329A.
|
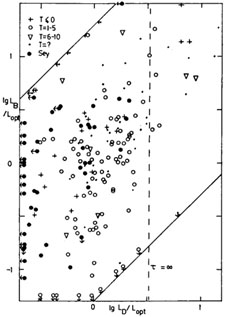
|
Figure 7. (b) Ratio of infrared luminosity
in starburst component to optical luminosity,
versus ratio of infrared luminosity in cirrus component to optical
luminosity for IRAS galaxies
(Rowan-Robinson &
Crawford 1989).
The Seyferts (filled circles) are deficient in the cirrus component.
|
Reasonably direct evidence for the destruction of very small grains in a
high radiation
intensity comes from the decline in the ratio of S(12) / S(100) near hot
stars.
Ryter et al (1987)
showed this effect for  Sco and
Boulanger et al
(1988)
showed it for Per.
Sco and
Boulanger et al
(1988)
showed it for Per.
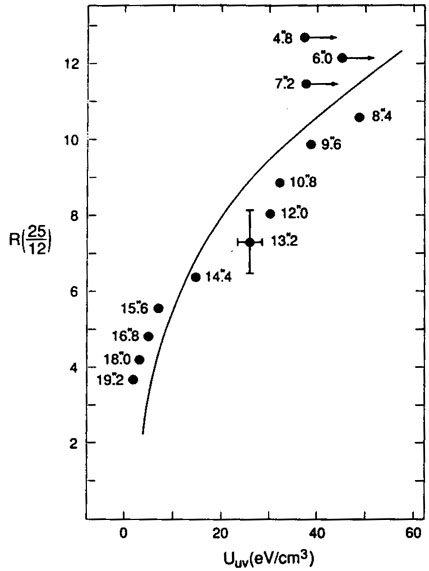
Telesco et al (1989)
argue that a similar effect is seen in the center of M82.
Fig 8a
shows the increase in S(25) / S(12) with increasing uv intensity found
by Telesco et
al for M82 superposed on the curve derived from Boulanger
et al's observations of
Per. However the
spectrum of the emission from outside the nucleus of M82 (and of
the integrated emission from the galaxy) is very similar to that for the
NGC1068
starburst, and for compact Galactic HII regions, shown in
Fig 5b, and one would
normally assume that the bulk of this emission arises in regions where
the visible and
ultraviolet optical depth is >> 1. The 10 µm emission from such a
cloud does not arise
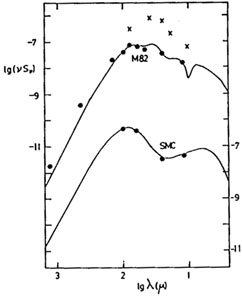
from very small grains. Fig 8b shows the
integrated spectrum of M82 compared to
the optically thick starburst model of
Rowan-Robinson and
Crawford (1989):
the agreement is good. Also shown is the shape of the spectrum of the
central region of M82, derived from the colors measured by
Telesco et al
(1989).
The change in spectrum towards the center of M82 is essentially a shift
of the emission peak from
80 µm to 60 µm, presumably due to the increase in intensity of
the radiation from the
starburst towards to nucleus. It seems unlikely that we are seeing
emission from
optically thin dust (the ratio of Brackett-alpha to -gamma gives a value
for AV of 14 for M82
(Kawara et al 1989) )
and hence the analogy with
Per appears to be
spurious.
|
Figure 8b. Top: Integrated spectrum of M82
(filled circles) compared with starburst model (data from
Telesco 1988,
Smith et al 1990a).
The crosses (arbitrary vertical
scale) show the relative shape of the spectrum of the core of
M82. Bottom: Integrated
spectrum of the SMC compared with cirrus model (X = 30) in which
abundance of 5 Å grains has been reduced by 2/3rds.
|
Similarly unconvincing evidence comes from the far infrared colors of
galaxies
(Pajot et al 1986,
Gosh & Drapatz 1987,
Helou 1989).
Here again the problem is
confusion with the role of the optically thick starburst component, for
which, in the model of
Rowan-Robinson and
Crawford (1989),
S(12) / S(60) = 0.04, but
radiative transfer effects in normal 0.01-0.1 µm dust rather than
small grain depletion is the cause.
Fig 4b above showed
Helou's (1989)
compilation of the IRAS
colors of compact Galactic HII regions and of galaxies superposed on the
range of
colors seen in Per by
Boulanger et al
(1988).
The agreement is good, but in my
view this is fortuitous in the case of Galactic HII regions and galaxies
dominated by
starbursts since in most cases the optical depth in these sources is
high and the
analogy with Per
therefore of doubtful significance. If the 60/25 µm color ratio,
ignored by Helou, is also considered, the agreement with
Per is less impressive.
However the case of the Small Magellanic Cloud
(Schwering 1988)
is convincing because the spectrum of this galaxy does indeed look like
cirrus in which the smallest
grain component is depleted (see Fig 8b).
In an interesting development,
Leene and Cox (1987)
have found that the 0.22 µ
feature is also suppressed in regions of high radiation intensity, which
suggests that
this feature is associated with the very small carbonaceous grains
responsible for the broad features and diffuse emission at 2-20 µ.
5. TOWARDS A NEW PICTURE OF INTERSTELLAR DUST IN GALAXIES
If we concentrate first on the 'cirrus' component in galaxies, the
reradiation by
interstellar dust of the energy absorbed from the interstellar radiation
field, then it
is clear that a satisfactory model involves a number of
ingredients. Firstly a multiple
(or aggregate ?) grain model is required to account for the interstellar
extinction
curve and it must incorporate very small grains and/or PAH. Secondly the
model must
allow for the fact that there is a range of heating intensities within
galaxies and from
galaxy to galaxy. For our Galaxy and a few other nearby galaxies we may
hope to study
how the observed spectrum varies with heating intensity. For more
distant galaxies
for which we have only the integrated spectrum we have to make do, for
the moment,
with a characteristic heating intensity. Let me define X = I /
Iisrf, where I is the
intensity in the region under consideration and Iisrf is the
intensity of the interstellar
radiation field in the solar neighborhood, which I assume to be as
characterized by
Mathis et al (1983).
Finally we may have to allow for the fact that for X > some
critical value, the very small grain component starts to be destroyed.
Models which satisfy the first two of these requirements were presented
by
Draine and Anderson
(1985).
Bernard and Desert
(1990)
have given some details of work which
satisfies all three requirements. Here I give some results from an
extension of my earlier interstellar grain model
(Rowan-Robinson
1986),
which is intended to be the
simplest possible model that fits all the present observational
data. The model retains
the 6 grain types of the earlier work, with some modifications: (i)
0.1 µ amorphous
carbon grains, their optical properties derived from circumstellar
dust shells around
carbon stars. The absorption efficiency of these has been reduced by a
factor of 1.5 at
wavelengths > 0.4 µ to improve the fit to the interstellar
extinction curve at 5-9 µ,
while retaining the same total extinction at wavelengths < 1
µm. This also has the
effect of increasing the visible and ultraviolet albedo to a more
acceptable value of 0.7.
(ii) 0.1 µ amorphous silicate grains, their optical
properties derived from
circumstellar dust shells around M stars. (It is worth noting that 50%
of the mass of
carbon and 80% of the mass of silicon in interstellar grains is in the
form of these
larger amorphous grains. We see them being manufactured in situ. We know
that this
is where the bulk of interstellar grains were last made.) (iii) 0.03
µ graphite
grains, (iv) 0.03 µ silicate grains, (v) 0.01 µ
graphite grains, (vi) 0.01 µ silicate
grains, all four types with properties as given by
Draine and Lee
(1984).
These components are required to explain the interstellar extinction
curve in the ultraviolet
and the 0.22 µ feature. The main difference from the earlier model
is that the mass in
0.01 µ graphite grains is now redistributed between 0.01 µ
grains, 0.002 µ (20 Å)
grains and 0.0005 µ (5 Å) grains. The absorption and
scattering properties of these
latter two species are assumed to be the same as the 0.01 µ grains
at wavelengths >
0.1 µ, but because they are so small they will not be in
equilibrium with the incident
radiation field. Instead we have to assume that they have a certain
probability p(T) dT
of having a temperature between T and T + dT. The emission spectrum from
these grains then has to be calculated from
IV =
 QV
BV(T) p(T) dT . QV
BV(T) p(T) dT .
| (1)
|
The calculation of p(T) is a complex matter but has been carried out by
Draine and Anderson
(1985)
for the grain properties of
Draine and Lee
(1984)
adopted here (see also
Guhathakurta and
Draine 1989).
Their results can be approximated analytically as
p(T) = k T-b for T1
 T
T2 , T
T2 ,
| (2)
|
where b = 2.75, and k = 6.68, T1 = 2.7 K, T2 = 500
K, for the a = 20 Å grains, and
k = 0.168, T1 = 2.7 K, T2 = 80 K, for the a = 5
Å grains. Here I am assuming that
the very small grains emit the bulk of their radiation as a continuum.
Roche (1988)
estimates that galaxies emit 1% of their energy in the form of
unidentified features
and as only 10% of the energy of galaxies is emitted at 2-20 µ, we
can infer that only
about 10% of the radiation from very small grains emerges as the
unidentified
features. It will be relatively simple to incorporate these features
into the calculation in future.
In the earlier calculation
(Rowan-Robinson
1986),
I considered values of the
wavelength at which the absorption efficiency of the 0.1 µ grains
steepened from Q
 to
Q
2 of 100, 316 and 1000
µ. In the present model I take this wavelength
to be 80 µ, which is still consistent with the IRAS data for
circumstellar dust shells
(with the possible exception of IRC+10216,
Rowan-Robinson et al
1986)
and gives an acceptable fit to the data for high latitude dust clouds in our
Galaxy. The possibility
that Q
to a wavelength significantly larger
than 100 µm is now completely ruled
out by observations in our Galaxy and other galaxies.
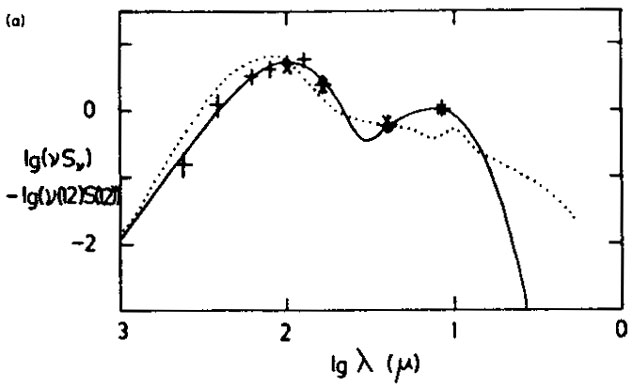
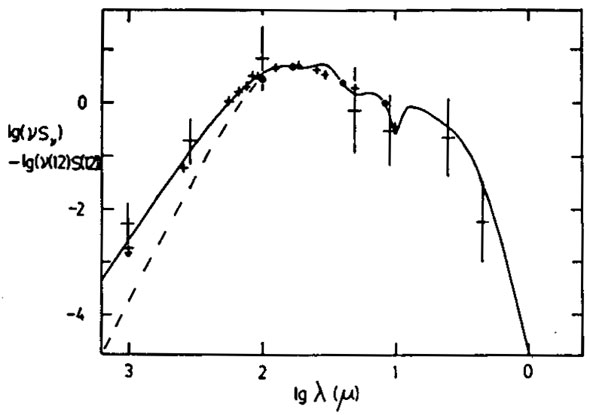
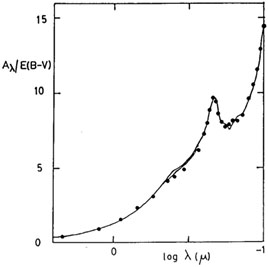
Fig 9a shows the fit to the
interstellar extinction curve at visible and ultraviolet wavelengths.
Fig 9b shows the
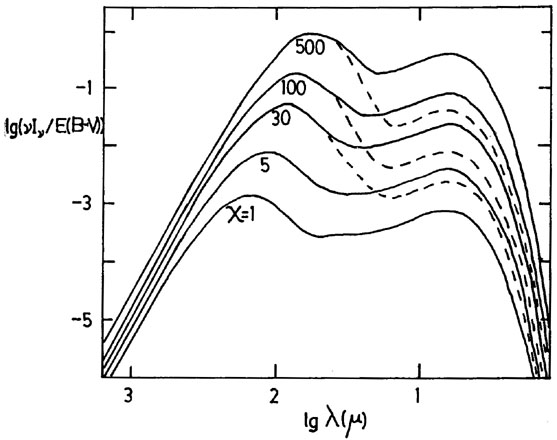
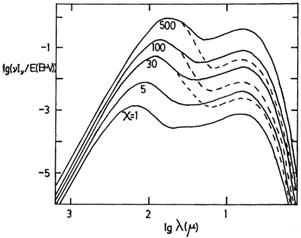
overall fit at 0.1-1000 µ. Fig 10 shows
the predicted emission spectra for
interstellar dust in the infrared for a range of heating intensities
(the temperatures of the different grain components are given in
Table 1). For X
to
Q
2 of 100, 316 and 1000
µ. In the present model I take this wavelength
to be 80 µ, which is still consistent with the IRAS data for
circumstellar dust shells
(with the possible exception of IRC+10216,
Rowan-Robinson et al
1986)
and gives an acceptable fit to the data for high latitude dust clouds in our
Galaxy. The possibility
that Q
to a wavelength significantly larger
than 100 µm is now completely ruled
out by observations in our Galaxy and other galaxies.
Fig 9a shows the fit to the
interstellar extinction curve at visible and ultraviolet wavelengths.
Fig 9b shows the
overall fit at 0.1-1000 µ. Fig 10 shows
the predicted emission spectra for
interstellar dust in the infrared for a range of heating intensities
(the temperatures of the different grain components are given in
Table 1). For X
 30, the effect of
90% depletion of the 5 Å grains is also illustrated.
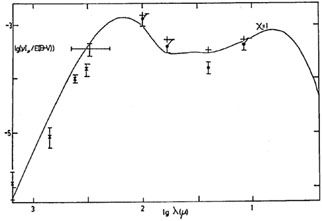
Fig 11a shows the predicted
emissivity for grains immersed in the local interstellar radiation field
compared with
observations of high latitude clouds. The agreement with observations is
excellent both
in the shape of the spectrum and in the absolute value of the
emissivity. The 12-100
µm emissivity of the isolated cloud observed by
Herter et al (1990)
also agrees with that predicted in Fig 11a.
30, the effect of
90% depletion of the 5 Å grains is also illustrated.
Fig 11a shows the predicted
emissivity for grains immersed in the local interstellar radiation field
compared with
observations of high latitude clouds. The agreement with observations is
excellent both
in the shape of the spectrum and in the absolute value of the
emissivity. The 12-100
µm emissivity of the isolated cloud observed by
Herter et al (1990)
also agrees with that predicted in Fig 11a.
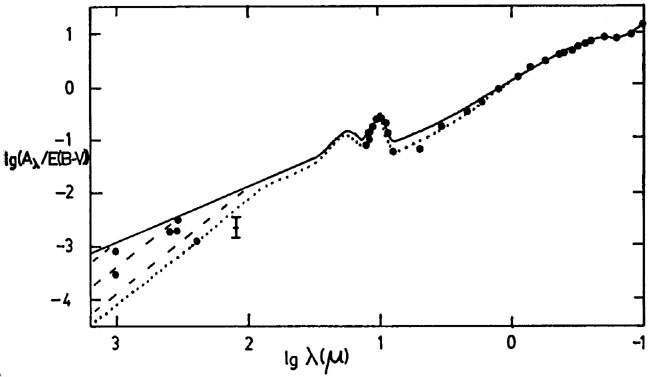
|

|
Figure 9. Fit to interstellar extinction
curve for model described in section 5
(a) at visible and ultraviolet wavelengths (upper curve:
Rowan-Robinson
1986,
lower curve: revised model (differs only near 0.4 µm) (b) in the
infrared (solid and broken curves:
Rowan-Robinson
1986,
dotted curve: revised model). References for observations are given in
Rowan-Robinson
(1986).
|
TABLE 1: PARAMETERS FOR GRAIN MODEL
|
| type | B0
| abundance | % cosmic
| grain temperatures
|
| |
| (× 10-4) |
| X = 1 | X = 10 | X = 500
|
|
| 0.1µ amor Si | 1.36 | 0.257
| 77 | 14.5 | 21.4 | 42.6
|
| 0.03µ Si | 1.10 | 0.063
| 19 | 16.8 | 24.5 | 47.0
|
| 0.01µ Si | 0.52 | 0.010
| 3 | 17.5 | 25.4 | 48.5
|
|
|
| 0.1µ amor C | 0.45 | 1.02
| 20 | 15.3 | 22.6 | 46.0
|
| 0.03µ C | 0.65 | 0.45
| 9 | 19.3 | 28.7 | 60.3
|
| 0.01µ C | 1.0 | 0.24
| 4.7 | 19.7 | 29.0 | 61.7
|
| 0.002µ C | 0.8 | 0.039
| 0.8 | | |
|
| 0.0005µ C | 0.8 | 0.010
| 0.2 | | |
|
|
|
Figure 10. Predicted infrared emissivity of
interstellar grains (ergs/cm2/s/mag) as a
function of the intensity of the radiation field. For X
30, the effect of a 90%
destruction of the smallest grains (5 Å) is shown as broken
curves.
|
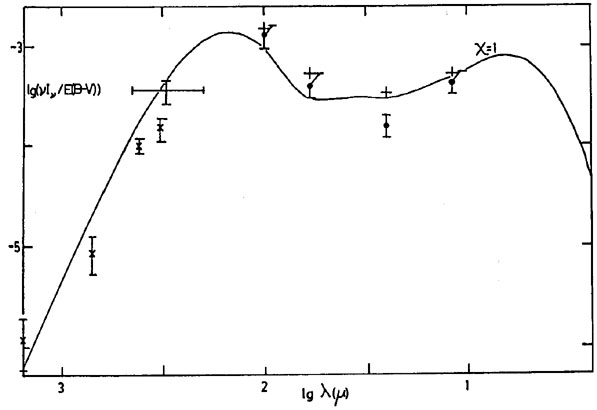
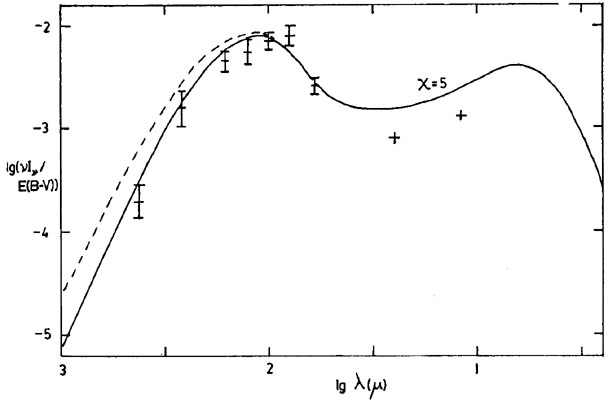
Fig 11b shows the corresponding prediction and
observations for the central regions
of the Galaxy (I < 30°), where the intensity of the radiation field
corresponds to X = 5: the fit is also satisfactory.
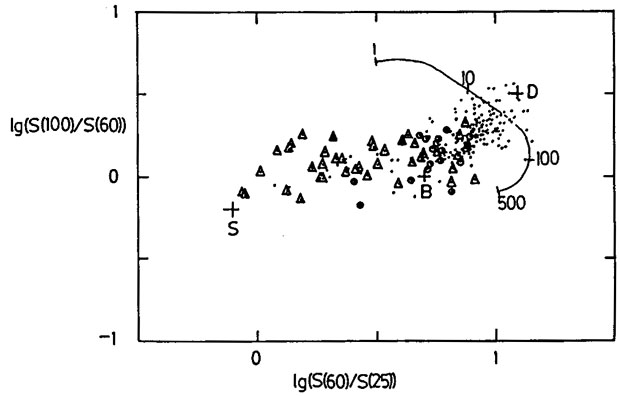
Fig 12 shows the predicted IRAS colour-colour
diagrams for X = 1-500 (color-corrected as in Appendix A of
Rowan-Robinson and
Crawford 1989)
compared with observations. Figs 12a and
b show the data for the
unresolved IRAS galaxies studied by
Rowan-Robinson and
Crawford (1989).
Figs 12c
and d show data for resolved IRAS galaxies
mapped by
Rice et al
(1988) and
Young et al (1989).
Galaxies with log{S(60) / S(25)}
0.5 need the additional Seyfert
component peaking at 25 µm. For the resolved galaxies, most of
which can be
explained as pure disc (cirrus) emission, it can be seen that a range of
heating intensities are present, from X = 1 for NGC205 to X = 30 for
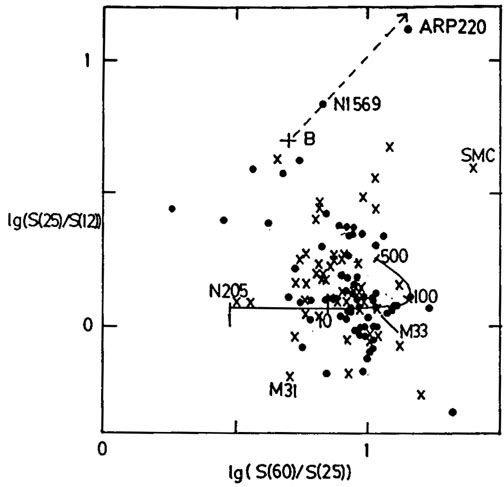
M33. The vast majority of the galaxies whose colors
are shown in
Figs 12 can be understood as a mixture of
Seyfert (S) + starburst (B) + one of the cirrus models (curved
lines). There are 3
classes of exception to this. (a) Two galaxies, NGC1569 and Arp 220
appear to lie on
the locus of a highly extinguished starburst model. (b) Several
galaxies, notably the
SMC, lie to the right of the cirrus curve in the
25-60-100 µm colour-colour
diagram and above and to the right of the cirrus curve in the 12-25-60
µm diagram,
consistent with the effect of destruction of very small grains at high
heating
intensities. However not all galaxies with high heating intensity show
evidence for
very small grain destruction. M33, which like the SMC has a spectrum
consistent
with X = 30, appears to have a normal abundance of very small grains. It
is also
worth noting that there appear to be no galaxies in which the abundance
of 5 Å grains
is reduced by more than a factor of 10 compared to the solar
neighborhood. The
possibility that reduction in the carbon abundance in galaxies (but not
the silicon) is
the cause of the anomalous colors needs to be explored, especially for
the SMC. (c)
Several galaxies, for example M31, have 25-60-100 µm colors
consistent with
cirrus but have very low values of S(25)/S(12), implying excess
radiation at 12 µm. Possible explanations of this are a strong
contribution from circumstellar dust shells
(Soifer et al 1986,
Rowan-Robinson and
Chester 1987:
though for M31 the
spatial distribution of the 12 µm radiation does not differ from
that at longer
wavelengths) or an unusually strong contribution from PAH/very small
grains. 8-13
µm spectroscopy of these galaxies would be very valuable.
|
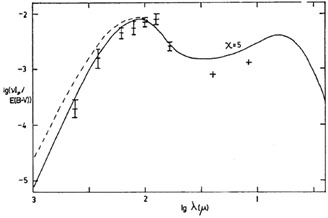
|
Figure 11. Predicted emissivity, compared
with observations (a) towards the Galactic pole (X = 1, data from
Boulanger & Perault
1988,
Halpern et al 1988,
Fabbri et al 1988,
assumed E(B - V) = 0.05), (b) towards the central
regions of the Galaxy (X = 5, data from
Beichman 1987
and refs therein, assumed E(B - V) = 6.1). The broken curve
shows the effect of assuming the wavelength at which the absorption
efficiency of the grains steepens is > 1mm.
|
Discrepant colors occasionally result from poorly determined fluxes,
especially at
25 µm where not all IRAS detectors were functioning. For this
reason galaxies with fluxes less than 0.4 Jy in any band were omitted from
Fig 12. However in general
experience suggests that IRAS colors are accurate to 0.1 in
log10 and that any discrepancy greater than this has a real
cause.
6. FAR INFRARED AND SUBMILLIMETRE MAPPING OF GALAXIES
Prior to the launch of IRAS rather little information on the spatial
extent of far
infrared emission in galaxies was available. Some of the earlier work
has been reviewed by
Telesco (1988).
One of the most significant pre-IRAS studies was by
Smith (1982),
who produced a 170 µ map of the disk of M51, which showed that the
bulk of the far infrared emission in M51 is produced by dust associated
with the diffuse gas in the disk of the galaxy.
IRAS extended data is still under active study by several
groups. Detailed maps have been produced of M31
(Habing et al 1986,
Soifer et al
1987 and
Walterbos and
Schwering 1987),
M33
(Rice et al 1990)
and of the Magellanic Clouds
(Schwering 1988).
Rice et al (1988)
have published coadded IRAS maps for all galaxies with
optical extent greater than 8'. Higher resolution images may be expected
for many of
these galaxies from the use of maximum entropy and other deconvolution
techniques now under active study at IPAC and elsewhere (e.g.
Canterna et al
1990).
Subsequent studies have for the most part concentrated on wavelengths
longer than 100 µ.
Stark et al (1989)
have mapped 4 Virgo spirals at 160 and 350 µ and shown
that that there is no evidence for a grain component whose emission
peaks beyond 200 µ, a prediction of grain models with emissivity
Q
at wavelengths > 100 µ.
Eales and
Wynn-Williams (1989)
have measured 350 and 450 µ fluxes at locations
centered on several galaxies with a 100 beam. 160 µm maps have been
published of NGC4449
(Thronson et al
1987),
NGC4214
(Tnronson et al
1988),
NGC 4485 and 4490
()
and NGC1569 and 3593
(Hunter et al 1989).
have published maps of IC10 at 95 and 160 µ and given
fluxes for several other galaxies.
Eckart et al (1990)
have mapped Centaurus A at 50
and 100 µ, and have separated the cirrus and starburst components.
have mapped M82 at 450 µm,
have mapped M83 at 100 µm and
Engargiola and Harper
(1990)
have mapped NGC6946 at 100, 160 and 250 µ.
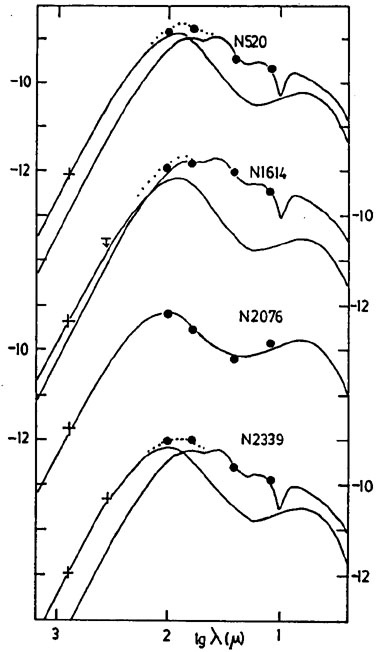
Hughes et al (1989)
have mapped 8 IRAS galaxies at 800 µm with JCMT and
given some 450 and 1100 µm data for some of them. The importance of
the longer wavelengths is that the most reliable estimates of dust mass
can be obtained at these
wavelengths. Fig 13 shows far infrared spectra
of selected galaxies from this latter
study, with theoretical fits derived from the models described in
section 5.
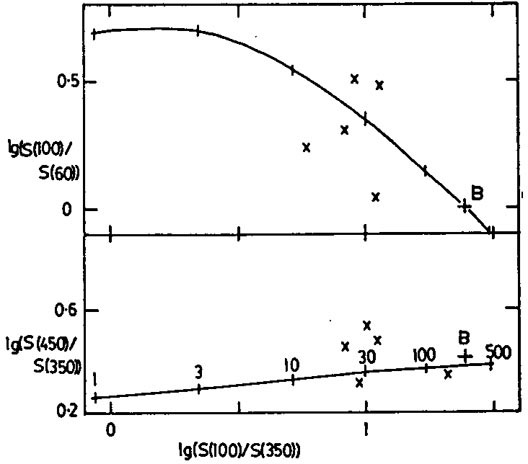
Fig 14a-d show colour-colour
diagrams derived from the work of
Thronson et al
(1990),
Hughes et al (1989)
and Eales and
Wynn-Williams (1989)
compared with the predictions of the models of
section 5.
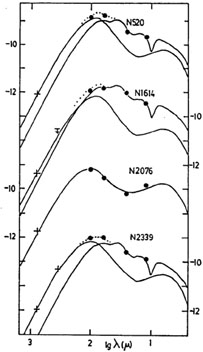
|
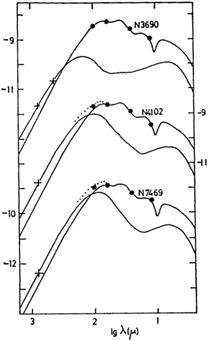
|
Figure 13. Far infrared and submillimeter
spectra of galaxies mapped by
at 800 µm, compared with models of
section 5. For NGC 2076 a pure cirrus
model, with depletion of the smallest grains, is satisfactory. For the
other galaxies
both cirrus and starburst components are required (the dotted curve
indicates the
total predicted flux). Parameters for the models are given in
Table 2.
|
7. DETERMINATION OF DUST MASS IN GALAXIES
Hildebrand (1983)
gave a prescription for deriving dust masses in galaxies from far
infrared data which has been widely used.
Young et al (1989)
have used the
Hildebrand prescription to conclude that the average gas-to-dust ratio
in galaxies is 1200.
Draine (1990)
has given a discussion of the derivation of dust masses which
emphasizes some of the difficulties. He emphasizes that here is considerable
disagreement about the grain opacity at long wavelengths, though this
disagreement is
somewhat exaggerated by illustrating the most extreme of the models
discussed by
Rowan-Robinson
(1986)
in which Q
all the way to 1 mm. Draine shows
that if
only IRAS observations are available of galaxies, then the derivation of
dust mass is
very uncertain, since several rather different models could in principle
be fitted to
the same observations. However provided a significant proportion of the
12-100 µm
emission from a galaxy is due to cirrus, and fluxes are available in all
four IRAS
bands, a good separation into cirrus and starburst components can be
made, and
reasonable estimates of dust mass derived. Observations at long
wavelength (> 300
µm) are very valuable in tying down the value of X , the radiation
field intensity, and
are essential if the 12-100 µm spectrum is dominated by a starburst.
Table 2 gives dust masses derived from the study
of
Hughes et al (1989)
based on the grain model of
Rowan-Robinson (1989)
described in section 5 above. Comparison of
the dust mass in the cirrus component with the neutral hydrogen masses
given by
Young et al (1989)
shows normal gas-to-dust ratios for this model in most cases.
However since in many cases the neutral hydrogen in a galaxy extends
well beyond the
optical image, whereas the bulk of the infrared emission is generally
located within
the optical image, there may be a tendency to underestimate the total
dust mass from
far infrared observations. Dust in the outer parts of a galaxy,
illuminated with a
starlight intensity much lower than in the central regions, may
contribute only a very
small fraction of the total infrared flux. Sensitive observations at
long wavelengths
with large beam-throws will be needed to characterize such dust.
Table 2. PARAMETERS FOR GALAXIES MAPPED BY
HUGHES ET AL (1989)
|
| galaxy | distance | ________
| cirrus model | ___________
| starburst model
|
| | (Mpc) | X | depletion
| log Md(C) | log M(HI) | log Md(SB)
|
| | (H=50) | | of 5 Å grains
| | |
|
|
| NGC520 | 45.4 | 30 | 90%
| 7.25 | 10.10 | 5.94
|
| NGC1614 | 92.9 | 30 | 90%
| 7.57 | 9.88 | 6.83
|
| NGC2076 | 48.4 | 10 | 50%
| 7.73 | |
|
| NGC2339 | 46.7 | 10 | 90%
| 7.50 | 10.05 | 5.75
|
| NGC3690 | 62.1 | 1 | -
| 8.34 | <9.73 | 6.97
|
| NGC4102 | 19.7 | 10 | 90%
| 6.97 | 9.02 | 5.60
|
| NGC7469 | 102.0 | 30 | 90%
| 7.63 | 9.90 | 6.80
|
|
It is important when modeling the far infrared emission from dust in
galaxies to take
account of the fact that several grain components are present, at different
temperatures. Calculations based on the assumption of a single composite
grain model
and a single temperature are unlikely to yield accurate results. However
the cirrus
models of Fig 10 can be
approximately fitted at long wavelengths with a
2B (T) curve, with the values of T as given in
Table 3 for different X. The validity of this fit
is for  > 1700/T
µm. Also given for these models are the values of
log{S(100) / S(60)} and log {Md / S(100µm)
D2}, log {Md / S(800µm) D2}. Note that
whereas Md/S100 D2
approximately proportional to X, Md / S800
D2 approximately proportional to X0.3, so much
more accurate dust
masses can be obtained if long wavelength observations are available.
> 1700/T
µm. Also given for these models are the values of
log{S(100) / S(60)} and log {Md / S(100µm)
D2}, log {Md / S(800µm) D2}. Note that
whereas Md/S100 D2
approximately proportional to X, Md / S800
D2 approximately proportional to X0.3, so much
more accurate dust
masses can be obtained if long wavelength observations are available.
Table 3. CIRRUS MODEL PARAMETERS FOR DUST MASS
DETERMINATION
|
| X=
| 1 | 3 | 5 | 10 | 20 | 30 | 50
| 100 | 200 | 500 | SB
|
| log{S(100) / S(60)}
| 0.69 | 0.70 | 0.64 | 0.54 | 0.44 | 0.34 | 0.24
| 0.13 | 0.03 | -0.11 | 0.0
|
| T(
2B) a
| 16 | 19 | 21 | 24 | 27 | 29 | 31
| 34 | 37 | 43 | 40
|
| log(Md/s100 D2) b
| 4.08 | 3.42 | 3.16 | 2.83 | 2.60 | 2.37 | 2.17
| 1.93 | 1.67 | 1.44 | 1.33
|
| log (Md/S800 D2) b
| 4.99 | 4.84 | 4.78 | 4.70 | 4.62 | 4.57 | 4.52
| 4.43 | 4.34 | 4.19 |
|
|
| a valid for
> 1700/T µm
|
| b solar masses/(Jy Mpc2)
|
8. DUST IN ELLIPTICALS AND LENTICULARS
There has been a growing realization that ellipticals and lenticulars
have a significant
interstellar medium, and that interesting amounts of star formation take
place there.
There has been a decade of work on HI emission from ellipticals and more
recently CO observations in several cases (see e.g. the reviews by
Wardle & Knapp
(1986)
and Schweizer
(1987)).
Although the majority of the galaxies detected by IRAS are
spirals, quite a number of ellipticals and lenticulars were detected
(e.g.
Jura 1986,
Jura et al 1987,
Knapp et al 1989).
Thronson and Bally
(1987)
have studied the IRAS colour-colour diagrams for these galaxies and
conclude that they occupy the
same region of the diagrams as spiral galaxies (and, for that matter,
star forming regions in our Galaxy). About 2/3rds of the sample they
studied have the colors
characteristic of cirrus and 1/3rd those of dusty regions surrounding
young stars.
The star formation rate they derive (0.1-1 M0/year) is
comparable to the mass-loss
rate for evolved stars in these galaxies, but mergers and gas infall may
also contribute significantly.
Bally and Thronson
(1989)
studied the IRAS data for a sample of 74 S0
galaxies which had known single-dish radio fluxes. 30% were detected in
all 4 IRAS bands and 80% were detected in at least one band. The
galaxies divided into those which followed the infrared-radio relation
for spirals, for which the radio emission
is presumably due to normal star formation, and those with excess radio
emission, presumably due to an active nucleus and jets or lobes. A small
number showed a slight
excess of infrared to radio. Similar conclusions were reached by
Walsh et al (1989).
Knapp et al (1989)
report that 2/3rds of a sample of several hundred S0s are
detected by IRAS at 60 and 100 µm.
Thronson et al
(1989b)
examined the IRAS data for 150 lenticular and elliptical 'shell' galaxies
(Malin and Carter
1983),
which are believed to be the result of low
velocity mergers. Although some of the galaxies showed evidence for
enhanced star
formation, the majority did not and they concluded that either (1) the
merging
galaxies are almost always E or S0 with only modest amounts of
interstellar gas, or
(2) the time-scale for creation and maintenance of the shell is longer
than the
timescale for the starburst event, or (3) the formation of a shell
structure requires a
mass difference between the galaxies of a factor 10-100, so only a small
fraction of the i.s.m. is heated or participates in star formation.
Walsh and Knapp
(1990)
find that the ellipticals detected by IRAS tend preferentially
to be those with dust lanes visible in the optical. However the infrared
properties are
not strongly dependent on the visible dust content. They also find a
slightly enhanced
100 µm detection rate for ellipticals with shells, boxy isophotes
or inner discs, all of
which are evidence of a recent merger, a result which is not necessarily
inconsistent with that of
Thronson et al
(1990).
It is unfortunate that the infrared sources associated with early type
galaxies are
almost all rather weak, so that there is little immediate prospect of
detection at
wavelengths > 300 µm, and hence of accurate dust mass determinations.
REFERENCES
Allamandola, L. J., Tielens, A. G., & Barker, J. R.,
1985, Ap.J. 290, L25.
Allen, M., & Robinson, G. W.,
1975, Ap.J. 195, 81.
Andriesse, C. D.,
1978, A.A. 66, 169.
Bally, J., & Thronson, H. A., Jr,
1989, A.J. 97, 69.
Beichman, C. A.,
1987, A.R.A.A. 25, 521.
Bernard, J. P, & Desert, X., 1990, in
Interstellar Medium in External Galaxies - Contributed
Papers, p. 105.
Boulanger, F., Baud, B., & van Albada, G. D.,
1985, A.A. 144, L9.
Boulanger, F., Beichman, C., Desert, F. X., Helou,
G., Perault, M., & Ryter, C.,
1988, Ap.J. 332, 328.
Boulanger, F., & Perault, M.,
1988, Ap.J. 330, 964.
Canterna, R., Hackwell, J. A., & Grasdalen, G. L.,
1990, in
Interstellar Medium in
External Galaxies - Contributed Papers, p. 301.
Crawford, J., & Rowan-Robinson, M.,
1986, MNRAS 221, 923.
Cox, P., & Mezger, P. G.,
1989, Astron. Astrophys. Review., 1, 49.
Desert, F. X., and Dennefeld, M.,
1988, A.A. 206, 227.
Donn, B.,
1968, Ap.J. 152, L129.
Draine, B. T., 1989, in
22nd ESLAB Symposium, Infrared Spectroscopy in
Astronomy, p. 93.
Draine, B. T., 1988, in
IAU Symposium 135, Interstellar Dust, eds.
L. J. Allamandola & A. G. G. M. Tielens (Reidel), p. 313.
Draine, B. T., 1990, in
Interstellar Medium in Galaxies, p. 483.
Draine, B. T., & Anderson, N.,
1985, Ap.J. 292, 494.
Draine, B. T., & Lee, H. M.,
1984, Ap.J. 285, 89.
Duley, W. W.,
1973, Nature Phys. Sci. 244, 57.
Duley, W. W.,
1987, MNRAS 229, 203.
Duley, W. W., & Williams, D. A.,
1981, MNRAS 196, 269.
Duley, W. W., & Williams, D. A.,
1988a, MNRAS 231, 969.
Duley, W. W., & Williams, D. A.,
1988b, MNRAS 230, 1p.
Eckart, A., Cameron, M., Rothermel, H., Wild, W.,
Zinnecker, H., Olberg, M., Rydbeck, G., & Wiklind, T., 1990, in
Interstellar Medium in External Galaxies - Contributed
Papers, 368.
Eales, S. A., and Devereux, N., 1990, in
Interstellar Medium in External Galaxies - Contributed
Papers, p. 103.
Eales, S. A., Wynn-Williams, G., & Duncan, W. D.,
1989, Ap.J. 339, 859.
Efstathiou, A., & Rowan-Robinson, M.,
1990, MNRAS 245, 275.
Engargiola, G., & Harper, D. A., 1990, in
Interstellar Medium in External Galaxies - Contributed
Papers, p. 97.
Fabbri, R., Guidi, I., Natale, V., & Ventura, G.,
1988, preprint.
Gillett, F. C., Forrest, W. J., & Merrill, K. M.,
1973, Ap.J. 183, 87.
Gosh, S. K., & Drapatz, S.,
1987, A.A.
Greenberg, J. M., 1968, in
Stars and Stellar Systems, Vol. 7, ed. Middlehurst et al
(Chicago Univ. Press), p. 221.
Guhathakurta, P., & Draine, B. T.,
1989, Ap.J., 345, 230.
Habing, H. J., et al,
1984, Ap.J. 278, L59.
Halpern, M., Benford, R., Meyer, S., Muehlner, D., &
Weiss, R.,
1988, Ap.J. 332, 596.
Helou, G.,
1986, Ap.J. 311, L33.
Helou, G., 1989, in
IAU Symposium 135, Interstellar Dust in
Galaxies, p. 285.
Herter, T., Shupe, D. L., & Chernoff, D. F.,
1990, Ap.J., 352, 149.
Hildebrand, R. H.,
1983, QJRAS 24, 267.
Hughes, J., Rowan-Robinson, M., Lawrence, A., &
Crawford, J.,
1989 (in preparation).
Hunter, D. A., Thronson, H. A., Jr, Casey, S., &
Harper, D. A.,
1989, Ap.J. 341, 697.
de Jong, T., et al,
1984, Ap.J. 278, L67.
de Jong, T., & Brink, K., 1987, in
Star Formation in Galaxies,
ed. C. L. Persson, p. 323.
Jones, A. P., Duley, W. W., & Williams, D. A.,
1987, MNRAS 229, 213.
Jura, M.,
1986, Ap.J. 306, 483.
Jura, M., Kim, D. W., Knapp, G. R., & Guhathakurta, P.,
1987, Ap.J. 312, L11.
Knapp, G. R., Guhathakurta, P., Kim, D. -W., &
Jura, M.,
1989, Ap.J. Supp. 70, 329.
Leech, K. J., Lawrence, A., Rowan-Robinson, M.,
Walker, D., & Penston, M. V.,
1988, MNRAS 231, 977.
Leech, K. J., Penston, M. V., Terlevich, R.,
Lawrence, A., Rowan-Robinson, M., & Crawford, J.,
1989, MNRAS 240, 349.
Leene & Cox,
1987, A.A. 174, L1.
Leger, A., & Puget, J. L.,
1984, A.A. 128, 212.
Leisawitz, D., 1990, in
Interstellar Medium in External Galaxies -
Contributed Papers, p. 111.
Malin, D. F., & Carter, D.,
1983, Ap.J. 274, 534.
Mathis, J. S., Rumpl, W., & Nordsieck, K. H.,
1977, Ap.J. 217, 425.
Mathis, J. S., Mezger, P. G., & Panagia, N.,
1983, A.A. 128, 212.
Mathis, J. S., & Whiffen, G.,
1989, Ap.J. 341, 808.
Pajot, F., Boisse, P., Gispert, R., Lamarre, J. M.,
Puget, J. -L., & Serra, G.,
1986 A.A. 157, 393.
Persson, C., & Helou, G.,
1987, Ap.J. 314, 513.
Platt, J. R.,
1956, Ap.J. 123, 486.
Price, S. D.,
1981, A.J. 86, 193.
Puget, J. L., & Leger, A.,
1989, A.R.A.A. 27, 161.
Purcell, E. M.,
1976, Ap.J. 206, 685.
Rice, W., Lonsdale, C. J., Soifer, B. T., Neugebauer,
G., Kopan, E. L., Lloyd, L. A., de Jong, T., & Habing, H. J.,
1988, Ap.J. Supp. 68, 91.
Rice, W., Boulanger, F., Viallefond, F., Soifer,
B. T., & Freedman, W. L.,
1990, Ap.J. 358, 418.
Roche, P. F., 1988, in
22nd ESLAB Symposium, Infrared Spectroscopy in Astronomy.
Rowan-Robinson, M.,
1979, Ap.J. 234, 111.
Rowan-Robinson, M., 1982, in
Submillimeter Astronomy, ed. P. Phillips &
J. Beckman (CUP), p. 47.
Rowan-Robinson, M.,
1986, MNRAS 219, 737.
Rowan-Robinson, M., 1987a, in
Star Formation in Galaxies, ed. C. Persson,
p. 133.
Rowan-Robinson, M., 1987b, in
Starbursts and Galaxy Evolution, Des T. X. Thuan,
T. Montmerle & J. T. T. Van (Edition Frontieres) p. 235.
Rowan-Robinson, M., & Chester, T.,
1987, Ap.J. 313, 413.
Rowan-Robinson, M., Lock, T. D., Walker, D. W., &
Harris, S.,
1986, MNRAS 222, 273.
Rowan-Robinson, M., & Crawford, J., 1986, in
Light on Dark Matter, ed. F. P. Israel
(Reidel) p. 421.
Rowan-Robinson, M., & Crawford, J.,
1989, MNRAS 238, 523.
Ryter et al,
1987, A.A. 186, 312.
Sakato, A., Wada, S., Tanabe, T., & Onaka, T.,
1983, Nature 301, 493.
Sakato, A., Wada, S., Tanabe, T., & Onaka, T.,
1984, Ap.J. 287, L51.
Schweizer, F., 1987, in
IAU Symposium 127, Structure and Dynamics of
Elliptical Galaxies (Reidel), p. 109.
Schwering, P.,
1988, Ph.D. thesis, Univ. of Leiden.
Sellgren, K.,
1984, Ap.J. 277, 623.
Soifer, B. T., Houck, J. R., & Neugebauer, G.,
1987, A.R.A.A. 25, 187.
Soifer, B. T., Rice, W. L., Mould, J. R., Gillett,
F. C., Rowan-Robinson, M., & Habing, H. J.,
1986, Ap.J. 304, 651.
Smith, J.,
1982, Ap.J. 261, 463.
Smith, P. A., Brand, P. W. J. L., Puxley, P. J.,
Mountain, C. M., Gear, W. K., & Nakai, N., 1990a,
Interstellar Medium in External Galaxies -
Contributed Papers, p. 81.
Smith, B. J., Lester, D. F., & Harvey, P. M., 1990b,
Interstellar Medium in External Galaxies -
Contributed Papers, p. 84.
Stark, A. A., Davidson, J. A., Harper, D. A.,
Pernic, R., Loewenstein, R., & Casey, S.,
1989, Ap.J. (in press).
Telesco, C. M.,
1988, A.R.A.A. 26, 343.
Telesco, C. M., Becklin, E. E., & Wynn-Williams, G.,
1984, Ap.J. 282, 427.
Telesco, C. M., Decher, R., & Joy, M.,
1989, Ap.J. 343 L13.
Thronson, H. A., Jr, & Bally, J.,
1987, Ap.J. 319, L63.
Thronson, H. A., Jr, Hunter, D. A., Telesco, C. M.,
Harper, D. A., & Decher, R.,
1987, Ap.J. 317, 180.
Thronson, H. A., Jr, Hunter, D. A., Telesco, C. M.,
Greenhouse, M., & Harper, D. A.,
1988, Ap.J. 334, 605.
Thronson, H. A., Jr, Hunter, D. A., Casey, S.,
Latter, W. B., & Harper, D. A.,
1989a, Ap.J. 339, 803.
Thronson, H. A., Jr, Hunter, D. A., Casey, S., &
Harper, D. A.,
1990, Ap.J. 355, 94.
Thronson, H. A., Jr, Bally, J., & Hacking, P.,
1989b, A.J. 97, 363.
Tielens, A. G. G. M., & Allamandola, L. J., 1987, in
Interstellar Processes, Eds.
D. Hollenbach & H. A. Thronson Jr (Reidel) p. 397.
Walsh, D. E. P., Knapp, G. R., Wrobel, J. M., & Kim,
D. -W.,
1989, Ap.J. 337, 209.
Walsh, D., & Knapp, J., 1990,
Interstellar Medium in External Galaxies -
Contributed Papers, p. 120.
Walterbos, R. A. M., & Schwering, P. B. W.,
1987, A.A. 180, 27.
Wardle, M., & Knapp, G. R.,
1986, A.J. 91, 23.
Williams, D. A., 1989, preprint.
Young, J. S., Xie, S., Kenney, J. D. P., & Rice,
W. L.,
1989, Ap.J. Supp. 70, 699.