


Having discussed many of the potential pitfalls in determining the
4 He abundance in individual extra-galactic HII regions, we
can now
discuss the methodology for making such a determination. As we noted
earlier, a He abundance can be inferred for each He I emission line
observed by comparing the ratio of its observed intensity to
H with the theoretical ratio and correcting for the effects of collisional
excitation, florescence and underlying He I absorption. Thus, as per the
discussion of the previous sections, we need to determine three physical
parameters, the density, n, the optical depth,
with the theoretical ratio and correcting for the effects of collisional
excitation, florescence and underlying He I absorption. Thus, as per the
discussion of the previous sections, we need to determine three physical
parameters, the density, n, the optical depth,
 , and the
equivalent width for underlying helium absorption,
aHeI. As argued by
ITL94 and ITL97, a self-consistent determination of the parameters, if
possible, is preferable. Below we describe a few possible methods for
such a determination and stress the need for a careful accounting of the
resulting errors, which we deem requires a Monte Carlo simulation of the
data.
, and the
equivalent width for underlying helium absorption,
aHeI. As argued by
ITL94 and ITL97, a self-consistent determination of the parameters, if
possible, is preferable. Below we describe a few possible methods for
such a determination and stress the need for a careful accounting of the
resulting errors, which we deem requires a Monte Carlo simulation of the
data.
As we noted above and discuss in detail below, different He I lines are
more or less sensitive to the different physical parameters.
In principle, it is possible to fix these parameters by minimizing
 2 using only the
three best determined line strengths,
2 using only the
three best determined line strengths,
 4471,
5876 and
6678.
However, because these line strengths are not very sensitive to
any of the physical parameters of interest, it may be preferable to
consider two or even more additional wavelengths. We describe these
various possibilities below. Once the parameters and their associated
uncertainties have been fixed, the He abundance may be determined by
averaging over all of the He I lines used in the determination of the
physical parameters.
4471,
5876 and
6678.
However, because these line strengths are not very sensitive to
any of the physical parameters of interest, it may be preferable to
consider two or even more additional wavelengths. We describe these
various possibilities below. Once the parameters and their associated
uncertainties have been fixed, the He abundance may be determined by
averaging over all of the He I lines used in the determination of the
physical parameters.
We note that we are adopting a different philosophical approach
here compare to that in IT98. In the final calculation of
y+, IT98
use only the main three lines to obtain the final He abundance.
Additionally, they adopt and report a minimum density of 10 cm-3
(reduced from the minimum density of 50 cm-3 adopted in ITL97)
and not lower densities which may be derived from their minimizations.
To be truly "self-consistent" would imply that the helium abundance is
derived from all observed lines and the physical parameters are those
resulting from the minimization. An inspection of the IT98 data reveals
that often the He/H ratios derived from the
7065 and
3889 lines are
significantly different from the He/H ratios derived from the main three
lines. Additionally, when their minimization
routine is applied, one often finds unrealistically small values of the
density. We take these as warning signs that in some cases either the
minimization is not finding the best possible solution due to a
degeneracy in the 2
minimization, or there are problems with the input data.
In such cases, it makes
sense to either reject the object from derivations of the primordial
helium abundance or to attribute a larger uncertainty to account for
the lack of self-consistency in the minimization solution.
We begin our discussion of the merits of various minimization routines
by examining the dependence of the line strengths (for the
six He I lines of interest) on the physical parameters, n,
, and
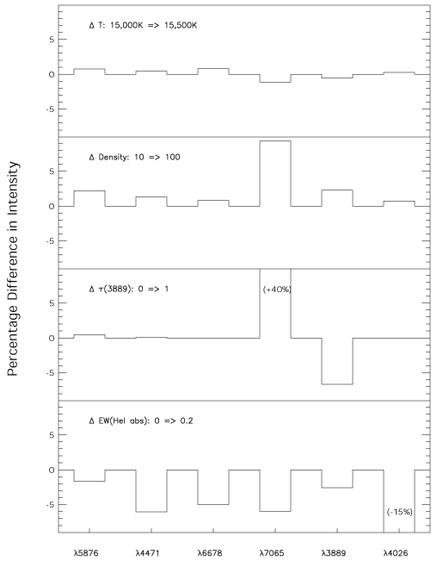
aHeI. Figure 4 shows six He I
emission lines and their relative
dependences on the different effects discussed in the last sections. We
show the relative effects for a baseline model of T = 15,000K,
n = 10 cm-3,
= 0, and no underlying stellar He I
absorption (aHeI = 0). The top panel of
Figure 4 shows the effects
of an error of 500 K. This is of order or larger than the errors
typically quoted for electron temperatures for high quality spectra. It
can be seen that reasonable errors in electron temperature (or
temperature fluctuations) will have a relatively small
effect on the derived He/H abundances (note, however, that
Peimbert, Peimbert, &
Ruiz 2000
have found that a coupling between temperature
and density allows solutions with small differences in temperature to
result in significant differences in density resulting in larger
than expected changes in the derived helium abundance).
|
Figure 4. Histograms showing the effects on
helium
emission lines due to changes in physical parameters. The baseline
model is a photoionized gas at 15,000 K with a density of 10
cm-3, a negligible optical depth in the
|
The second panel from the top in Figure 4 shows
the effect of increasing the density from 10 to 100 and the subsequent
collisional enhancement of the He I lines. Clearly, of
the six lines, 7065 is
most sensitive to this effect.
Of the three lines normally used to calculate He/H abundances,
5876 is the most sensitive
and 6678 is the least
sensitive. 7065 would be
an ideal density diagnostic if not for the sensitivity to
optical depth shown in the third panel.
The third panel from the top in Figure 4 shows
the effect of increasing
the optical depth (3889) from
zero to one. 7065
has a strong sensitivity to optical depth effects.
3889
is also sensitive to (3889), and
in the opposite sense, so that in combination these two lines could act
to constrain both density and optical depth. Unfortunately,
3889 is blended with H8
(3890).
Thus, in order to derive an accurate
F(3889) /
F(H)
ratio, the F(3890) must be
subtracted off and
underlying stellar H I (and He I) absorption must be corrected for.
This generally implies a relatively large uncertainty for
F(3889), and thus, a
larger uncertainty in the density and optical depth measures than one would
hope for.
Finally, the bottom panel in Figure 4 shows the
effects of 0.2 Å of underlying stellar absorption. The difference
of a factor of three between the effect on
5876
and 4471 and
6678 means that there is
some sensitivity to underlying absorption through the
analysis of just those three lines. However,
the effect is very strong for the weaker
4026 line.
Thus, we will explore the possibility of adding
4026 as a diagnostic line.
It is very important to note from Figure 4 the strong trade-off between density and underlying He I absorption. All six He I line strengths are increased by increasing the density, while all six He I line strengths are decreased by increasing the underlying He I absorption. While the relative effects vary from line to line, the main result is a basic trade-off between density and underlying absorption when both are included in a minimization routine. This means that adding underlying absorption as a free parameter in a minimization routine will open up a larger range of parameter space for good solutions. On the other hand, it means that if absorption is not included in minimizations, its effects may be masked by driving the solutions to lower He abundances or densities.
In principle, under the assumption of small values for the optical
depth (3889), it is possible to
use only the three bright lines
4471,
5876, and
6678 and still solve
self-consistently for He/H, density, and aHeI.
Of course, because these lines have relatively low sensitivities
to collisional enhancement, the derived uncertainties
in density will be large. However, as we will show, if there is some
reason to suspect a problem with any of the additional lines, the three
line method can actually lead to a more accurate result, and hence
should be used as a diagnostic if nothing else. Using a
minimization routine, as opposed to a direct solution, it is not
even necessary to assume that
(3889) = 0 in order to
derive a helium abundance from just three lines.
The detailed procedure we use to determine the physical parameters along with the He abundance is given in Appendix C. The procedure is actually independent of the number of lines used, though when using fewer lines (as in the present case of 3 lines) the results are likely to be less robust.
A self-consistent approach to determining the
4 He abundance was proposed by Izotov, Thuan, & Lipovetsky
(1994,
1997)
by considering the addition of other He lines. First the
addition of 7065 was
proposed as a density diagnostic
and then, 3889 was later
added to estimate the radiative
transfer effects (since these are important for
7065).
By minimizing the difference between
the ratios of 3889 /
4471,
5876 /
4471,
6678 /
4471, and
7065 /
4471 and their
recombination values, the density, optical depth, and helium
abundance can be determined. The latter is determined by a
weighted mean of the helium abundance based on
4471,
5876,
6678 once the values of
n and (3889)
are fixed. This is the method used by IT98
in their most recent estimate of Yp.
Underlying He I absorption is assumed to be negligible in their method.
While this method, in principle, represents an improvement
over helium determinations using a single emission line,
systematic effects become very important if the helium
abundances derived from either
3889 or
7065
deviate significantly from those derived from the other three
lines. In addition, working with the ratios of all of the
He I lines to a single He I line puts
undue weight on that single line (in this case
4471).
This is especially vulnerable to systematic errors in the
presence of undetected underlying stellar absorption.
Here, we also consider using these five lines for determining the He
abundance along with the physical parameters. However, as described in the
appendix B, our minimization procedure is
based on the weighted average of the He abundance as determined from the
five lines independently.
We allow for the presence of underlying He I absorption through the
assumption that it will be identical (in terms of equivalent width) for
all of the He I lines.
In addition, once the physical parameters have been determined by
the minimization, all five values of
y+() are
used in a weighted mean to determine the final Y+.
Adding 4026 as a
diagnostic line increases the leverage
on detecting underlying stellar absorption. This is because
the 4026 line is a
relatively weak line. However, this also
requires that the input spectrum is a very high quality one.
4026 is also provides
exceptional leverage to underlying
stellar absorption because it is a singlet line and therefore
has very low sensitivity to collisional enhancement (i.e., n)
and optical depth (i.e.,
(3889)) effects.
Our procedure for this case is identical to the one above with the
addition of the sixth line. By adding
4026 as a diagnostic
line, we increase our dependence on the assumption of equal equivalent
width of underlying absorption for all of the He I lines.
Our philosophy is that it is most important to discover underlying
absorption when it is present.
If underlying absorption is important in an individual spectrum,
conservatively, it may be better to reject the object from
consideration from studies constraining the primordial helium
abundance. If a solution implies significant underlying absorption, and all
of the helium lines give the same abundance within errors, it may
be taken as an endorsement of the assumption of equal EW of
underlying He I absorption.