Copyright © 1997 by Annual Reviews. All rights reserved
| Annu. Rev. Astron. Astrophys. 1997. 35:
389-443 Copyright © 1997 by Annual Reviews. All rights reserved |


4.3. Is Number Evolution Required?
Are simple number-conserving models adequate? Or are additional populations of star-forming sources required with no detectable local counterpart, as has been suggested in hypotheses based on a postulated population of fading dwarfs (Babul & Rees 1992, Cole et al 1992) or recent galaxy-galaxy mergers Rocca-Volmerange & Guiderdoni 1990? Although the upward revision in the normalization of the local LF and the possibility of a steeper faint end slope of blue sources (discussed in Section 4.1) reduces the no-evolution N(m, z) paradox originally introduced by Broadhurst et al (1988), even internally within the CFRS data (Lilly et al 1995) there are signs of strong evolution from z = 0.3 to 1, i.e. neglecting any reference to local data. Similar conclusions can be drawn from the internally presented LFs in the Ellis (1996a), Cowie et al (1996) samples, although, as these data comprise a number of individual surveys with slightly different photometric selection criteria, the conclusions are perhaps less compelling.
To understand the extent to which this evolution is number-conserving,
it is important to revisit the nature of the LF changes presented in
Figure 6 in the context of simple,
number-conserving, luminosity evolution. Whereas
Lilly et al (1995)
claim at most a 0.5-mag brightening in the luminosity scale of their redder
population over 0.3 < z < 0.6, they detect brightening of more than
1 mag in the luminosity scale for the bluer population in the same interval.
Further brightening is seen at high redshifts, particularly for less
luminous
sources. Because of the limited magnitude range sampled in the CFRS, the
luminosity overlap at various redshifts is relatively small, but, given the
homogeneity of the survey, the data by Lilly et al provide incontrovertible
evidence for evolution in the blue sources corresponding to a factor of
2-2.5 increase in the comoving rest-frame 4400-Å luminosity density
over 0.3 < z < 0.8, depending on
 (Lilly et al 1996).
Although the Autofib/LDSS redshift survey does not penetrate as deep as the CFRS, the large number (548) of fiber-based redshifts in the intermediate interval 19.7 < bJ < 22.0 (selected primarily from 4-m prime focus plates that are presumably unaffected by the photometric difficulties discussed in Section 4.1) is a valuable component of this survey. This enables the LF to be probed at all redshifts in a consistent manner to MbJ=-18 + 5 log h. By virtue of the blue selection, the overall LF is more affected by the evolutionary changes than in those selected in I and K. Ellis et al (1996a) reject an unchanging local LF as a fit to their data to z = 0.75 with very high significance. Furthermore, statistical tests reveal that the evolution begins strongly beyond z = 0.3 in the sense that there is a steeper faint end slope; no convincing shift is seen in L* for the overall population. As with the CFRS survey, the bulk of these changes occur in the star-forming component selected with strong [O II] emission. The luminosity decline or fading of the [O II]-strong population is roughly comparable to that seen for the blue galaxies in CFRS.
The question of whether the observed changes in the LF can be understood principally as a luminosity shift for some subset of the population [pure luminosity evolution (PLE) models] or whether more complex models are required (e.g. ones that violate number conservation) is difficult to determine from LF data alone because of the statistical nature of the observations. A galaxy may enter the [O II]-strong or blue class only temporarily and thus a variety of physical scenarios might be compatible with the trends observed. However, although there seems a natural reluctance among some workers to contemplate "exotic" interpretations of the data (Shanks 1990, Koo et al 1993, Metcalfe et al 1996), luminosity-independent evolution could be even harder to understand physically, particularly when extending such models to very high redshift.
The traditional PLE models date from Baade (1957) and were explored in detail by Tinsley (1972, 1980). They assume, for simplicity, that all galaxies of a certain class change their luminosities with redshift by the same amount in magnitudes irrespective of their luminosity. Although the LF would maintain the same shape at all redshifts, because different subclasses are allowed to evolve at different rates with different LF shapes, the integrated form may show evolution that is luminosity-dependent (as observed). In such models (e.g. Pozzetti et al 1996), evolutionary corrections are taken from synthesis codes that aim to reproduce the present-day SEDs via star-formation histories of a simple form (Bruzual 1983, Bruzual & Charlot 1993). An unavoidable corollary of those models that can successfully account for the present range of Hubble sequence colors is much stronger evolution for early-type galaxies than for the later types. According to Pozzetti et al, a significant proportion of the excess blue B = 25 population are distant young ellipticals with redshifts generally higher than the surveys indicate.
The PLE models represent a subset of an entire class of models whose evolutionary codes aim to satisfy the joint number-magnitude-color-redshift data sets. They can be considered as ab initio models (Section 2). Many fit the data to some degree but do not define a unique interpretation. An important conclusion from the LFs discussed in Section 3 is the qualitatively different pattern of evolution that is seen compared with that expected in the standard PLE models. Luminous early-type galaxies appear to evolve very little to z = 1, and the bulk of the bluing observed appears to occur by virtue of an increased proportion of star-forming L* galaxies, few of which have spheroidal forms.
Although number evolution cannot be verified to the limits
of the redshift surveys, the situation at fainter limits is much clearer.
Figure 8 updates a useful diagram originally
published by
Lilly et al (1991).
Adopting a local LF upwardly normalized with a steeper faint end slope
( = -1.3),
to take into account possible uncertainties discussed in
Section 4.1, the
calculations in the Figure show the maximum redshift to which a source that
is brighter than a given luminosity would have to be visible so as to
account for the integrated number of sources to B = 28, as defined using the
ground-based data of
Metcalfe et al (1996).
Because the majority of the faintest sources cannot lie at very high
redshifts by virtue of the absence of a Lyman limit
(Section 5), and it is unreasonable
to suppose low luminosity galaxies could shine continuously for a Hubble
time, strong number evolution seems unavoidable in order to account for the
integrated population beyond the break at B
= -1.3),
to take into account possible uncertainties discussed in
Section 4.1, the
calculations in the Figure show the maximum redshift to which a source that
is brighter than a given luminosity would have to be visible so as to
account for the integrated number of sources to B = 28, as defined using the
ground-based data of
Metcalfe et al (1996).
Because the majority of the faintest sources cannot lie at very high
redshifts by virtue of the absence of a Lyman limit
(Section 5), and it is unreasonable
to suppose low luminosity galaxies could shine continuously for a Hubble
time, strong number evolution seems unavoidable in order to account for the
integrated population beyond the break at B
 25.
25.
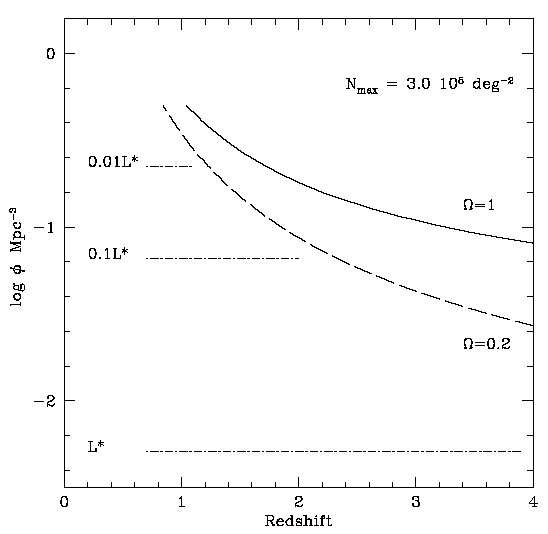 |
Figure 8. Evidence for number evolution in
the deepest counts. The
figure shows the redshift to which a population of galaxies brighter than
a given luminosity would have to be seen to account for the integrated
number of sources seen in ground-based images to B = 28
(Figure 5a). The calculation
adopts a high normalization
|