Copyright © 1999 by Annual Reviews. All rights reserved
| Annu. Rev. Astron. Astrophys. 1999. 37:
127-189 Copyright © 1999 by Annual Reviews. All rights reserved |


3.2. Mass Reconstruction from Weak Lensing
A powerful and complementary way to recover the mass distribution of lenses has been proposed by Kaiser & Squires (1993). It is based on the distribution of weakly lensed galaxies rather than the use of giant arcs. In 1988, Fort et al (1988) obtained at CFHT deep sub-arcsecond images of the lensing-cluster A370 and observed the first weakly distorted galaxies ever detected. The galaxy number density of their observation was about 30 arcmin-2, mostly composed of background sources, far beyond the cluster. These galaxies lensed by the cluster show a correlated distribution of ellipticity/orientation which maps the projected mass density. The first attempt to use this distribution of arclets as a probe of dark matter was made by Tyson et al (1990), but the theoretical ground and a rigorous inversion technique was first proposed by Kaiser & Squires.
By combining Equations 2, 4, and 5, one can express the complex shear as
a function of the convergence,
 (see
Seitz & Schneider
1996 and references therein):
(see
Seitz & Schneider
1996 and references therein):
 |
(16) |
where
 |
(17) |
This equation can be inverted in order to express the projected mass
density, or equivalently ,
as function of the shear:
![\begin{equation}
\kappa(\thetag)= {1 \over \pi} \int \Re[\mathcal{D}^*(\thetag-\thetag')
\gammag(\thetag')] \ d^2\theta' \ + \kappa_0 \ ,
\end{equation}](Equations/paper18x.gif) |
(18) |
where  denotes the real
part. From Equation 14 we can express the shear as a function of the complex
ellipticity. Hence, if the background ellipticity distribution is randomly
distributed, then
<|
denotes the real
part. From Equation 14 we can express the shear as a function of the complex
ellipticity. Hence, if the background ellipticity distribution is randomly
distributed, then
<| S|> = 0 and
 |
(19) |
(Schramm & Kayser
1995). In the most extreme
case, when << 1
(the linear regime discussed initially by
Kaiser & Squires
1993),
< |I| >
 |
| |, and
therefore, the
projected mass density can be recovered directly from the measurement of
the ellipticities of the lensed galaxies.
|, and
therefore, the
projected mass density can be recovered directly from the measurement of
the ellipticities of the lensed galaxies.
The first cluster mass reconstructions using the Kaiser & Squires
linear inversion have been done by
Smail (1993),
Fahlman et al (1994).
Fahlman et al estimated
the total mass within a circular radius using the Aperture
densitometry technique (or the
" -statistics"),
which consists of computing the difference between the
mean projected mass densities within a radius r1 and
within an annulus (r2 - r1)
(Fahlman et al 1994,
Kaiser 1995) as
function of the tangential shear,
-statistics"),
which consists of computing the difference between the
mean projected mass densities within a radius r1 and
within an annulus (r2 - r1)
(Fahlman et al 1994,
Kaiser 1995) as
function of the tangential shear,
 t
= 1 cos(2
t
= 1 cos(2  ) +
2
sin(2) see
Equation 14), averaged in the ring:
) +
2
sin(2) see
Equation 14), averaged in the ring:
 |
(20) |
This quite robust mass estimator minimizes the contamination by foreground
and cluster galaxies and permits a simple check that the signal is produced
by shear, simply by changing
1
in 2 and
2
in -1 which should cancel out the true shear signal.
The mass maps inferred from their images coincide with the light
distribution from the galaxies. But, the impressive M/L found in the
lensing
cluster MS1224+20 by Fahlman et al (see Table 1)
led to a surprisingly high value of
 (close to 2!). This
result
is somewhat questionable and is probably due to the various sources of
errors, possibly in the correction of PSF anisotropy (see
Section 3.3). Furthermore, the
two-dimensional mass reconstructions presented in the earliest
papers looked noisy, probably because of boundary effects from the
intrinsically non-local reconstruction, the geometry of the finite-size
charge coupled device (CCD), and the reconstruction algorithm that can
have terrible effects on the inversion. These problems have been
discussed in several papers
(Schneider & Seitz
1995,
Seitz & Schneider
1995a,
Schneider 1995,
Seitz & Schneider
1996). In particular,
Kaiser (1995),
Seitz & Schneider
(1996) generalized the inversion to
the non-linear regime, by solving the integral equation obtained from
Equation 18 by replacing
by
(1 - )g, or
similarly by using the fact that both
and
depend
on second derivatives of the projected gravitational potential
(close to 2!). This
result
is somewhat questionable and is probably due to the various sources of
errors, possibly in the correction of PSF anisotropy (see
Section 3.3). Furthermore, the
two-dimensional mass reconstructions presented in the earliest
papers looked noisy, probably because of boundary effects from the
intrinsically non-local reconstruction, the geometry of the finite-size
charge coupled device (CCD), and the reconstruction algorithm that can
have terrible effects on the inversion. These problems have been
discussed in several papers
(Schneider & Seitz
1995,
Seitz & Schneider
1995a,
Schneider 1995,
Seitz & Schneider
1996). In particular,
Kaiser (1995),
Seitz & Schneider
(1996) generalized the inversion to
the non-linear regime, by solving the integral equation obtained from
Equation 18 by replacing
by
(1 - )g, or
similarly by using the fact that both
and
depend
on second derivatives of the projected gravitational potential
 (Kaiser 1995) which
permits one to recover the mass density by this alternative relation:
(Kaiser 1995) which
permits one to recover the mass density by this alternative relation:
 |
(21) |
Both Equations 18 and 21 express the same relation between
and
and
can be used to reconstruct the
projected mass density. The improvements that have been proposed and
discussed in detail by
Seitz & Schneider
(1995a),
Kaiser (1995),
Schneider (1995),
Bartelmann (1995c),
Squires & Kaiser
(1996),
Seitz & Schneider
(1996,
1997),
Lombardi & Bertin
(1998a,
b)
lead to reliable mass reconstructions from lensing
inversion, and comparison with simulated clusters proves that it can now
be considered a robust technique (see Figure 4,
in particular the comparision between Figure 4a,
Figures 4g and 4h).
However, the recovered mass distribution is not unique
because the addition
of a lens plane with constant mass density will not change the
distortion of
the galaxies (see Equation 18). Furthermore, the inversion only uses the
ellipticity of the galaxies without regard to their dimension, so that
changing (1 - ) in
 (1 -
) and
in
keeps
g invariant. This so-called mass sheet degeneracy
initially reported by
Gorenstein et al
(1988),
has been pointed out by
Schneider & Seitz
(1995) as a fundamental limitation of the lensing inversion.
(1 -
) and
in
keeps
g invariant. This so-called mass sheet degeneracy
initially reported by
Gorenstein et al
(1988),
has been pointed out by
Schneider & Seitz
(1995) as a fundamental limitation of the lensing inversion.
| Cluster | z |  obs obs (km s-1) |
wl (km s-1) |
M/L (h100) |
Scale (h100-1 Mpc) |
Tel. | Ref. |
|---|---|---|---|---|---|---|---|
| A2218 | 0.17 | 1370 | - | 310 | 0.1 | HST | Smail et al (1997) |
| A1689 | 0.18 | 2400 | 1200-1500 | - | 0.5 | CTIO | Tyson et al (1990) |
| - | 400 | 1.0 | CTIO | Tyson & Fischer (1995) | |||
| A2163 | 0.20 | 1680 | 740-1000 | 300 | 0.5 | CFHT | Squires et al (1997) |
| A2390 | 0.23 | 1090 |
1000 |
320 | 0.5 | CFHT | Squires et al (1996b) |
| Cl1455+22 | 0.26 |
700 |
- | 1080 | 0.4 | WHT | Smail et al (1995) |
| AC118 | 0.31 | 1950 | - | 370 | 0.15 | HST | Smail et al (1997) |
| Cl1358+62 | 0.33 | 910 | 780 | 180 | 0.75 | HST | Hoekstra et al (1998) |
| MS1224+20 | 0.33 | 770 | - |
800 |
1.0 | CFHT | Fahlman et al (1994) |
| Q0957+56 | 0.36 | 715 | - | - | 0.5 | CFHT | Fischer et al (1997) |
| Cl0024+17 | 0.39 | 1250 | - | 150 | 0.15 | HST | Smail et al (1997) |
| 1300 |
900 |
1.5 | CFHT | Bonnet et al (1994) | |||
| Cl0939+47 | 0.41 | 1080 | - | 120 | 0.2 | HST | Smail et al (1997) |
| - |
250 |
0.2 | HST | Seitz et al (1996) | |||
| Cl0302+17 | 0.42 | 1080 | 80 | 0.2 | HST | Smail et al (1997) | |
| RXJ1347-11 | 0.45 | - | 1500 | 400 | 1.0 | CTIO | Fischer & Tyson (1997) |
| 3C295 | 0.46 | 1670 | 1100-1500 | - | 0.5 | CFHT | Tyson et al (1990) |
| - | 330 | 0.2 | HST | Smail et al (1997) | |||
| Cl0412-65 | 0.51 | - | - | 70 | 0.2 | HST | Smail et al (1997) |
| Cl1601+43 | 0.54 | 1170 | - | 190 | 0.2 | HST | Smail et al (1997) |
| Cl0016+16 | 0.55 | 1700 | - | 180 | 0.2 | HST | Smail et al (1997) |
| 740 | 740 | 0.6 | WHT | Smail et al (1993) | |||
| Cl0054-27 | 0.56 | - | - | 400 | 0.2 | HST | Smail et al (1997) |
| MS1137+60 | 0.78 | 8591 | - | 270 | 0.5 | Keck | Clowe et al (1998) |
| RXJ1716+67 | 0.81 | 15222 | - | 190 | 0.5 | Keck | Clowe et al (1998) |
| MS1054-03 | 0.83 | 13603 | 1100-2200 | 350-1600 | 0.5 | UH2.2 | Luppino & Kaiser (1997) |
| 1Gioia, private communication. | |||||||
| 2Gioia et al (1998). | |||||||
| 3Donahue et al (1998). | |||||||
 |
Figure 4. Examples of different algorithms for the mass reconstruction of clusters. Image A (top left) is the original simulated lensing cluster. Panel B shows an original Kaiser & Squires (1993) mass reconstruction, assuming that all background sources are circular. Panel C shows the same reconstruction as panel B, but with another smoothing method, which was proposed by Seitz & Schneider (1995a), in order to smooth the distortion distribution. Panel D shows the same result but the sources have an ellipticity distribution. Panel E shows the same reconstruction as panel D, but uses an adaptive smoothing scale. In panel F the linear and non-linear weak lensing regimes are now used in the inversion. Panel G shows the same reconstruction algorithm as F, with an additional extrapolation of the distortion field outside the field. The last panel shows the mass reconstruction with the constraint that the minimal mass density at any point is zero (from Seitz & Schneider 1995a). |
The degeneracy could in principle be broken if the magnification can be
measured independently, because it is not invariant under the linear
transformation mentioned above, but instead it is reduced by a factor
of 1 / 2.
Broadhurst et al (1995)
proposed measuring the magnification directly by using the magnification
bias which changes the galaxy number-counts (see
Section 3.4), whereas
Bartelmann & Narayan
(1995) explored their lens parallax method
which compares the angular sizes of lensed galaxies with an unlensed
sample. The lens-parallax method requires a sample of unlensed population
having the same surface brightness distribution. However, in the case
of ground-based observations, for the
faintest (i.e. smallest galaxies), the convolution of the signal by
the seeing disk can significantly affect the measurement of their surface
brightness. Therefore, the method requires a careful handling of
small-sized objects. A more promising approach is the use of
wide field cameras with a typical field of view much larger than clusters
of galaxies. In that case
should vanish at the
boundaries of the field, so that the degeneracy could in principle be
broken.
An attractive alternative has been suggested by
Bartelmann et al (1996)
who proposed a maximum likelihood reconstruction algorithm. The
advantage is that this is a local approach because it
fits the projected potential at each grid-point. The observables are
constrained by the second-derivatives of the potential, using a
least- 2 which
simultaneously computes both the magnification
and the distortion, which are compared to the ellipticity and the sizes of
the galaxies.
Squires & Kaiser
(1996),
Bridle et al (1998)
have investigated similar
maximum-likelihood techniques with different regularizations, though
they fit the projected mass density rather than the potential. It seems
however more attractive to use
the deflection potential rather than the projected mass distribution
in order to avoid incomplete knowledge of the contribution to the projected
mass density of the matter outside the observed area
(Seitz et al 1998).
2 which
simultaneously computes both the magnification
and the distortion, which are compared to the ellipticity and the sizes of
the galaxies.
Squires & Kaiser
(1996),
Bridle et al (1998)
have investigated similar
maximum-likelihood techniques with different regularizations, though
they fit the projected mass density rather than the potential. It seems
however more attractive to use
the deflection potential rather than the projected mass distribution
in order to avoid incomplete knowledge of the contribution to the projected
mass density of the matter outside the observed area
(Seitz et al 1998).
The comparison done by Squires & Kaiser (1996) between the direct reconstructions, like the Kaiser & Squires (1993) approach, and the inversion methods, like the maximum likelihood reconstructions, did not lead to conclusive results, though the maximum likelihood inversion looks somewhat better. It is worth pointing out that one of the advantages of the maximum likelihood inversion is that it eases the addition of some observational constraints, such as strong lensing features (Bartelmann et al 1996; Seitz et al 1998). More recently, Seitz et al (1998) proposed an improved entropy-regularized maximum-likelihood inversion in which they no longer smooth the data, but instead use the ellipticity of each individual galaxy.
Since 1990, many clusters have been investigated using the weak lensing inversion, using either ground-based or HST data that are summarized in Table 1, but the comparison of these results is not straightforward because of the different observing conditions which produced each set of data and the different mass reconstruction algorithms used by each author. Nevertheless, all these studies show that on scales of about 1 Mpc, the geometry of mass distributions, the X-ray distribution and the galaxy distribution are similar (see Figure 5), although the ratio of each component compared with the others may vary with radius. The inferred M/L ratio lies between 100h100 to 1600h100, with a median value of approximately 300h100, with a trend to increase with radius. Contrary to the strong lensing cases, there is no evidence of discrepancies between the X-ray mass and the weak lensing mass. It is worth noting that the strong-lensing mass and the weak-lensing mass estimates are consistent in the region where the amplitudes of two regimes are very close. This is an indication that the description of the X-ray gas, and its coupling with the dark matter on the scales corresponding to strong-lensing studies, is oversimplified, whereas on larger scales, described by weak-lensing analysis, the detailed description of the gas has no strong impact.
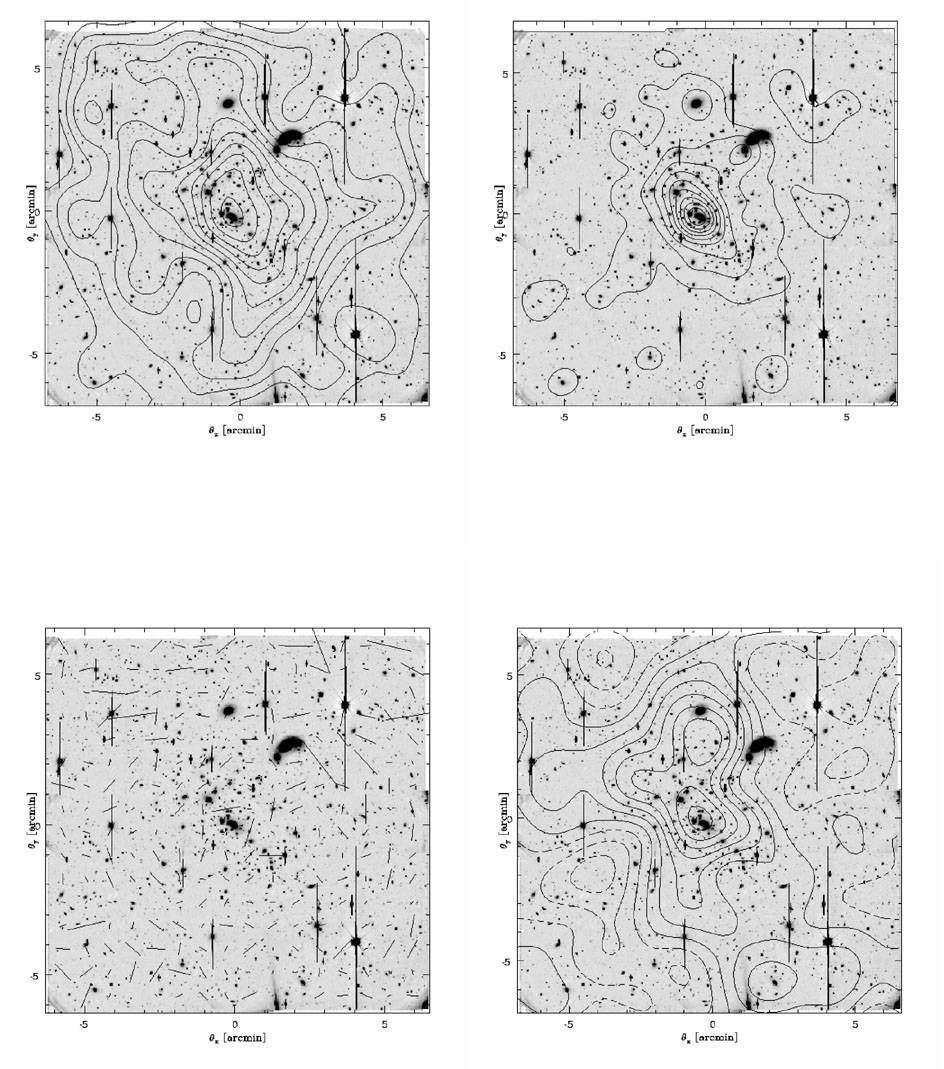 |
Figure 5. Weak lensing analysis and mass reconstruction of A2218 (from Squires et al 1996a). The images have been obtained at CFHT in I-band. The top-left panel shows the smoothed galaxy number density and the top-right shows the smoothed light distribution. The bottom-left is the shear map. The length of each line is proportional to the amplitude of the shear. From this shear map, the mass reconstruction of the Kaiser & Squires (1993) algorithm produces the mass map on the bottom-right. The correlation between the light and the matter distribution is clear. |
The large range of M/L could partly be a result of one of the issues of the mass reconstruction from weak lensing. As shown in Equation 1, the deviation angle depends on the ratios of the three angular-diameter distances, which vary with the redshift assumed for the sources. For low-z lenses, the dependence with redshift of the background galaxies is not considerable, so the calibration of the mass can be provided with a reasonable confidence level. However, distant clusters are highly sensitive to the redshift of the sources, and it becomes very difficult to scale the total mass without this information, even though the shape of the projected mass density is reconstructed correctly. The case of high-redshift clusters is more complicated. For a low-z cluster (say z < 0.4), it is not necessary to go extremely deep since the background galaxies are between z = 0.4 to 1. Thus, spectroscopic surveys can provide the redshift distribution with a good accuracy. In contrast, the background sources lensed by high-z clusters are beyond z = 1 and therefore are dominated by very faint galaxies (I > 22.5) which cannot be observed easily by spectroscopy.
The masses inferred from the strong lensing and weak lensing
reconstruction put valuable constraints on the median M/L of lensing
clusters. From the investigation of about 20 clusters, the median M/L is
lower than 400h100. This
implies that weak lensing analyses predict
< 0.3 with a high
significance level. Even if the uncertainties are large and if the weak
lensing inversion needs to be improved, the HST data, in particular for
clusters with giant arcs and many arc(let)s with known redshift, imply
that the mass of
clusters of galaxies cannot be reconciled with an Einstein-de Sitter (EdS)
universe. The constraints on
are in good
agreement with other observations (see the recent discussion by
Krauss 1998).
Another strong statement results from the mass reconstruction obtained
by Luppino & Kaiser
(1997),
Clowe et al (1998)
or the detection of giant arcs in very distant clusters
(Deltorn et al 1997):
massive clusters do exist at
redshift 1! Though
the total mass and the M/L cannot be given
with a high accuracy, it cannot change the conclusion, unless unknown
important systematics have been neglected. Therefore, we now have the
first direct
observational evidences that high mass-density peaks have generated massive
clusters of galaxies at redshift 1. These results are extremely promising
and are corroborated by other weak lensing studies around radiosources
and quasars (see Section 4.2). Indeed,
because these studies question the standard Cold Dark Matter can
certainly expect fantastic developments from
the investigation of high-redshift clusters with weak lensing during
the coming years.
The impressive and spectacular results obtained by weak-lensing
have demonstrated the power of this technique. However, although the
results seem reliable in the cluster center (say within 500 kpc),
there are still uncertainties outward, where the shear becomes very
small. A critical issue of the lensing inversion is the reliability of the
mass reconstruction and how it degrades when the shear decreases.
Kaiser (1995)
emphasized that Equation 20
can be used as a check of the mass reconstruction since the curl of
 log(1 -
) should be zero only if
the shear is recovered properly.
Van Waerbeke (1999)
has recently proposed an elegant way to estimate the accuracy of the
mass reconstruction from the noise properties of the
reconstruction. Nevertheless, the comparison of results using different
algorithms and the stability
and the reproducibility of each inversion have still to be done in order
to demonstrate
that weak lensing analysis produces reliable results. This is important for
the future, when ground-based observations of very large fields will be
performed.
Mellier et al (1997)
have compared the
shear maps obtained in A1942 by using the Bonnet-Mellier and the
autocorrelation function (ACF) methods (see next section). Though the
two maps are similar, discrepancies are visible at the periphery, but no
quantitative estimates of the similarity of both maps are given. An
important step was taken by Van Waerbeke et al (in preparation) who
analyzed
A1942 using different shear measurements, different
mass reconstruction
algorithms and different data, obtained with two CCD cameras mounted at
CFHT. Three sets of data have been used, all of them having a total
exposure time of 4 hours and a seeing of 0.7". The results show
impressive similarities even in the details of the mass reconstruction,
down to a shear amplitude of 2%. This is the first work that
demonstrates that results are stable and are not produced by artifacts,
even at a very low shear amplitude. The main concerns are the
capabilities of instruments, and
the image analysis algorithms to measure very weak shear. This critical
issue deserves a detailed discussion, which is the subject of the next
section.
log(1 -
) should be zero only if
the shear is recovered properly.
Van Waerbeke (1999)
has recently proposed an elegant way to estimate the accuracy of the
mass reconstruction from the noise properties of the
reconstruction. Nevertheless, the comparison of results using different
algorithms and the stability
and the reproducibility of each inversion have still to be done in order
to demonstrate
that weak lensing analysis produces reliable results. This is important for
the future, when ground-based observations of very large fields will be
performed.
Mellier et al (1997)
have compared the
shear maps obtained in A1942 by using the Bonnet-Mellier and the
autocorrelation function (ACF) methods (see next section). Though the
two maps are similar, discrepancies are visible at the periphery, but no
quantitative estimates of the similarity of both maps are given. An
important step was taken by Van Waerbeke et al (in preparation) who
analyzed
A1942 using different shear measurements, different
mass reconstruction
algorithms and different data, obtained with two CCD cameras mounted at
CFHT. Three sets of data have been used, all of them having a total
exposure time of 4 hours and a seeing of 0.7". The results show
impressive similarities even in the details of the mass reconstruction,
down to a shear amplitude of 2%. This is the first work that
demonstrates that results are stable and are not produced by artifacts,
even at a very low shear amplitude. The main concerns are the
capabilities of instruments, and
the image analysis algorithms to measure very weak shear. This critical
issue deserves a detailed discussion, which is the subject of the next
section.