


B.9.1. The Interstellar Medium of Lens Galaxies
As well as studying the emission by the lens galaxy we can study its absorption of emission from the quasar as a probe of the interstellar medium (ISM) of the lens galaxies. The most extensively studied effect of the ISM is dust extinction because of its effects on estimating the cosmological model from optically-selected lenses and because it allows unique measurements of extinction curves outside the local Group. There are also broad band effects on the radio continuum due to free-free absorption, scatter broadening and Faraday rotation. While all three effects have been observed, they have been of little practical importance so far. Finally, in both the radio and the optical, the lens can introduce narrow absorption features. While these are observed in some lenses, observational limitations have prevented them from being as useful as the are in other areas of astrophysics.
As we mentioned in Section B.6, extinction
is an important systematic
problem for estimating the cosmological model using the statistics of
optically selected lenses. It modifies the results by changing the effective
magnification bias of the sample because it can make
lensed quasars dimmer than their unlensed counterparts. Because we
see multiple images of the same quasar, it is relatively easy to estimate
the differential extinction between lensed images under the assumption
that the quasar spectral shapes are not varying on the time scale
corresponding to the time delay between the images and that microlensing
effects are not significantly changing the slope of the quasar continuum.
The former is almost certainly valid, while for the latter we simply lack
the necessary data to check the assumption (although we have a warning sign
from the systems where the continuum and emission line flux ratios
differ, see Part 4). Under these assumptions, the magnitude
difference at wavelength
 between two images A
and B
between two images A
and B
 |
(B.133) |
depends on the ratio of the image magnifications
µA / µB, the differential
extinction
 E(B -
V) = EA - EB between the two
images and the extinction law
R( / (1 +
zl)) of the dust in the rest frame of the dust. We
have the additional assumption that either the extinction law is the
same for both images or that one image dominates the total extinction
(Nadeau et al.
[1991]).
Because it is a purely differential measurement that does not depend on
knowing the intrinsic spectrum of the quasar, it provides a means of
determining extinctions and extinction laws that is otherwise only
achievable locally where we can obtain spectra of individual stars (the
pair method, e.g. Cardelli, Clayton & Mathis
[1989]).
The total extinction cannot
be determined to any comparable accuracy because estimates of the total
extinction require an estimate of the intrinsic spectrum of the quasar.
Fig. B.68 shows the distribution of
differential extinctions found in the Falco et al.
([1999])
survey of extinction in 23
gravitational lenses. Only 7 of the 23 systems had colors consistent with
no extinction, and after correcting for measurement errors and excluding the
two outlying, heavily extincted systems the data are consistent with a
one-sided Gaussian distribution of extinctions starting at 0 and
with a dispersion of
E(B -
V) = EA - EB between the two
images and the extinction law
R( / (1 +
zl)) of the dust in the rest frame of the dust. We
have the additional assumption that either the extinction law is the
same for both images or that one image dominates the total extinction
(Nadeau et al.
[1991]).
Because it is a purely differential measurement that does not depend on
knowing the intrinsic spectrum of the quasar, it provides a means of
determining extinctions and extinction laws that is otherwise only
achievable locally where we can obtain spectra of individual stars (the
pair method, e.g. Cardelli, Clayton & Mathis
[1989]).
The total extinction cannot
be determined to any comparable accuracy because estimates of the total
extinction require an estimate of the intrinsic spectrum of the quasar.
Fig. B.68 shows the distribution of
differential extinctions found in the Falco et al.
([1999])
survey of extinction in 23
gravitational lenses. Only 7 of the 23 systems had colors consistent with
no extinction, and after correcting for measurement errors and excluding the
two outlying, heavily extincted systems the data are consistent with a
one-sided Gaussian distribution of extinctions starting at 0 and
with a dispersion of
 E
E
 0.1 mag. The two
outlying systems, B0218+357 and PKS1830-211, were both radio-selected
and both have one image that lies behind a molecular cloud of a late
type lens galaxy (see below).
0.1 mag. The two
outlying systems, B0218+357 and PKS1830-211, were both radio-selected
and both have one image that lies behind a molecular cloud of a late
type lens galaxy (see below).
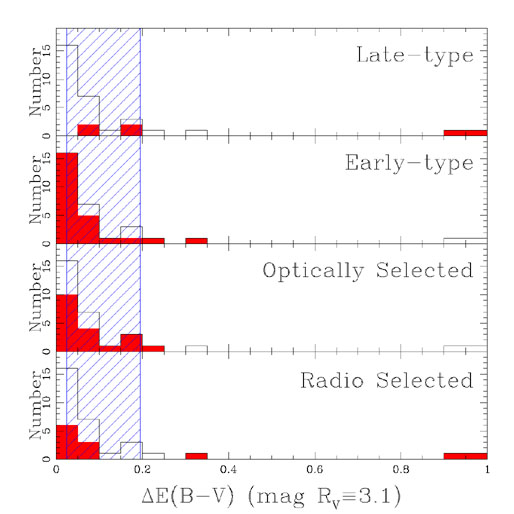 |
Figure B.68. Histograms of the differential extinction in various lens subsamples from Falco et al. ([1999]). In each panel the solid histogram shows the full sample of 37 differential extinctions measured in 23 lenses while the shaded histogram shows the distributions for different selection methods (radio/optical) or galaxy types (early/late). The hatched region shows the extinction range consistent with the Falco, Kochanek & Muñoz ([1998]) analysis of the difference between the statistics of radio-selected and optically-selected lens samples (see Section B.6.6). Note that the most highly extincted systems, PKS1830-211 and B0218+357, are both radio-selected and late-type galaxies. The lowest differential extinction bins are contaminated by the effects of finite measurement errors. |
For lenses that have the right amount of dust, so that the image flux ratio
can be measured accurately over a broad range of wavelengths, it is
possible to estimate the extinction curve
R( / (1 +
zl)) of the dust (Nadeau et al.
[1991])
or to estimate the dust redshift under the assumption that the
extinction curve is similar to those measured locally (Jean & Surdej
[1998]).
Starting with Nadeau et al.
([1991]),
there have been many estimates
of extinction curves in lens galaxies (Falco et al.
[1999],
Toft, Hjorth & Burud
[2000],
Motta et al.
[2002],
Muñoz et al.
[2004]).
The most interesting of these are
for systems where the region near the 2175Å extinction feature is
visible. This requires source and lens redshifts that put the feature
at long enough wavelengths to be easily observed (i.e. higher lens
redshifts) with a quasar UV continuum extending to shorter wavelengths
(i.e. lower source redshifts). Motta et al.
([2002])
achieved the first cosmological detection of the feature in the
zl = 0.83 lens SBS0909+532, as shown in
Fig. B.69. The
overall extinction curve is marginally consistent with a standard
Galactic RV = 3.1 extinction curve. Other cosmologically distant
extinction curves are very different from normal Galactic models
ranging for an anomalously low RV curve in MG0414+0534
at zl = 0.96 (Falco et al.
[1999]),
probably an SMC extinction curve in LBQS1009-252 at an estimated
redshift of zl
0.88 (Muñoz et al.
[2004]),
and a anomalously high RV extinction curve for the
dust in the molecular cloud of the
zl = 0.68 lens galaxy in B0218+357. The Jean & Surdej
([1998])
idea of using the shape of the extinction curve to estimate the redshift
of the dust also seems to work given a reasonable amount of dust and
wavelength coverage (see Falco et al.
[1999],
Muñoz et al.
[2004]),
but too few lenses with unknown redshifts
satisfy the requirements for widespread use of the method.
 |
Figure B.69. The extinction curve of the dust in SBS0909+532 at zl = 0.83 by Motta et al. ([2002]). The solid squares show the magnitude difference as a function of inverse rest wavelength derived from integral field spectra of the continuum of the quasars. The open squares are broad band measurements from earlier HST imaging and the filled triangles are the flux ratios in the quasar emission lines. The solid curve shows the best fit RV = 2.1 ± 0.9 Cardelli, Clayton & Mathis ([1989]) extinction curve while the dashed curve shows a standard RV = 3.1 curve. The offset between the continuum and emission line flux ratios seems not to depend on wavelength and is probably due to microlensing. |
For broad band radio emission from the source, the three observed propagation effects are free-free absorption, scatter broadening and Faraday rotation. For example, in PMNJ1632-0033, the candidate third image of the lens (C) has the same radio spectrum as the other two images except at the lowest frequency observed (1.4 GHz) where it is fainter than expected. This can be interpreted as free-free absorption by electrons at the center of the lens galaxy but the interpretation needs to be confirmed by measurements at additional frequencies to demonstrate that the dependence of the optical depth on wavelength is consistent with the free-free process (Winn, Rusin & Kochanek [2004]). Scatter broadening is observed in many radio lenses (e.g. PMN0134-0931, Winn et al. [2003]; B0128+437, Biggs et al. [2004]; PKS1830-211, Jones et al. [1996]; B1933+503, Marlow et al. [1999]) primarily as changes in the fluxes of images between high resolution VLBI observations and lower resolution VLA observations or apparently finite sizes for compact source components in VLBI observations. In the presence of a magnetic field, the scattering medium will also rotate polarization vectors (e.g. MG1131+0456, Chen & Hewitt [1993]). This is only of practical importance if maps which depend on the polarization vector are used to constrain the lens potential. In short, these effects are observed but have so far been of little practical consequence.
More surprisingly, absorption by atoms and molecules has also been of little practical import for lens physics as yet. Wiklind & Alloin ([2002]) provide an extensive review of molecular absorption and emission in gravitational lenses. The two systems with the strongest absorption systems are B0218+357 and PKS1830-211 (see Gerin et al. [1997] and references therein) where one of the two images lies behind a molecular cloud of the spiral galaxy lens. These two systems also show the highest extinction of any lensed images (Falco et al. [1999]). Molecular absorption systems can be used to determine time delays (Wiklind & Alloin [2002]), measure the redshift of lens galaxies (the lens redshift in PKS1830-211 is measured using molecular absorption lines, Wiklind & Combes [1996]), and potentially to determine the rotation velocity of the lens galaxy (e.g. Koopmans & de Bruyn [2003]). These studies at centimeter and millimeter wavelengths are heavily limited by the resolution and sensitivity of existing instruments, and the importance of these radio absorption features will probably rise dramatically with the completion of the next generation of telescopes (e.g. ALMA, LOFAR, SKA).
Similar problems face studies of
metal absorption lines in the optical. Since most lenses are at modest
redshifts, the strongest absorption lines expected from the lens galaxies
tend to be observable only from space because they lie at shorter
wavelengths than the atmospheric cutoff. For most lenses only the MgII
(2800Å) lines are observable from the ground since you only require
a lens redshift zl
 0.26 to get the
redshifted absorption lines longwards of 3500Å.
The other standard metal line, CIV (1549Å), is only visible for
zl
1.25,
and we have no confirmed lens redshifts in this range. Spectroscopy with HST
can search for metal lines in the UV, but the integration times tend to be
prohibitively long unless the quasar images are very bright. Thus, while
absorption lines either associated with the lens galaxy or likely to be
associated with the lens galaxy are occasionally found (e.g. SDSS1650+4251,
Morgan, Snyder and Reens
[2003];
or HE1104-1805, Lidman et al.
[2000]),
there have been no systematic studies
of metal absorption in gravitational lenses. Nonetheless, some very bright
quasar lenses are favored targets for very high dispersion studies of they
Ly
0.26 to get the
redshifted absorption lines longwards of 3500Å.
The other standard metal line, CIV (1549Å), is only visible for
zl
1.25,
and we have no confirmed lens redshifts in this range. Spectroscopy with HST
can search for metal lines in the UV, but the integration times tend to be
prohibitively long unless the quasar images are very bright. Thus, while
absorption lines either associated with the lens galaxy or likely to be
associated with the lens galaxy are occasionally found (e.g. SDSS1650+4251,
Morgan, Snyder and Reens
[2003];
or HE1104-1805, Lidman et al.
[2000]),
there have been no systematic studies
of metal absorption in gravitational lenses. Nonetheless, some very bright
quasar lenses are favored targets for very high dispersion studies of they
Ly forest, particularly
the four-image lens B1422+231 and the three image lens APM08279+5255, because the lens magnification makes
these systems
anomalously bright for quasars at zs > 3.
forest, particularly
the four-image lens B1422+231 and the three image lens APM08279+5255, because the lens magnification makes
these systems
anomalously bright for quasars at zs > 3.