


A striking result of our rotation curve analysis is that most rotation curves decline slowly, if at all, and none of them reaches a Keplerian drop off in the outer parts. This raises the problem of the extent of a galaxy: does the mass continue to increase outwards or does it stop somewhere? A related question is: how is the mass distributed? If all the mass is in a disk its stability is in question. Ostriker and Peebles (1973) have proposed that a dynamically hot component may exist which stabilizes the disk; this component may be distributed in a halo. Such a massive halo might dominate the gravitational potential field in the outer parts of a galaxy. If these haloes exist then our mass models are clearly wrong, since they are based on the thin disk approximation. The curves of M(R), however, will change by at most 50% if we assume that all the mass is in a sphere (cf. Krumm and Salpeter, 1977). Ostriker, Peebles and Yahil (1974) have discussed the possibility that these haloes may be about ten times as massive as the disk and extend out to 0.3-0.5 Mpc. For spiral galaxies with such haloes the mass-to-luminosity ratio has to be in the order of 100. Various lines of argument seem to indicate that there is indeed a great amount of mass at large distances from the centre of galaxies. Most of the evidence comes from statistical studies i.e. binary galaxy statistics (Turner, 1976), the argument that the Local Group is stable (Kahn and Woltjer, 1959) and considerations about the orbits of satellite galaxies around our own Galaxy (e.g. Lin and Lynden-Bell, 1977).
Our results on masses of individual galaxies can now be compared with the other determinations of M(R). In Fig. 1 we present a plot of log M vs log R, similar to that of Turner and Ostriker (1977). We have used their values on the Local Group mass, and their results of the binary statistics, corrected to Ho = 75 km s-1 Mpc-1. We have also included the value derived by Van Albada and Freeman (1978) for the pure spiral pairs in Turner's sample (Turner, 1976). For our Galaxy we show our mass model in the inner parts, and data derived from the motions of satellites around our Galaxy (Globular Clusters: Hartwick and Sargent, 1978; Magellanic, Clouds: Lin and Lynden-Bell, 1977; Dwarf Ellipticals: Turner and Ostriker, 1977). For the galaxies NGC 2841, NGC 5055 and NGC 3198 we give log M(R) and for the other galaxies in our sample we have plotted log M(Ro), where Ro is the radius of the last measured point on the rotation curve.
 |
Figure 1. Masses (units 1012
M |
For each galaxy M is roughly proportional to R, but for different galaxies we find curves with a different zero point. This difference is proportional to V2 where V is a measure of the rotation speed of a galaxy. As a convenient measure of this speed we have calculated a surface density weighted mean velocity at R = Ro, that is Vm = (2Eo / Mo)1/2, with Eo is the value of the kinetic energy of rotation (chapter 6.3) at Ro. The value of Vm does not depend much on the choice of Ro: the curve of Vm(R) = (2E(R) / M(R))1/2 is roughly constant in the interval 1/2Ro to Ro. We use this quantity rather than the maximum rotational velocity, Vmax, because for most galaxies the rotation curve varies somewhat irregularly with radius, Vmax is then not a representative value. It is not so surprising that we find a scaling of the log M - log R curves with Vm2: in all the calculations of masses the basic assumption is the balance of forces between the gravitational force and the centrifugal force: GM / R2 ~ V2 / R; hence M ~ V2R. Therefore, if we have to compare the results of our models with those from statistical studies we have to know the value of Vm for the galaxies under consideration (cf. Burbidge, 1975). The galaxies in Fig. 1 have the following Vm values: NGC 2841 Vm = 273.0 km s-1; NGC 5055 Vm = 199.3 km s-1 and NGC 3198 Vm = 140.0 km s-1. The different zero points in Fig. 1 are consistent with these Vm values. For our Galaxy Vm = 232.5 km s-1, but this value is not well determined because of the uncertainties in the galactic rotation curve beyond the solar distance. The values of the mass of our Galaxy derived from the motions of the satellites are all compatible with the straight-line extrapolation from our model, except perhaps the values for globular clusters in case these have an isotropic velocity distribution (the upper square; the lower square is one for a radial velocity distribution). This may indicate that the Galaxy has a flat rotation curve or higher rotational velocities than we used. We will discuss the results from the binary galaxies in the next section, since these are based on M / L ratios.
It is difficult to determine the size of a galaxy, or to estimate where
the contribution of the outer shells of the mass distribution to the
rotation curve becomes negligible. In the determination of the mass
surface density,
 M(r),
the contributions of these
shells have been estimated with a rotation law which lies in between a
Keplerian curve and a flat curve beyond the radius of the
last measured point, Ro (see
chapter 6). This means that
Ro plays an essential role in the curves of
M(r),
and since Ro has been
determined from the 21-cm line data it is clear that the sensitivity of
the HI observations is essential too. In most cases Ro
refers to the radius where the column density of neutral hydrogen is
about 1020 atoms cm-2. In the galaxies with large
scale asymmetries we have excluded the asymmetric outer regions, and
Ro for these galaxies is
consequently smaller than it would have been if no asymmetry
was present. A more serious problem is the treatment of galaxies
which are thought to be warped. The warp problem is not understood,
but there is as yet no contradiction in the existence of massive
haloes around warped galaxies. Moreover, not only warped galaxies
have a more or less flat rotation curve in the outer parts, also a
few of the galaxies which are thought to have oval distortions in
the plane of the disk (see chapter 5) have
flat rotation curves.
M(r),
the contributions of these
shells have been estimated with a rotation law which lies in between a
Keplerian curve and a flat curve beyond the radius of the
last measured point, Ro (see
chapter 6). This means that
Ro plays an essential role in the curves of
M(r),
and since Ro has been
determined from the 21-cm line data it is clear that the sensitivity of
the HI observations is essential too. In most cases Ro
refers to the radius where the column density of neutral hydrogen is
about 1020 atoms cm-2. In the galaxies with large
scale asymmetries we have excluded the asymmetric outer regions, and
Ro for these galaxies is
consequently smaller than it would have been if no asymmetry
was present. A more serious problem is the treatment of galaxies
which are thought to be warped. The warp problem is not understood,
but there is as yet no contradiction in the existence of massive
haloes around warped galaxies. Moreover, not only warped galaxies
have a more or less flat rotation curve in the outer parts, also a
few of the galaxies which are thought to have oval distortions in
the plane of the disk (see chapter 5) have
flat rotation curves.
We have estimated the minimum amount of mass beyond Ro from the comparison of the results of our model fits with those of Nordsieck's inversion procedure (see chapter 6). In Fig. 2b we have plotted the ratio of Mo, the mass at R = Ro from Nordsieck's method, and Mf, the total mass in the model fits, as function of Vm. This ratio is about 0.5 for most of the galaxies, independent of Vm. Thus for most galaxies at least half of the mass resides outside the last measured point on the rotation curve. We will discuss the consequences of this result on the mass-to-luminosity ratio in the next section.
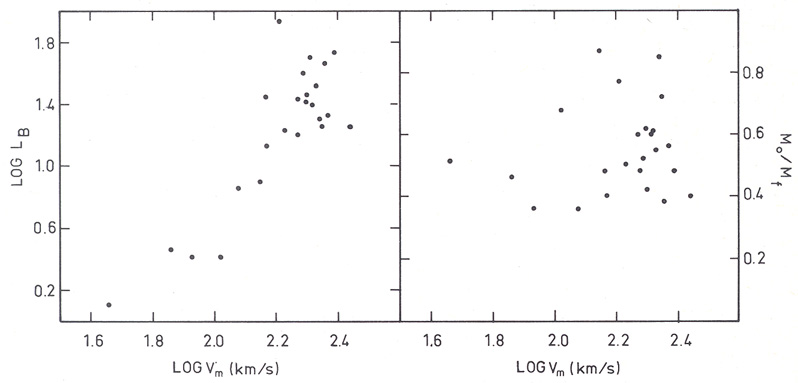 |
Figure 2. a Blue luminosity (units
109
L |
We have investigated a few correlations between
Vm, Ro and
other quantities. In Fig. 2a we have plotted the
blue luminosity
against Vm for the galaxies in our sample. We find a
correlation between these quantities. This correlation is similar to the
one found by
Tully and Fisher (1977)
between the width of the integral HI profile
and the luminosity. Another correlation is the one between
M(Ro) and Ro, as can be seen
in Fig. 1. In Fig. 3 we
have plotted a few variants of this correlation i.e. between
Vm and the radius where
M(R) =
50 M pc-2, and between Vm and
A3 where A3 is the
scale size of the Toomre disk in the model fits.
R( = 50) and
A3 have more physical significance than
Ro, but are still not free of selection
effects. The correlation between Vm and
R( = 50) is
fairly good except for M81, M51, M101 and NGC 4736. The correlation
between Vm and A3 is less impressive
but also here the points in the lower
right corner come from galaxies with high Vm and small
Ro. In Fig. 4
we present plots of the cumulative angular momentum at
Ro, Ho and of
cumulative kinetic energy of rotation at
Ro, Eo, both as function of
Mo. Here we find correlations with small intrinsic
scatter. These correlations can be explained in terms of the correlation
between Vm
and a scale size Rs: we find that
log R( = 50) =
0.64 log Vm + const. and log Mo
pc-2, and between Vm and
A3 where A3 is the
scale size of the Toomre disk in the model fits.
R( = 50) and
A3 have more physical significance than
Ro, but are still not free of selection
effects. The correlation between Vm and
R( = 50) is
fairly good except for M81, M51, M101 and NGC 4736. The correlation
between Vm and A3 is less impressive
but also here the points in the lower
right corner come from galaxies with high Vm and small
Ro. In Fig. 4
we present plots of the cumulative angular momentum at
Ro, Ho and of
cumulative kinetic energy of rotation at
Ro, Eo, both as function of
Mo. Here we find correlations with small intrinsic
scatter. These correlations can be explained in terms of the correlation
between Vm
and a scale size Rs: we find that
log R( = 50) =
0.64 log Vm + const. and log Mo
 log
Ro2.25; since
E ~ V4R, H ~ V3
R2 and
M ~ V2R we have
V ~ M0.28, Rs ~
M0.44, H ~ M1.72 and
E ~ M1.56. The question is
whether such correlations are relevant: if the scale size
Rs, be it
R( = 50) or
Ro, is determined in such a way that it
roughly correlates with Vm then the other correlations
follow. At present it is not
clear whether the correlation between Vm and
Rs is intrinsic or not.
Note, however, that the galaxies in our sample are in a certain
sense selected on their mean optical brightness (because they
appear in the Reference Catalogue of Bright Galaxies) and the
low-luminosity galaxy NGC 3109 does not follow the trend (cf.
Fig. 3b).
We will take up the size problem again in
sections 5 and 6,
but we point out here that it is very difficult to find a definition of
the size Rs which is satisfactory. For that reason we
have listed various size-definitions: Ro,
R( = 50), and the
optical size, R(), from
De Vaucouleurs et al. (1976)
in Table 1.
log
Ro2.25; since
E ~ V4R, H ~ V3
R2 and
M ~ V2R we have
V ~ M0.28, Rs ~
M0.44, H ~ M1.72 and
E ~ M1.56. The question is
whether such correlations are relevant: if the scale size
Rs, be it
R( = 50) or
Ro, is determined in such a way that it
roughly correlates with Vm then the other correlations
follow. At present it is not
clear whether the correlation between Vm and
Rs is intrinsic or not.
Note, however, that the galaxies in our sample are in a certain
sense selected on their mean optical brightness (because they
appear in the Reference Catalogue of Bright Galaxies) and the
low-luminosity galaxy NGC 3109 does not follow the trend (cf.
Fig. 3b).
We will take up the size problem again in
sections 5 and 6,
but we point out here that it is very difficult to find a definition of
the size Rs which is satisfactory. For that reason we
have listed various size-definitions: Ro,
R( = 50), and the
optical size, R(), from
De Vaucouleurs et al. (1976)
in Table 1.
 |
Figure 3. a Radius at which the surface density (from Nordsieck's method) is 50Mo pc-2 vs mean rotation velocity. b Scalelength of the fitted Toomre nT = 1 disk vs mean rotation velocity. |
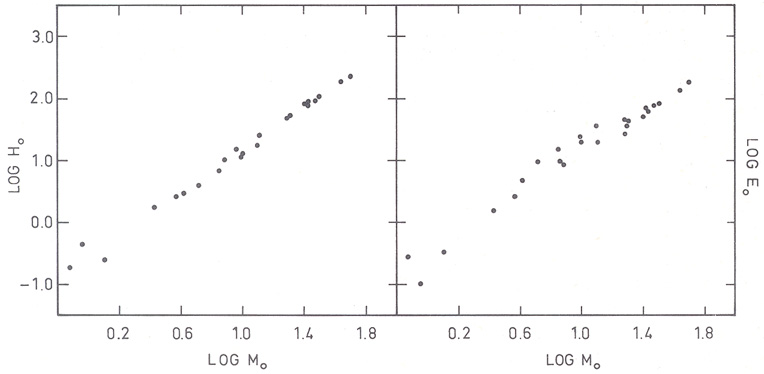 |
Figure 4. a Angular momentum
Ho (units 1013
M |
| Galaxy | LB† | (B - V)0 | M0 / LB | Mf / LB | M0 / Mf | R(0)† | R(
= 50)/R(0) |
Ro/R(0) |
| (109
L) |
kpc | |||||||
| N3718 | ||||||||
| M81 | 19.9 | 0.81 | 4.92 | 5.78 | 0.85 | 10.6 | 1.12 | 1.23 |
| N4151 | 13.2 | 0.67 | 5.76 | 12.1 | 0.48 | 11.0 | 1.10 | 1.78 |
| N4736 | 19.8 | 0,69 | 2.68 | 4.49 | 0.60 | 9.14 | 0.93 | 1.09 |
| M31 | 25.9 | 0.74 | 11.4 | 20.2 | 0.56 | 14.2 | 1.75 | 2.08 |
| N891 | 32.9 | 0.68 | 5.99 | 11.0 | 0.55 | 18.7 | 1.04 | 1.26 |
| N2841 | 17.7 | 0.73 | 28.1 | 70.1 | 0.40 | 8.85 | 3.63 | 4.08 |
| N4565 | 53.5 | 0.64 | 8.19 | 16.9 | 0.48 | 23.4 | 1.28 | 1.64 |
| N5383 | 28.0 | 0,57 | 7.36 | 17.7 | 0.42 | 15.4 | 1.16 | 1.74 |
| N4258 | 27.0 | 0.56 | 7.22 | 15.2 | 0.48 | 14.5 | 1.34 | 2.04 |
| N5055 | 25.5 | 0.64 | 9.92 | 15.9 | 0.62 | 12.8 | 1.36 | 3.21 |
| M51 | 49.8 | 0.52 | 1.43 | 2.37 | 0.60 | 14.1 | 0.62 | 0.84 |
| N7331 | 45.7 | 0.64 | 6.87 | 18.2 | 0.38 | 17.3 | 1.55 | 1.75 |
| N253 | ||||||||
| N3198 | 7.9 | 0.42 | 11.6 | 13.0 | 0.87 | 9.06 | 1.28 | 2.84 |
| N3359 | ||||||||
| N5033 | 24.7 | 0.44 | 10.9 | 17.9 | 0.61 | 18.6 | 1.21 | 1.92 |
| N5907 | 18.3 | 0.56 | 14.4 | 19.5 | 0.74 | 13.0 | 1.55 | 2.36 |
| N7640 | ||||||||
| N300 | ||||||||
| M33 | 2.6 | 0.44 | 2.88 | 8.08 | 0.36 | 5.76 | 0.76 | 0.94 |
| I342 | 17.1 | 7.54 | 15.2 | 0.50 | 10.4 | 1.56 | 2.19 | |
| N2403 | 7.5 | 0.37 | 4.93 | 13.6 | 0.36 | 7.49 | 1.25 | 1.56 |
| N4244 | 2.6 | 0.24 | 10.3 | 15.4 | 0.68 | 5.48 | 1.31 | 2.24 |
| M83 | 85.3 | 2.22 | 2.86 | 0.77 | 14.2 | 1.18 | 2.71 | |
| M101 | 50.4 | 0.40 | 1.96 | 3.79 | 0.52 | 28.2 | 0.45 | 0.48 |
| N6946 | ||||||||
| N2805 | ||||||||
| N4631 | 26.2 | 0.37 | 1.60 | 4.01 | 0.40 | 7.92 | 1.24 | 1.25 |
| N4236 | 2.9 | 0.25 | 4.48 | 9.66 | 0.46 | 6.99 | 0.67 | 1.67 |
| I2574 | ||||||||
| N3109 | 1.3 | 7.00 | 13.9 | 0.51 | 3.28 | - | 6.22 | |
| HoII | ||||||||
| N4449 | ||||||||
| Galaxy | - | |||||||
| From BTo and D(0) given by De Vaucouleurs et al. (1976) and the assumed distance. | ||||||||
| R0 is the radius of the last measured point on the rotation curve. | ||||||||
|
R( = 50) is the
radius where the mass surface density equals 50
M
pc-2. |
||||||||
 Hartwick and Sargent, cf.

