Copyright © 2002 by Annual Reviews. All rights reserved
| Annu. Rev. Astron. Astrophys. 2002. 40:
539-577 Copyright © 2002 by Annual Reviews. All rights reserved |


5.2. Deriving
 m from
cluster evolution
m from
cluster evolution
An estimate of the cluster mass function is reduced to the measurement of masses for a sample of clusters, stretching over a large redshift range, for which the survey volume is well known.
Velocity dispersions for statistical samples of galaxy clusters have
been provided by the ESO Nearby Abell Cluster Survey (ENACS;
Mazure et al. 2001)
and, more recently, by the 2dF survey
(de Propris et al. 2002).
Application of this method to a statistically complete
sample of distant X-ray selected clusters has been pursued by the CNOC
(Canadian Network for Observational Cosmology) collaboration (e.g.
Yee et al. 1996).
The CNOC sample includes 16 clusters from the EMSS in the redshift range
0.17  z
0.55. Approximately 100
redshifts of member galaxies were measured for each cluster, thus
allowing an accurate analysis of the internal cluster dynamics
(Carlberg et al. 1997b).
The CNOC sample has been used to constrain
m
through the M / Lopt method (e.g.
Carlberg et al. 1997b),
yielding m
z
0.55. Approximately 100
redshifts of member galaxies were measured for each cluster, thus
allowing an accurate analysis of the internal cluster dynamics
(Carlberg et al. 1997b).
The CNOC sample has been used to constrain
m
through the M / Lopt method (e.g.
Carlberg et al. 1997b),
yielding m
 0.2 ±
0.05. Attempts to estimate the
cluster mass function n( > M) using the cumulative velocity
dispersion distribution, n( >
0.2 ±
0.05. Attempts to estimate the
cluster mass function n( > M) using the cumulative velocity
dispersion distribution, n( >
 v), were made
(Carlberg et al. 1997b).
This method, however, provided only weak constraints on
m owing
to to the narrow redshift range and the limited number of
clusters in the CNOC sample
(Borgani et al. 1999,
Bahcall et al. 1997).
The extension of such methodology to a larger and more
distant cluster sample would be extremely demanding from the
observational point of view, which explains why it has not been
pursued thus far.
v), were made
(Carlberg et al. 1997b).
This method, however, provided only weak constraints on
m owing
to to the narrow redshift range and the limited number of
clusters in the CNOC sample
(Borgani et al. 1999,
Bahcall et al. 1997).
The extension of such methodology to a larger and more
distant cluster sample would be extremely demanding from the
observational point of view, which explains why it has not been
pursued thus far.
A conceptually similar, but observationally quite different method to
estimate cluster masses, is based on the measurement of the
temperature of the intra-cluster gas (see
Section 2). Based on the assumption that gas
and dark
matter particles share the same dynamics within the cluster potential
well, the temperature T and the velocity dispersion
v are
connected by the relation kBT =
 µ mp
v2,
where = 1
would correspond to the case of a perfectly thermalized
gas. If we assume spherical symmetry, hydrostatic equilibrium and
isothermality of the gas, the solution of Equation 5
provides the link between the total cluster virial mass,
Mvir, and the ICM temperature:
µ mp
v2,
where = 1
would correspond to the case of a perfectly thermalized
gas. If we assume spherical symmetry, hydrostatic equilibrium and
isothermality of the gas, the solution of Equation 5
provides the link between the total cluster virial mass,
Mvir, and the ICM temperature:
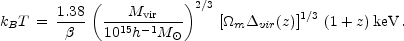 |
(13) |
 vir(z) is the ratio between the average
density within the
virial radius and the mean cosmic density at redshift z
(vir =
18
vir(z) is the ratio between the average
density within the
virial radius and the mean cosmic density at redshift z
(vir =
18 2
178 for
m = 1; see
Eke et al. 1996
for more general cosmologies). Equation 13 is
fairly consistent with hydrodynamical cluster simulations
with 0.9
2
178 for
m = 1; see
Eke et al. 1996
for more general cosmologies). Equation 13 is
fairly consistent with hydrodynamical cluster simulations
with 0.9  1.3 (e.g.
Bryan & Norman 1998,
Frenk et al. 2000;
see however Voit 2000).
Such simulations have also
demonstrated that cluster masses can be recovered from gas temperature
with a ~ 20% precision (e.g.
Evrard et al. 1996).
1.3 (e.g.
Bryan & Norman 1998,
Frenk et al. 2000;
see however Voit 2000).
Such simulations have also
demonstrated that cluster masses can be recovered from gas temperature
with a ~ 20% precision (e.g.
Evrard et al. 1996).
Observational data on the
Mvir-T relation show consistency
with the T  Mvir2/3 scaling law, at least for
T
Mvir2/3 scaling law, at least for
T  3 keV
clusters (e.g.
Allen et al. 2001),
but with a ~ 40% lower normalization. As for lower-temperature systems,
Finoguenov et al. (2001)
found some
evidence for a steeper slope. Such differences might be due to a lack
of physical processes in simulations. For example, energy
feedback from supernovae or AGNs and radiative cooling
(see Section 2, above) can modify the
thermodynamical state of the ICM and the resulting scaling relations.
3 keV
clusters (e.g.
Allen et al. 2001),
but with a ~ 40% lower normalization. As for lower-temperature systems,
Finoguenov et al. (2001)
found some
evidence for a steeper slope. Such differences might be due to a lack
of physical processes in simulations. For example, energy
feedback from supernovae or AGNs and radiative cooling
(see Section 2, above) can modify the
thermodynamical state of the ICM and the resulting scaling relations.
Measurements of cluster temperatures for flux-limited samples of
clusters were made using modified versions of the Piccinotti et
al. sample (e.g.
Henry & Arnaud 1991).
These results have been
subsequently refined and extended to larger samples with the advent of
ROSAT, Beppo-SAX and, especially, ASCA. With these
data one can derive the X-ray Temperature Function (XTF), which is
defined analogously to Equation 7. XTFs have been computed
for both nearby (e.g.
Markevitch 1998, see
Pierpaoli et al. 2001,
for a recent review) and distant (e.g.
Eke et al. 1998,
Donahue & Voit 1999,
Henry 2000)
clusters, and used to constrain cosmological
models. The mild evolution of the XTF has been interpreted as a case
for a low-density Universe, with
0.2
m
0.6
(see Figure 13). The starting point in the
computation of the XTF is inevitably a flux-limited sample for which
 (LX) can
be computed. Then the LX - TX
relation is used to derive a
temperature limit from the sample flux limit (e.g.
Eke et al. 1998).
A limitation of the XTFs presented so far is the limited sample size
(with only a few z
0.5
measurements), as well as the lack of
a homogeneous sample selection for local and distant clusters. By
combining samples with different selection criteria one runs the
risk of altering the inferred evolutionary pattern of the cluster
population. This can give results consistent even with a
critical-density Universe
(Colafrancesco et
al. 1997,
Viana & Liddle 1999,
Blanchard et al. 2000).
(LX) can
be computed. Then the LX - TX
relation is used to derive a
temperature limit from the sample flux limit (e.g.
Eke et al. 1998).
A limitation of the XTFs presented so far is the limited sample size
(with only a few z
0.5
measurements), as well as the lack of
a homogeneous sample selection for local and distant clusters. By
combining samples with different selection criteria one runs the
risk of altering the inferred evolutionary pattern of the cluster
population. This can give results consistent even with a
critical-density Universe
(Colafrancesco et
al. 1997,
Viana & Liddle 1999,
Blanchard et al. 2000).
 |
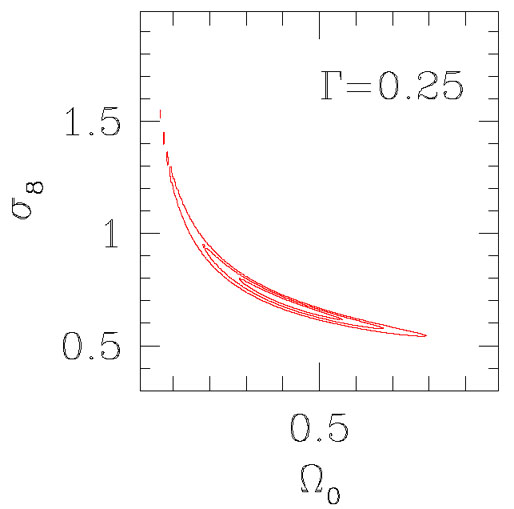 |
Figure 13. (Left) The
cumulative X-ray temperature function for the nearby cluster sample by
Henry & Arnaud
(1991)
and for a sample of moderately distant clusters (from
Henry 2000).
(Right) Probability contours in the
|
|
Another method to trace the evolution of the cluster number density
is based on the XLF. The advantage of using X-ray luminosity as a
tracer of the mass is that LX is measured for a much
larger number of clusters within samples well-defined selection
properties. As discussed in Section 3, the most
recent flux-limited cluster samples contain now a large (~ 100) number
of objects, which are homogeneously identified over a
broad redshift baseline, out to z
1.3. This allows nearby and
distant clusters to be compared within the same sample,
i.e. with a single selection function. The potential disadvantage of
this method is that it relies on the relation between
LX and
Mvir, which is based on additional physical
assumptions and hence is more uncertain than the Mvir
- v or the
Mvir-T relations.
A useful parameterization for the relation between temperature and bolometric luminosity is
 |
(14) |
with dL(z) the luminosity-distance at redshift
z for a given cosmology. Several independent analyses of nearby
clusters with TX
2 keV
consistently show that
L6 3 is
a stable result and  2.5-3 (e.g.
White et al. 1997,
Wu et al. 1999,
and references therein). For cooler groups,
1 keV, the
Lbol - TX relation steepens, with
a slope ~ 5 (e.g.
Helsdon & Ponman
2000).
2.5-3 (e.g.
White et al. 1997,
Wu et al. 1999,
and references therein). For cooler groups,
1 keV, the
Lbol - TX relation steepens, with
a slope ~ 5 (e.g.
Helsdon & Ponman
2000).
The redshift evolution of the LX - T relation
was first studied by
Mushotzky & Scharf
(1997)
who found that data out to
z 0.4
are consistent with no evolution for an Einstein-de-Sitter model
(i.e., A
0). This result was extended to higher redshifts
using cluster temperatures out to
z 0.8 as
measured with ASCA and Beppo-SAX data
(Donahue et al. 1999,
Della Ceca et al. 2000,
Henry 2000).
The lack of a significant evolution seems to
hold beyond z = 1 according to recent Chandra observations of
very distant clusters
(Borgani et. al. 2001b,
Stanford et al. 2001,
Holden et al. 2002),
as well as Newton-XMM observations in the Lockman Hole
(Hashimoto et al. 2002).
Figure 14 shows a summary of the
observational results on the LX - T. The high
redshift points generally lie around the local relation, thus
demonstrating that it is reasonable to assume
A 1
implying at most a mild positive
evolution of the Lbol - TX
relation. Besides the relevance for
the evolution of the mass-luminosity relation, these results also
have profound implications for the physics of the ICM (see
Section 2).
 |
Figure 14. The (bolometric)
luminosity-temperature relation for nearby
and distant clusters and groups compiled from several sources (see
Borgani et al. 2001b,
Holden et al. 2002).
The two dashed lines at T > 2 keV indicate the slope
|
Kitayama & Suto
(1997) and
Mathiesen & Evrard
(1998)
analyzed the
number counts from different X-ray flux-limited cluster surveys
(Figure 7) and found that
resulting constraints on
m are
rather sensitive to the evolution of the mass-luminosity relation.
Sadat et al. (1998) and
Reichart et al. (1999)
analyzed the EMSS and found results to be
consistent with
m = 1.
Borgani et al. (2001b)
analyzed the RDCS sample to quantify the systematics in the
determination of cosmological parameters induced by the uncertainty in
the mass-luminosity relation
(Borgani et al. 1998).
They found
0.1
m
0.6 at the
3 confidence
level, by allowing the M - LX relation to
change within both the observational and the theoretical uncertainties.
In Figure 15 we show the effect of changing in
different
ways the parameters defining the M - LX
relation, such as the
slope and the evolution
A of the LX - T relation (see
Equation 14), the normalization
of the
M-T relation (see Equation 13), and the overall scatter
M-LX. We assume flat geometry here, i.e.
m +
 =
1. In general, constraints of
cosmological models based on cluster abundance are not very sensitive
to
(see Figure 12). To a first
approximation, the best fit
m has a
slight dependence on
for
open geometry:
m
m,fl +
0.1(1 -
m,fl -
),
where
m,fl is
the best fit value for flat geometry.
=
1. In general, constraints of
cosmological models based on cluster abundance are not very sensitive
to
(see Figure 12). To a first
approximation, the best fit
m has a
slight dependence on
for
open geometry:
m
m,fl +
0.1(1 -
m,fl -
),
where
m,fl is
the best fit value for flat geometry.
Constraints on
m from
the evolution of the cluster
population, like those shown in Figures 13 and
15, are in line with the completely independent
constraints derived from the baryon fraction in clusters,
fbar, which can
be measured with X-ray observations. If the baryon density parameter,
bar, is
known from independent considerations (e.g. by
combining the observed deuterium abundance in high-redshift
absorption systems with predictions from primordial nucleosynthesis),
then the cosmic density parameter can be estimated as
m =
bar /
fbar (e.g.
White et al. 1993b).
For a value of the Hubble parameter
h 0.7, this
method yields fbar
0.15 (e.g.
Evrard 1997;
Ettori 2001).
Values of fbar in this range are consistent with
m = 0.3
for the currently most favored values of the baryon density parameter,
bar
0.02
h-2, as implied by primordial nucleosynthesis (e.g.
Burles & Tytler 1998)
and by the spectrum of CMB anisotropies (e.g.
de Bernardis et al. 2001,
Stompor et al. 2001,
Pryke et al. 2002).
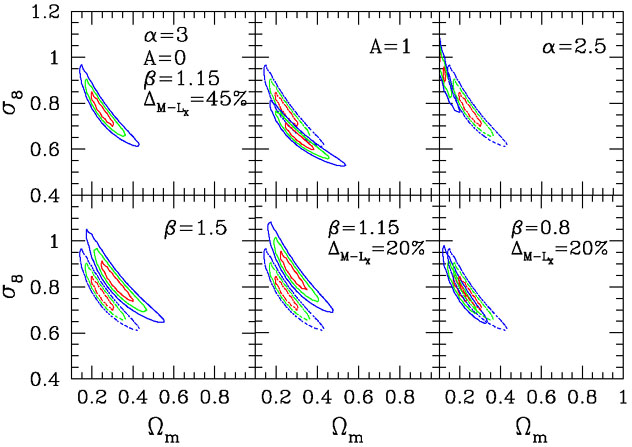 |
Figure 15. Probability contours in the
|
Figure 15 demonstrates that firm conclusions
about the value of the matter density parameter
m can be
drawn from
available samples of X-ray clusters. In keeping with most of the
analyses in the literature, based on independent methods, a critical
density model cannot be reconciled with data. Specifically,
m <
0.5 at 3 level even
within the full range of current uncertainties in the relation between
mass and X-ray luminosity.
A more delicate issue is whether one can use the evolution of galaxy
clusters for high-precision cosmology, e.g.,
10% accuracy.
Serendipitous searches of distant clusters from XMM and Chandra data
will eventually lead to a significant increase of the number of
high- z clusters with measured temperatures. Thus, the main
limitation will lie in systematics involved in comparing the mass
inferred from observations with that given by theoretical models. A
point of concern, for example, is that constraints on
8 from
different analyses of the cluster abundance differ by up to 30% from
each other. While a number of previous studies found
8
0.9-1 for
m = 0.3 (e.g.
Pierpaoli et al. 2001
and references therein), the most recent analyses point toward a low
power spectrum normalization,
8
0.7 for
m = 0.3
(Borgani et al. 2001b,
Reiprich &
Böhringer 2002,
Seljak 2002,
Viana et al. 2002).
A thorough discussion of the reasons for such differences would
require an extensive and fairly technical review of the analysis
methods applied so far. For instance, a delicate point concerns the
different recipes adopted for the mass-temperature and
mass-luminosity conversions. The M-T relation, usually
measured
at some fixed overdensity from observational data, seems to have a
lower normalization than that calibrated from hydrodynamical
simulations (e.g.
Finoguenov et al. 2001,
Allen et al. 2001,
Ettori et al. 2002).
In turn, this provides a lower amplitude for the mass function implied
by an observed XTF and, therefore, a smaller
8. Several
uncertainties also affect the LX - T
relation. The derived slope
depends on the temperature range over which the fit is performed. We
are also far from understanding the nature of its scatter, i.e. how
much it is due to systematics, and how much it is intrinsic, inherent
to complex physical conditions in the gas. For example, the
contribution of cooling flows is known to increase the scatter in the
LX - T relation (e.g.
Markevitch 1998,
Allen & Fabian 1998,
Arnaud & Evrard 1999).
Adding such a scatter in the mass-luminosity
conversion increases the amplitude of the mass-function, especially
in the high-mass tail, thus decreasing the required
8.
As an illustrative example, we show in Figure 15
how constraints in the
8-m plane move
as we change the scatter and the amplitude of the
M-LX relation in the analysis
of the RDCS. The upper left panel shows the result for the same choice
of parameters as in the original analysis by
Borgani et al. (2001b),
which gives
8
0.7 for
m =
0.3. The central lower
panel shows the effect of decreasing the scatter of the
M-LX relation by 20%, in keeping with the
analysis by Reiprich & Böhringer
(2002,
see also
Ettori et al. 2002).
Such a reduced scatter causes
8 to increase
by about 20%. Finally, if the
normalization of the M-T relation is decreased by ~ 30%
with respect to the value suggested by hydrodynamical cluster
simulations (lower right panel),
8 is again
decreased by ~ 20%.
In light of this discussion, a 10% precision in the determination of
fundamental cosmological parameters, such as
m and
8
lies in the future. With forthcoming datasets the challenge will be in
comparing observed clusters with the theoretical clusters predicted by
Press-Schechter-like analytical approaches or generated by numerical
simulations of cosmic structure formation.
 = 0.2. Different
panels refer to different ways of changing the
relation between cluster virial mass, M, and X-ray luminosity,
LX, within theoretical and observational uncertainties
(see also
= 0.2. Different
panels refer to different ways of changing the
relation between cluster virial mass, M, and X-ray luminosity,
LX, within theoretical and observational uncertainties
(see also