


6.1. Star-forming, normal and sub-mm galaxies
The radio emission of star-forming galaxies correlates with their star
formation rate, as demonstrated by the well-established tight
correlation with far-IR emission
(Helou
et al. 1985,
Gavazzi
et al. 1986,
Condon
1992,
Garrett
2002).
Yun et
al. (2001)
found that the overall trend in the range
L (60 µm)
 1030 - 1032.5 erg s-1 Hz-1
is indistinguishable from a linear relation:
1030 - 1032.5 erg s-1 Hz-1
is indistinguishable from a linear relation:
 |
(14) |
Galaxies with L(60 µm) <
1030 erg s-1 Hz-1 are
found to have radio to far-IR luminosity ratios systematically lower
than those given by eq. (14). The apparent
deviation from linearity in the radio/far-IR correlation at low
luminosities is supported by a comparison of 60 µm and 1.4 GHz
local luminosity functions
(Yun et
al. 2001,
Best et
al. 2005).
Simply shifting the 60 µm luminosity function
(Saunders et al. 1990,
Takeuchi
et al. 2003)
along the luminosity axis according to eq. (14) yields a good match to
the radio luminosity function
(Best et
al. 2005,
Mauch
& Sadler 2007)
for L1.4 GHz
 1028 erg s-1 Hz-1. At
yet lower luminosities, however, the extrapolated luminosity function
lies increasingly above the observed one. Full agreement is recovered
(Fig. 8) by replacing eq. (14) with
1028 erg s-1 Hz-1. At
yet lower luminosities, however, the extrapolated luminosity function
lies increasingly above the observed one. Full agreement is recovered
(Fig. 8) by replacing eq. (14) with
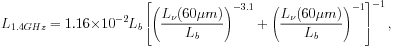 |
(15) |
in which Lb = 8.8 × 1029 erg s-1 Hz-1.
While a radio/far-IR correlation is expected since young stars are
responsible both for dust heating and for the generation, via supernova
explosions, of synchrotron emitting relativistic electrons, a clear
explanation of its tightness and of its linearity over a large
luminosity range is still missing. A decrease of the
L1.4 GHz /
L(60 µm)
ratio with increasing far-IR luminosity is expected from the
increase of the effective dust temperature, Td,
with luminosity
(Blain
& Longair 1996).
For a galaxy like the Milky Way, the far-IR SED
peaks at 170 µm, whereas for an Ultra Luminous Infrared Galaxy
(ULIRG) it peaks at about 60 µm
(Lagache
et al. 2005).
This factor of 3 increase in temperature for a factor
~ 103 increase in luminosity corresponds to
Td  LFIR1/6. If the radio luminosity is
proportional to the global far-IR luminosity, this increase in dust
temperature results in a decrease of the L1.4 GHz /
L(60 µm) ratio by a factor of 2.5-3.
LFIR1/6. If the radio luminosity is
proportional to the global far-IR luminosity, this increase in dust
temperature results in a decrease of the L1.4 GHz /
L(60 µm) ratio by a factor of 2.5-3.
On the other hand, there are different contributions to the global far-IR luminosity. In Luminous and Ultra Luminous Infrared galaxies, the emission is dominated by warmer dust, associated with star-formation, while infrared "cirrus" emission, heated by older stars, becomes increasingly important in galaxies with lower and lower star-formation rates. The latter component may be weakly correlated with radio emission, if at all. Moreover, in very low luminosity galaxies interstellar magnetic fields may be so weak as to let synchrotron emitting electrons escape into intergalactic space or to lose energy primarily via inverse Compton scattering of CMB photons. These processes may over-compensate the effect of decreasing dust temperature 5.
Anyway, the tight empirical relationship between radio and far-IR luminosities for star-forming galaxies allows us to take advantage of the wealth of data at far-IR/sub-mm wavelengths to derive the radio evolution properties. We expect a different evolution for starburst and normal late-type galaxies as the starburst activity is likely triggered by interactions and mergers that were more frequent in the past, while in normal galaxies the star-formation rate has probably not changed much over their lifetimes. The bulk of the sub-mm counts measured by SCUBA surveys (Scott et al. 2006, Coppin et al. 2006) is due to yet another population, the sub-mm galaxies (SMGs), proto-spheroidal galaxies in the process of forming most of their stars (Granato et al. 2004).
There have been a number of attempts to model the evolution of
star-forming galaxies and in particular to account for the apparent
intrusion of this population into the source counts at
S1.4 GHz  1 mJy; see e.g.
King
& Rowan-Robinson (2004).
A straightforward extrapolation to radio
frequencies of the evolutionary models by
Negrello
et al. (2007)
for the three populations (normal, starburst and sub-mm
galaxies), exploiting eq. (15) and the
SEDs of NGC 6946 for normal late-type galaxies and of Arp220 for
starburst and proto-spheroidal galaxies, yields the curves shown in
Figs. 4 -
6,
nicely reproducing the counts at tens of µJy levels. We note
however that new observational data, some of which is described in
Section 2.3, may permit substantial
refinement of these models.
1 mJy; see e.g.
King
& Rowan-Robinson (2004).
A straightforward extrapolation to radio
frequencies of the evolutionary models by
Negrello
et al. (2007)
for the three populations (normal, starburst and sub-mm
galaxies), exploiting eq. (15) and the
SEDs of NGC 6946 for normal late-type galaxies and of Arp220 for
starburst and proto-spheroidal galaxies, yields the curves shown in
Figs. 4 -
6,
nicely reproducing the counts at tens of µJy levels. We note
however that new observational data, some of which is described in
Section 2.3, may permit substantial
refinement of these models.
The cross-over between synchrotron plus free-free emission prevailing at
cm wavelengths, and thermal dust emission, generally occurs at
 2-3 mm (in the rest
frame), so that at frequencies of tens of
GHz there are contributions from both components (see
De
Zotti et al. 2005).
2-3 mm (in the rest
frame), so that at frequencies of tens of
GHz there are contributions from both components (see
De
Zotti et al. 2005).
6.2. Radio afterglows of
 -ray bursts
(GRBs)
-ray bursts
(GRBs)
The afterglow emission of GRBs can be modelled as synchrotron emission
from a decelerating blast wave in an ambient medium, plausibly the
interstellar medium of the host galaxy
(Waxman
1997,
Wijers
& Galama 1999,
Mészáros 1999).
The radio flux above the self-absorption break at
 5 GHz, is
proportional
to 1/3 up to a peak
frequency that decreases with
time. This implies that surveys at different frequencies probe different
phases of the expansion of the blast wave. Owing to their high
brightnesses, GRB afterglows may be detected out to exceedingly high
redshifts and are therefore important tracers of (a) the early star
formation in the Universe, and of (b) the absorption properties of the
intergalactic medium across the reionization phase. Estimates of the
counts of GRB afterglows have been made by
Ciardi
& Loeb (2000),
who found that at a fixed time-lag after the GRB in
the observer's frame, there is only a mild change in the observed flux
density at radio wavelengths with increasing redshift. This stems in
part from the fact that afterglows are brighter at earlier times and
that a given observed time refers to an intrinsic time in the source
frame that is earlier as the source redshift increases. According to
Ciardi
& Loeb (2000)
estimates, a large area survey at
1 cm to
a flux limit 1 mJy
should discover some GRBs (see also
Seaton
& Partridge 2001,
De Zotti
et al. 2005).
Predictions of Ciardi & Loeb's models at 1.4 and
3 GHz are shown in Figs. 5 and
6.
5 GHz, is
proportional
to 1/3 up to a peak
frequency that decreases with
time. This implies that surveys at different frequencies probe different
phases of the expansion of the blast wave. Owing to their high
brightnesses, GRB afterglows may be detected out to exceedingly high
redshifts and are therefore important tracers of (a) the early star
formation in the Universe, and of (b) the absorption properties of the
intergalactic medium across the reionization phase. Estimates of the
counts of GRB afterglows have been made by
Ciardi
& Loeb (2000),
who found that at a fixed time-lag after the GRB in
the observer's frame, there is only a mild change in the observed flux
density at radio wavelengths with increasing redshift. This stems in
part from the fact that afterglows are brighter at earlier times and
that a given observed time refers to an intrinsic time in the source
frame that is earlier as the source redshift increases. According to
Ciardi
& Loeb (2000)
estimates, a large area survey at
1 cm to
a flux limit 1 mJy
should discover some GRBs (see also
Seaton
& Partridge 2001,
De Zotti
et al. 2005).
Predictions of Ciardi & Loeb's models at 1.4 and
3 GHz are shown in Figs. 5 and
6.
5 We are grateful to J. Condon for enlightening comments on this issue. Back.
