


The radio background provides a key constraint on the counts of sources too faint to be individually detected. At frequencies below 1 GHz, the extragalactic radio background is swamped by the much more intense Galactic emission, primarily the synchrotron emission from diffused and integrated supernova remnants. Estimates at meter wavelengths made over 40 years ago Bridle (1967) using the T-T plot method (Turtle et al. 1962) yielded an antenna temperature of the extragalactic background at 178 MHz of Tbkg = 30 ± 7 K, about one third of the minimum total sky brightness at that frequency. Subtraction of the Galactic emission assuming that it scales as csc|b|, (b = Galactic latitude) is very inaccurate, as (i) Galactic emission towards the Galactic poles is not removed, and (ii) there are major features such as the North Galactic Spur which follow no such law. In fact the morphology is complex; see for example the superb map at 408 MHz by Haslam et al. (1982).
An independent estimate of the background intensity was obtained by Clark et al. (1970), exploiting the low-frequency measurements obtained with the Radio Astronomy Explorer (RAE-1) satellite. While the T-T plot method exploits the isotropy of the background and its different spectral index to separate it from Galactic emission, low-frequency measurements exploit the strong attenuation of the extragalactic radiation below 1 MHz due to free-absorption by electrons in the interstellar medium. Measurements at these frequencies can therefore be used to single out the Galactic-disk component. Extrapolating to higher frequencies and subtracting from measurements of the total flux Clark et al. were able to obtain an estimate of the extragalactic background intensity. Obviously the method works best in regions of low Galactic emission, such as the `north halo minimum' region (l ~ 150°, b ~ 50°). Once again the isotropic component was identified to be about one-third the minimum total brightness observed at 100 MHz. The spectral index appeared to be similar to the average spectral index observed for extra-galactic sources, suggesting that the isotropic component does represent the extragalactic background rather than an isotropic halo of the Galaxy.
Gervasi et al. (2008) calculated the brightness of the isotropic background anticipated from unresolved extragalactic source, using modern compilations of source counts and fitting smooth functions to these counts. Their results range from Tb = 38600 K at 151 MHz to 0.41 K at 8.44 GHz; over this range the Tb - frequency law is close to a power law.
Interest in the radio background was recently revived by the results of
the second-generation balloon-borne experiment ARCADE-2 (Absolute
Radiometer for Cosmology, Astrophysics, and Diffuse Emission). After
subtracting a model for the Galactic emission and the CMB,
(Fixsen
et al. 2009)
found excess radiation at 3 GHz about 5 times
brighter than the estimated contribution from extragalactic radio
sources, as calculated by Gervasi et al. and in the present work (see
Fig. 12). From a re-analysis of several
large-area surveys at lower frequencies to separate the Galactic and
extragalactic components,
Fixsen
et al. (2009)
obtained an extragalactic background power-law spectrum
of T = 1.26± 0.09 K
( /
0)-2.60±
0.04, with
0 = 1 GHz from 22
MHz to 10 GHz, in addition to a CMB
temperature of 2.725 ± 0.001 K. These results are compared to
earlier estimates in Fig. 12, where we show
the background brightness,
I,
in Jy/sr, as a function of frequency.
I
is related to the antenna temperature, Ta, by
/
0)-2.60±
0.04, with
0 = 1 GHz from 22
MHz to 10 GHz, in addition to a CMB
temperature of 2.725 ± 0.001 K. These results are compared to
earlier estimates in Fig. 12, where we show
the background brightness,
I,
in Jy/sr, as a function of frequency.
I
is related to the antenna temperature, Ta, by
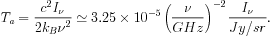 |
(16) |
where the numerical coefficient holds for Ta in K, and 1 Jy = 10-23 erg cm-2 s-1 Hz-1. As shown by the figure, the ARCADE results are inconsistent with earlier measurements. We note that the antenna temperature at 81.5 MHz implied by the power-law fit of Fixsen et al. (2009), 854 K, exceeds the minimum total sky brightness temperature of 680 K measured by Bridle (1967).
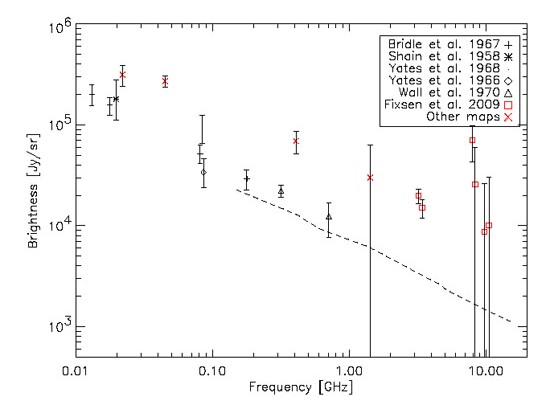 |
Figure 12. Estimates of the extragalactic radio background at different frequencies. The black symbols refer to estimates exploiting the methods mentioned in the first two paragraphs of Section 7, while the red symbols refer to estimates by Fixsen et al. (2009) either using ARCADE 2 data (squares) or re-analyzing published data from large area surveys ( × ). The dashed line shows the extragalactic background spectrum yielded by the models fitting the counts in Figs. 4 - 7. |
