


In this section we provide a rough guide to the study of galaxy shapes, orientations, and alignments throughout the twentieth century, deferring the discussion of more recent research since about 2000 to the main part of this paper and its companion works. We do not claim to be comprehensive but rather highlight influential works and key developments.
3.1. The very first works: 1914-1926
The first statement regarding the orientations of galaxies that we have been able to trace was made by Fath (1914), who published a list of 1,031 galaxies observed with the 60-inch reflector at Mt. Wilson Solar Observatory. It contains position angles for approximately 60% of the objects and, while there was no detailed study in the text, it was stated in the summary that “[o]n the assumption that most of the nebulae are approximately disc-shaped the planes of the discs appear to be oriented at random in space.”
A more explicit analysis of the orientations of galaxies was performed by Reynolds (1920), using seven galaxies in the southern and 16 in the northern Galactic hemispheres whose diameters 6 exceeded 10′. Reynolds (1920) noted that 16 of the 23 galaxies (70%) had inclination angles with respect to the line-of-sight of 30∘ or less, consistently for both Galactic hemispheres, and briefly suggested that this could imply some connection between our own Galaxy and those he observed in the sense that the planes tended to coincide. Soon after, Reynolds (1922) confirmed his previous result using 263 spirals, including galaxies up to ∼3 times smaller than before. Of these 263 spirals, 172 (65%) had inclination angles < 30∘, consistent with his previous measurement. He found a relation between size (which he regarded as a measure of distance) and average angle, with galaxies with diameters {3′ − 5′, 5′ − 10′, > 10′} having average inclination angles {26.7∘, 24.2∘, 21.9∘}. He used his findings to construct an argument that supported Shapleys view that these spirals were not objects similar to the Milky Way.
Subsequently, a lively debate between Reynolds and Öpik over the validity of these results ensued (Öpik 1923a, Reynolds 1923a, Öpik 1923b, Reynolds 1923b). While the discussion had no definite conclusion, it marked the first occurrence of a persistent theme in galaxy alignment observations: the importance of selection effects and systematic trends. Remarkably, at least two points were raised in this regard which are still relevant today. Öpik (1923a) argued that Reynolds results stem from a selection effect rather than a real alignment, in that edge-on spirals with fixed apparent magnitude have a higher surface brightness than face-on spirals, thus favouring the detection of the former. Reynolds (1923a) replied that the suggested larger surface brightness would be compensated by an “absorbing medium along the periphery of the spiral arms,” such that spiral galaxies should appear brightest at 20∘–30∘. Indeed, selection biases due to orientation and dust can be important in modern datasets as well and may have impacted on some of the results discussed later on in this section.
For elliptical galaxies their flattening generally was the only clearly discernible morphological feature in the images of the time. Therefore ellipticity determined the subdivisions on Hubble's early-type branch, En, where n ran from 0 to 7 and was given by the integer part of 10(1 − b / a), where b / a again denotes the axis ratio of the galaxy image. Hubble (1926) also presented a de-projection scheme for elliptical galaxies, noting that the distribution of projected galaxy ellipticities is sensitive to whether galaxies have preferred orientations or are randomly distributed. Thus Hubble initiated another recurrent theme in galaxy alignment studies, the relation between three-dimensional correlations and their projection on the sky.
Brown (1938b) revisited Reynolds's claim of preferred inclinations of disc galaxies using a sample of 600 galaxies observed at Heidelberg observatory, covering the whole northern sky down to declination −20∘. Among disc galaxies exceeding 2 in diameter he found a 14 % excess of galaxies with axis ratios below 1/3 and an even more pronounced depletion of nearly circular objects. He presented evidence for the completeness of his sample, thus arguing in favour of the physical nature of this effect. This claim was disputed by Knox-Shaw (1938) who did not find deviations from random orientations of disc galaxies larger than 2 in a sample of similar size in the Shapley-Ames catalogue. Brown (1938a) in turn challenged those results, finding an excess of nearly edge-on objects in the same catalogue after correcting for incompleteness of strongly elliptical objects due to the limiting magnitude. He presented additional data that suggested the excess is seen down to galaxy diameters of 30.
Brown was also among the first to investigate the systematic alignment of galaxies in the plane of the sky. In the Horologium supercluster he found a strong preference in a sample of 355 galaxies for a narrow range of position angles (e.g. more than twice the number of galaxies than expected for a random orientation in a 10∘ range of position angle; Brown 1939). Wyatt & Brown (1955) later made a very similar observation for a region in Cetus, claiming a detection in excess of 4σ. However, Reaves (1958) noted that a new, more complete dataset showed no preferred galaxy orientations in the same Horologium area of sky. It is instructive to read Brown's review of these works and others of that period in the introduction of Brown (1964).
As the examples above showcase, many observations of galaxy alignments were – and arguably are to the present day – tentative, depending strongly on the approach and dataset used. While it was clear from the earliest efforts that selection effects played a pivotal role (see e.g. Burstein et al., 1991 for a detailed discussion), it is interesting to note that neither distortions of shape and spurious alignments caused by telescope tracking, optics, or the photographic plates nor biases due to the human-led object detection and morphology measurement were mentioned in these works.
3.3. A case study: alignments in the Palomar Sky Survey
It is worth taking a closer look at the work of Brown (1964), which was based on a galaxy sample size (close to 5000) approaching the order of magnitude that is routinely used nowadays, and claimed a significant detection of alignments, both among galaxies and between galaxies and large-scale structure. The analysis was performed on several thousands of square degrees situated around the vernal equinox, based on observations with the Palomar Observatory Sky Survey (POSS). The actual measurements were done on prints of the photographic plates which were clipped to a plywood base of the same size as the print and covered by a sheet of highly transparent material sold commercially as Polyglaze, which in turn was ruled with a grid pattern. Galaxy sizes and position angles were then read off with a scale and protractor, while the type classification and rejection of dubious images or artefacts was done by eye, helped by the colour information from the red and blue POSS plates.
Limiting himself to galaxies with major axis diameters larger than 40, Brown found a strong excess of position angles in a bin 15∘ wide, concentrated in an area he referred to as the Pisces Concentration that covers part of the Pisces-Cetus supercluster and the Pegasus I and II clusters. As can be seen in Figure 4, the elongation direction of the concentration matches closely the preferred direction of galaxies within. Brown (1968) extended the analysis to other areas covered by POSS and again found several samples with marked excesses in position angle. Reinhardt (1971) confirmed the significance of the detections via simple statistical checks and identified another nearby cluster region in which galaxies align with themselves and with the main axis of the cluster.
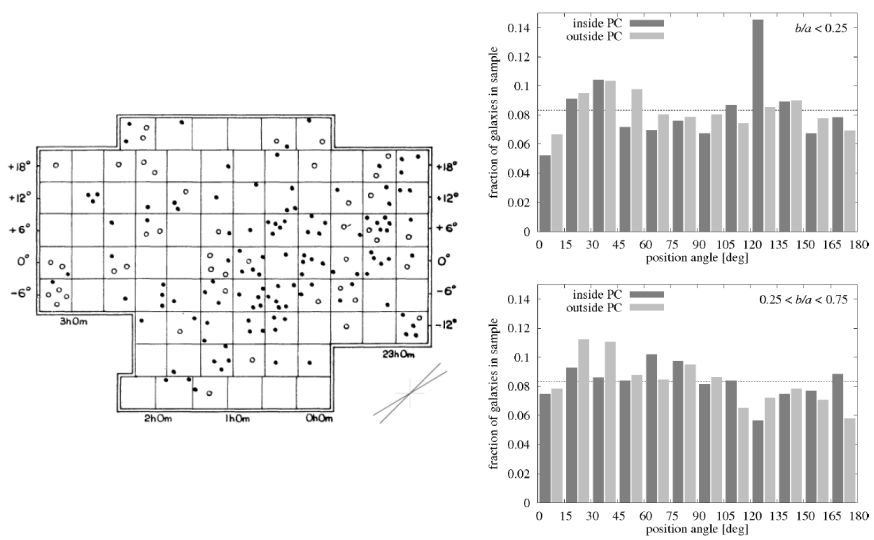 |
Figure 4. Left: Area of the Palomar Sky Survey analysed by Brown (1964). Dots (circles) mark the positions of galaxies with diameters in excess of 40 (60), axis ratios of less than 0.25, and position angles in the range 121 to 135 degrees (East of North, indicated by the lines at the bottom right). Rectangular lines correspond to plate boundaries. Right: Normalised histograms of position angle distributions compiled from table VII of Brown (1964). The top (bottom) panel shows galaxies with axis ratios b / a < 0.25 (0.25 < b / a < 0.75). Light grey bars correspond to galaxies inside the Pisces Concentration (PC, roughly comprises the overdensity seen in the left panel), dark grey bars to those outside the concentration. The black dashed line indicates the expected fraction for a random distribution of galaxy orientations. Reproduced with permission from Brown (1964). |
Brown (1968) tested for systematic errors in the position angles by repeating the measurements after rotating the prints by 90∘, and by comparing measurements of the same galaxy on overlapping plates, in both cases finding biases well below the bin width of the distributions. Reinhardt (1972) discussed in detail possible systematics, including physiological ones related to the visual analysis, and conducted further significance tests on Brown's measurements, concluding that the effect must have an astrophysical origin. In contrast to this, Öpik (1970) once again argued that the preferential orientations of position angles could be explained by selection effects, his key argument being that any preferred orientation of disc galaxies has to coincide with a preferred axis ratio, i.e. disc inclination. Since this was not observed, Öpik concluded that the effect cannot be physical.
To our knowledge this debate remains without definite conclusion to the present day. It is challenging to translate the selection criteria and measurements to modern CCD-based observations and automated galaxy detection and morphology measurements, particularly for the key parameters, size and axis ratio (see Fouque & Paturel 1985). Current databases have their own limitations, e.g. a reproduction of Brown's results with standard products of the Sloan Digital Sky Survey pipeline is hindered by a spurious pattern in the distribution of position angles caused by limitations in the fitting procedure of galaxy light profiles (Varga et al., 2013). Similarly, in an attempt to repeat the analysis using a scanned catalogue of the Palomar Survey 7 we found patterns of preferred position angles of 0∘ and 90∘ for large, edge-on galaxies in the area covered by Brown (1964), which may hint at a spurious alignment with the edges of the photographic plates. This could be caused by systematic effects in the shape measurement (as image distortions are likely to be largest far from the optical axis of the telescope) or again due to selection effects (galaxies with orientations perpendicular to the plate boundary are more likely to have their light profile cut off by the edge, and thus be discarded, than those which are parallel).
3.4. More recent observational works
For a further discussion of alignments of nearby galaxies with the local large-scale structure we recommend the review by Hu et al., (2006) who not only covered recent work but also the historical development of the field. The authors provided a detailed account of the limitations and systematic effects in the majority of twentieth century datasets, arguing that complex selection effects, incompleteness and contamination of galaxy samples, as well as an under-estimation of statistical and systematic errors explains many discrepancies found in early papers. This applies in particular to the Uppsala General Catalogue, which was derived from the Palomar Sky Survey and constituted a standard dataset from the mid 1970s into the 1990s. It is likely that the arguments of Hu et al., (2006) also apply to the alignment studies in the more distant Universe of that period.
In light of this context, the work of Hawley & Peebles (1975) is remarkable in its rigorous error analysis and more conservative conclusions. The authors did not claim detections of any significant physical galaxy alignments in a large Palomar Sky Survey sample in excess of 5500 galaxies, except a tentative alignment of galaxies in the Coma cluster towards the cluster centre. Using blind analysis techniques, they did however identify various sources of significant systematic signals including: a decrease in the measured size of galaxies over the duration of the project, a tendency for galaxies to be aligned vertically on the prints (due to observer bias or distortions in the print), a preferential selection of diagonally oriented galaxies if these have small angular size, and a potential bias due to the analyst's assignment of measured position angles at histogram bin boundaries.
Helou (1984) detected spin correlations among about 30 close galaxy pairs, using a combination of spectral line measurements, dust obscuration in the disc, and spiral patterns to assign a sense of rotation in addition to the spin direction. He found evidence for a preferential anti-alignment of galaxy pairs, and thus for tidal torque theory and against the primeval turbulence model. Lambas et al., (1988b) did not observe a departure from random orientations for spiral and lenticular galaxies with respect to the surrounding galaxy distribution on scales of a few megaparsecs, but found the major axes of ellipticals to align with the large-scale structures. On similar scales, Muriel & Lambas (1992) claimed a 2.8σ detection of major axis alignment with the position of the nearest neighbour for spirals, while reporting significant alignments beyond the nearest neighbour for elliptical galaxies.
Regarding the orientations of galaxies within individual clusters, early results were contradictory, sometimes even on a cluster-by-cluster basis: in the Coma cluster, Rood & Baum (1967) found no evidence of a preferred orientation but Djorgovski (1983) found significant alignments both of satellite galaxies towards the central galaxy and between clusters. On a statistical level, however, most studies pointed to random orientations of these galaxies. The first such statistical analysis was done by Dressler (1978), who found no evidence for satellite galaxy alignments in 12 clusters.
Given the intricacies of measuring the shapes and orientations of individual galaxies, astronomers hoped to obtain more robust results from clusters of galaxies, using the distribution of member galaxies on the sky as a tracer of the projected cluster shape. In an early effort, Sastry (1968) measured the alignment of the central bright cD galaxy with the shape of its host cluster for nine Abell clusters, each with around 30 securely identified galaxy members in the Palomar Sky Survey. He found strong alignment within 10∘ for five clusters (later confirmed by Carter & Metcalfe (1980)) and no alignment for the Coma cluster; the remaining clusters were too close to circular to define an orientation. Soon after, Holmberg (1969) found the opposite result for field galaxies: their haloes tend to be aligned with the galaxies minor axis. Lynden-Bell (1976) pointed out that this effect is also present in the Milky Way whose satellites and distant globular clusters lie in a tight plane within about 10∘ from the Galactic poles.
In a pioneering work, Binggeli (1982) obtained the position angles and ellipticities of 44 regular (i.e. with shapes which are well approximated by an ellipse) Abell clusters and their brightest cluster galaxies (BCG) in the same survey. The strong alignment of clusters and BCGs was confirmed; see Figure 5. Additionally, the author detected alignments between neighbouring clusters separated by less than about 30 Mpc, and between cluster shape and the distribution of surrounding clusters out to 100 Mpc, arguing that tidal interactions must play a critical role in the dynamics of these systems. Struble & Peebles (1985) repeated the analysis with 237 clusters located in superclusters, finding only weak, if any, detections. However, later works supported Binggeli's findings with increasingly large samples and varying degrees of significance (Argyres et al., 1986, Lambas et al., 1988a, 1990, Plionis 1994, Fuller et al., 1999).
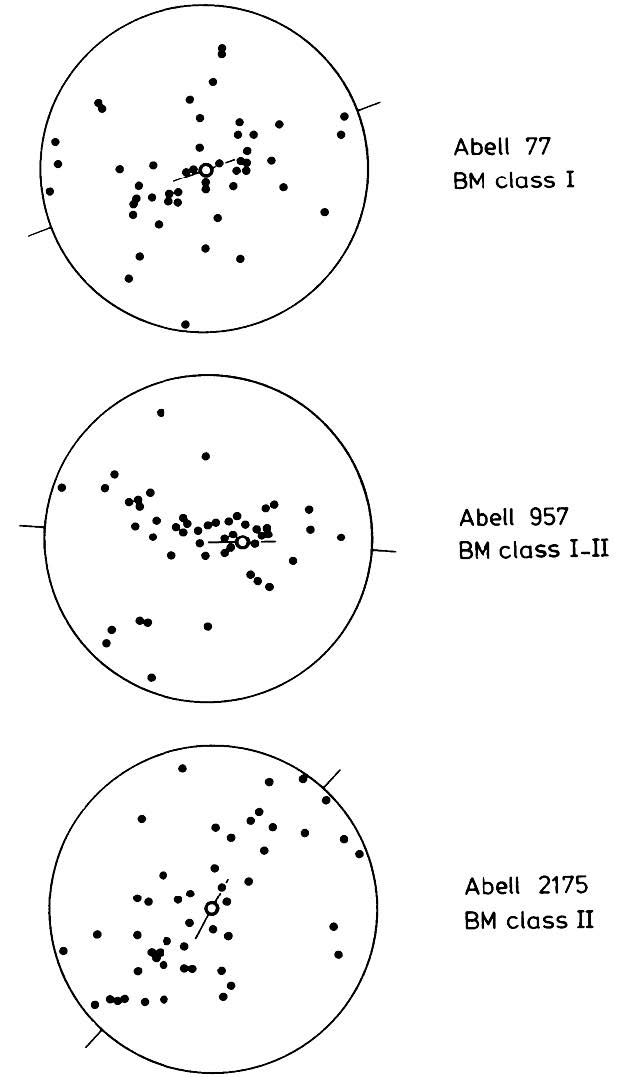 |
Figure 5. Three strongly elongated Abell clusters analysed by Binggeli (1982). The 50 brightest galaxies in a radius of 2 Mpc are plotted as black dots in each case. The brightest galaxy (BCG) is indicated by the circle. Position angles of the BCG and cluster are given by the thin black lines. BM class stands for the morphological Bautz-Morgan classification Bautz & Morgan (1970) of galaxy clusters, where classes I and II are dominated by elliptical BCGs. Reproduced with permission from Binggeli (1982) © ESO. |
West (1989) extended this type of analysis to the alignment of galaxy group shapes with neighbouring group positions and detected alignments out to tens of megaparsecs. Interestingly, he concluded that this result would favour a top-down structure formation scenario and hence provides evidence against the Cold Dark Matter model. Muriel & Lambas (1989) did not see alignments of spiral and lenticular galaxies with the surrounding galaxy distribution, suggesting a galaxy type and/or environment dependence of galaxy alignments when contrasted with the results for elliptical galaxies in the centres of clusters. Dropping the assumption that cluster galaxies trace its overall shape, West et al., (1995) studied the correlation of the X-ray cluster ellipticity or its substructure distribution, as measured by the Einstein satellite, with the large-scale structure, using 93 clusters with z < 0.2, and claiming a marked detection of alignments. Chambers et al. (2000, 2002) confirmed a strong alignment with the position of nearby clusters using 103 different clusters and data from the Einstein and ROSAT satellites.
3.5. Early Tidal Torque Theory
Hoyle, (1951) was the first to suggest tidal torques as the origin of galactic rotation. 8 In this paradigm the matter falling into a halo to form a galaxy acquires angular momentum through the interaction of the quadrupole of the matter distribution with the tidal gravitational forces of the surrounding matter (see Section 2.3 for a more detailed account). As Peebles (1969) noted in his seminal paper, tidal torque theory explains the formation of rotating discs as a natural consequence of the gravitational instability picture of structure formation, as opposed to earlier suggestions by von Weizsäcker (1951) and Gamow (1952) who postulated a primeval turbulence which would have transferred an ab initio value of angular momentum to the galaxies.
As argued e.g. by Sandage et al., (1970), the amount of angular momentum of the gas cloud collapsing at the time of galaxy formation was considered to be critical to determine the Hubble type of the galaxy, with little impact of the subsequent evolution. Low angular momentum was linked to rapid fragmentation and thus early star formation which quickly depletes gas and leads the final stages of the collapse to be governed by stellar rather than gas dynamics, creating a spheroidal system. Conversely, the systems with high angular momentum collapse into the gas-rich discs associated with spiral galaxies (see also Jones 1976, Efstathiou & Silk 1983). Jones (1976) also proposed spin correlations between nearby galaxies as an observational test to distinguish tidal torque theory from the primeval turbulence model.
Sharp et al., (1979) proceeded to demonstrate that disc galaxies in close pairs can have a non-random distribution of the angle between their major axes, as a result of spin angular momentum alignment due to tidal torques. However, they found that the observed distribution of this angle, using 79 pairs of galaxies, was consistent with the spin of the galaxies being completely uncorrelated; this was still the case even when a more stringent selection criterion was used to isolate galaxy pairs. Their attempt at reducing observer bias in manually measuring the position angles was to employ at least two analysts to measure the angle of each galaxy pair member, whilst the other galaxy was masked out. Sharp et al., (1979) suggested that since the data seemed inconsistent with the assumption that the galaxy spin was frozen in at formation, later interactions might further affect spin.
White (1984) then established the concept and formalism of tidal torque theory as it is currently used in a succinct work that built on an earlier argument by Doroshkevich, (1970). While Peebles (1969) calculated the build-up of angular momentum in a spherical region, which takes place at second order in perturbation theory, White showed that galaxies as generally non-spherical objects acquire angular momentum via the torques induced by the tidal quadrupole which is misaligned with the moment of inertia, a first-order effect. Moreover, he demonstrated that in Peebles picture angular momentum is generated solely via the transport of matter across the boundary of the sphere. White confirmed the results for the first-order effect for groups of particles in N-body simulations that were linked with a friends-of-friends algorithm, so long as the matter density is low enough that first-order perturbation theory is applicable (this was later confirmed by Barnes & Efstathiou 1987).
3.6. More recent theoretical and numerical progress
Galaxy clusters were also at the focus of theoretical research on the shapes and alignments of matter structures in the last two decades of the twentieth century, in part to match the observational progress but also because the resolution of N-body simulations allowed a detailed study of only the largest bound structures. For instance, Dekel et al., (1984) measured alignments of cluster-size dark matter haloes with each other and the position of neighbouring haloes in N-body simulations, with the aim of verifying the observations by Binggeli (1982). Significant detections that matched observations were indeed made but only in simulations that featured top-down structure formation scenarios, while no agreement was found for the signals generated by tidal alignments in Cold Dark Matter models. It should be noted that the simulation suites used in that work contained a total of 103 to 104 particles, with massive clusters typically consisting of 10 − 30 particles, which is at least an order of magnitude below current limits for reliable measurements of halo shapes and angular momenta (Bett et al., 2007, Joachimi et al., 2013).
Cluster alignments were thought to be key probes in providing answers to the most important cosmological questions of the time, such as discriminating between hot and cold dark matter models, or determining the total matter density parameter Ωm. Indeed, in their simulation-based study of alignments of cluster-size haloes with the surrounding matter distribution, West et al., (1989) argued that alignments (but not shapes) can help discriminate between different cosmogony scenarios (see also West et al., 1990). Subsequent works used these alignments to test structure formation scenarios, and probed their sensitivity to cosmological parameters, sometimes with contradictory conclusions (e.g. West et al., 1991, van Haarlem & van de Weygaert, 1993, Splinter et al., 1997).
Regarding analytic work, a productive route was the analysis of the peaks in Gaussian random fields which are expected to be a good representation of the primordial spatial distribution of matter density fluctuations. Depending on the peak threshold or smoothing scale, these peaks are assumed to describe the matter distribution around galaxies or clusters. Peacock & Heavens (1985) calculated the distribution of shapes of peaks in random fields, finding that typical peaks (corresponding to massive galaxies) are prolate, nearly independent of the form of the matter power spectrum, while the highest peaks (corresponding to clusters) are closer to spherical (see also the seminal paper by Bardeen et al., 1986 who also consider the shapes of peaks in the matter distribution). Heavens & Peacock, (1988) extended this work to computing tidal torques and spin parameters of the peaks, concluding that the low angular momentum of elliptical galaxies compared to spirals cannot be explained solely by the larger host halo mass of ellipticals because the calculated anti-correlation between peak mass and spin parameter was weak. Using a similar approach, Catelan & Theuns (1996) later obtained realistic spin parameter values for spiral galaxies, reasoning that highly non-linear processes must therefore happen during the evolution of ellipticals, such as would occur during violent galaxy mergers. Salvador-Sole & Solanes (1993) analytically estimated cluster properties based on tidal alignments and could explain the observed distribution of cluster axis ratios and (qualitatively) the alignment signals of clusters. The authors concluded that tidal effects are important ingredients in the dynamics of large-scale structure.
Generally, tidal forces emerged as the central driver for all forms of observed alignments in the large-scale matter distribution. In addition to the well-known link to the angular momenta of bound structures, Dubinski, (1992) proposed that the tidal shear directly affects the shape of a halo. However, in constrained N-body simulations with external tidal shear, he did not find a clear correlation between the shapes of initial density peaks and those of the resulting haloes. Catelan et al., (2001) built on this work to devise their tidal stretching model for intrinsic alignments (see Section 2.3), predicting that the correlations of projected galaxy shapes should be stronger for elliptical than for spiral galaxies, which current results suggest is indeed the case (see Section 6). Note that, much earlier, Barnes & Efstathiou (1987) had seen from simulations that the alignments of the major axis of a halo with nearby objects was stronger than the corresponding alignment of the angular momenta. Hence, while the repeated usage of tidal effects to explain the origin of the dichotomy between spiral and elliptical galaxies may not have proven conclusive, they do seem to imply a marked galaxy type dependence of alignment signals.
The paper by Catelan et al., (2001) was part of a suite of works which were contemporaneous with the first detections of cosmic shear (Bacon et al., 2000, Kaiser et al., 2000, Van Waerbeke et al., 2000, Wittman et al., 2000) and which established a link between the old field of galaxy alignments and the novel, promising cosmological probe that equally relies on measurements of correlations between galaxy shapes. Heavens et al., (2000) used N-body simulations to quantify the expected contamination of weak lensing signals by intrinsic galaxy alignments. They considered both an elliptical and spiral model analogous to Catelan et al., (2001) for the translation of halo shape to galaxy shape and concluded that deep surveys with a broad redshift distribution should not be affected significantly. Assuming that halo shapes trace the galaxy shapes, Croft & Metzler, (2000) found significant intrinsic shape correlations in N-body simulations out to 20 Mpc/h, which could account for 10 − 20% of the signal seen in first cosmic shear detections. They anticipated the concern that this contamination would become more significant once weak lensing source samples were defined in narrow redshift slices.
6 These sizes are difficult to relate to modern measurements such as the half-light radius, but it is enough to consider that these are 23 of the largest galaxies, in apparent size, that there are. Back.
8 Efstathiou (2003) provides an excellent description of the conference proceedings in which Hoyle first proposed his theory. In fact, as highlighted by Efstathiou (2003), Hoyle makes a remarkably prescient statement in a later work (Hoyle 1966) that the properties of the individual stars that make up the galaxies form the classical study of astrophysics, while the phenomena of galaxy formation touches on cosmology. In fact, the study of galaxies forms a bridge between conventional astronomy and astrophysics on the one hand, and cosmology on the other. Back.