


A dark matter halo above a certain minimum mass tends to host one or more galaxies, where in the latter case one distinguishes between a central galaxy and satellites. Frequently, the most massive or brightest of the galaxies in a halo is observationally defined as the central galaxy. It is generally expected to be situated close to the centre of the halo which attracts most of the baryonic matter, especially if the central is much more massive than any satellite. In this section we discuss the alignments of the central galaxy with its own halo, in most cases traced by the spatial distribution of the satellite galaxies 9, as well as the alignments of the shapes of satellites measured relative to the centre of the halo (or the observable central galaxy). Since the satellites generally have to be identifiable in surveys beyond the local Universe, the haloes studied are mostly those of galaxy groups (with typical masses 1013 ≲ M / M⊙ ≲ 1014) and clusters (with masses M ≳ 1014 M⊙).
While the alignment of central galaxies with their host haloes (measured through the distribution of satellite galaxies) was established early on, the twentieth century saw a persistent lack of consensus regarding the level – or presence – of alignments of satellite galaxies within haloes, ranging from field galaxies to massive galaxy clusters. The history of such results can be understood in terms of the technical challenge in measuring the shapes of each of the objects: the shapes of central galaxies are relatively easy to measure, especially in massive galaxy clusters, since these are the largest galaxies in the Universe. In contrast, satellite galaxies are smaller, and their light is confused by neighbouring galaxies (an effect which is enhanced as we go from field galaxies to galaxy clusters).
4.1. Alignment of the central galaxy with its halo
As detailed in Section 3.4, Sastry (1968) first detected an alignment between the major axes of the central galaxy and the satellite distribution in clusters, while Holmberg, (1969) established an anti-alignment in the case of field galaxies and their satellites. This Holmberg effect is now well established locally in the Milky Way (Pawlowski et al., 2012) and M31 (Conn et al., 2013). However, the picture is different for objects outside the Local Group. The inverse Holmberg effect 10, i.e. the tendency of the central galaxy to align with its parent halo, has been observed from the scales of individual galaxies (e.g. Brainerd 2005) to galaxy clusters, the latter in support of the pioneering works by Sastry (1968) and Binggeli (1982); see also Figure 5. This is also strongly supported by simulations (e.g. Ocean Wang et al. 2014, and references therein). Note that a direct comparison with the results from the Local Universe is difficult because the work on the satellite distribution of more distant galaxies is limited to larger separations from the central galaxy and suffers from low numbers, so that alignments can only be detected statistically rather than on a per-galaxy basis.
Using SDSS galaxy groups, Yang et al., (2006) showed that the Sastry-type major-axis alignment is stronger for red galaxies and haloes defined by red satellites only, and is indeed not present in groups with blue central galaxies (see also Wang et al., 2008, and references therein.) Additionally, this effect is more pronounced at low redshifts and for more massive central galaxies but is independent of cluster richness (Hao et al., 2011. Sales & Lambas, 2004, 2009) showed that there also exists an inverse Holmberg effect for field galaxies (i.e. galaxies that do not have other galaxies above a certain brightness threshold in their neighbourhood), which is more prominent for red, passive central galaxies. Later works confirmed that the dichotomy between blue galaxies with no significant alignments and red galaxies with clear major-axis alignment extends down to galaxy-sized haloes, where the latter signals exists out to radii of 0.5 Mpc / h (Azzaro et al., 2007) and persists for stricter criteria of isolation of the host (Bailin et al., 2008). Agustsson & Brainerd (2010) confirmed these trends and were also able to qualitatively reproduce them with a simulation-based model, where blue central galaxies are assumed to have their spin aligned with the dark matter halo angular momentum and red galaxies are homologous to their halo. They explained the lack of blue satellite alignment with the more recent accretion of blue satellites compared to red ones, and a substantial number of interlopers in the sample, while the signal for blue central galaxies is diluted by averaging a major-axis alignment at small separations from the centre of the halo with a preferential minor-axis alignment (i.e. a Holmberg effect) at larger radii (rp ≳ 300 kpc).
A comparison of the strength of large-scale alignments in observations and simulations led Heymans et al., (2004) to suggest that galaxies and their dark matter haloes have typical misalignments of ∼30∘, later constrained by Okumura et al., (2009) to 35 ± 4∘. Wang et al., (2008) found similar results through a detailed study of SDSS galaxy groups, inferring an average projected misalignment of 23∘, which was stronger for blue galaxies and more massive haloes, reaching ∼ 65∘ for blue centrals in haloes of 1013 < M / M⊙ < 1014. This can be compared to the recent analysis of a hydrodynamic simulation by Tenneti et al., (2014, 2015), who determined that the (three-dimensional) mean misalignment between the dark matter and the stellar distribution decreases from order 30∘ to around 10∘ for group and cluster haloes, and that the degree of alignment does not depend on redshift but is slightly higher for red galaxies compared to blue ones of similar mass. Interestingly, the misalignment of the minor axes of blue central galaxies and their haloes of ∼ 40∘ coincides roughly with the typical misalignment between a halos angular momentum and its minor axis (e.g. Kang et al., 2007).
This suggests that the level of alignment between galaxy and halo angular momenta is the key quantity applicable to disc galaxies. The typical misalignment between the angular momentum directions of the gaseous and dark matter components in simulations is ∼30∘ (e.g. van den Bosch et al., 2002, Bett et al., 2010), in broad agreement with the aforementioned observations, where the degree of misalignment grows as a function of halo radius (Bailin et al., 2005, Deason et al., 2011). We caution at this point that, while hydrodynamic simulations are crucial to gain insight into the highly non-linear processes of small-scale alignment generation or destruction, they can currently only serve as exploratory tools as they still fail to reproduce fundamental galaxy properties such as colour, size, or stellar mass function, owing to the uncertainty in modelling small-scale physics below the resolution of the simulations (see e.g. the discussion in Schaye et al., 2015, Crain et al., 2015). For instance, Velliscig et al., (2015) found typical variations of about 10∘ (and up to 20∘) in the alignment angles of galaxies with their host haloes for scenarios based on different feedback processes occurring in galaxy formation in the EAGLE simulations (Schaye et al., 2015).
4.2. Alignment of satellite galaxy shapes
The alignment of satellite shapes, on the other hand, has a more complicated history (see Section 3.4), primarily because of the difficulty of measuring the shapes of small satellite galaxies which are additionally more significantly contaminated by light from neighbouring galaxies, particularly in the dense environments of groups and clusters. Early SDSS studies (which had orders of magnitude more galaxies, and much better data quality, than previous measurements) suggested that satellites in clusters aligned radially towards their central galaxies (Pereira & Kuhn 2005, Faltenbacher et al., 2007), but Hao et al., (2011) demonstrated that this was due to systematic effects arising from the contamination of shape measurements by light from neighbouring galaxies. Note that shape measurement methods differ in their sensitivity to the outskirts of the light profile of a galaxy, and therefore in their susceptibility to this contamination (Schneider et al., 2013).
Subsequently, the majority of studies have found that satellite galaxies in groups and clusters are consistent with being randomly oriented (Hung & Ebeling 2012, Schneider et al., 2013, Chisari et al., 2014, Sifón et al., 2015). An exception is Singh et al., (2014) who detected a non-zero correlation function of the form given in Equation (17) for small rp when restricting the sample with shape measurement to galaxies classified as satellites. Note, however, that their underlying sample consisted of bright early-type galaxies, so that these satellites are likely to be similarly bright as the central galaxy and only very sparsely populate haloes. This signal could indicate a galaxy type dependence of satellite alignments or an increase of alignment strength with the luminosity of the satellite.
N-body simulations typically use sub-haloes as a proxy for satellite galaxies. There is agreement in these simulations that there is a strong preferential radial alignment of satellites towards the centre of mass of the host halo (e.g. Kuhlen et al., 2007, Faltenbacher et al., 2008, Knebe et al., 2008b, Knebe et al., 2008a, Pereira et al., 2008). Faltenbacher et al., (2008) investigated this trend over a wide range of scales and found that this alignment is strongest within the virial radius of the host halo and drops off rapidly with increasing radius. Intriguingly, the strength of this alignment is inconsistent with the null signals seen in observations, and a possible explanation is the tidal torque origin of this alignment (see e.g. Knebe et al., 2008a): since the sub-haloes are subject to strong tidal torquing, the loosely bound outer particles will be more highly distorted than the inner particles. Consequently, the shape of the outer sub-halo would be more distorted than the inner region and the centre of the sub-halo (where the luminous satellite would reside) may have a weaker alignment with the centre of mass of the host (see also Pereira & Bryan, 2010). Therefore it is desirable to use hydrodynamic simulations (see e.g. Knebe et al., 2010) to account for such an effect, as well as the impact of baryons, and thus make predictions for quantities that are as close as possible to the observed ones. Tenneti et al., (2015) employed such a hydrodynamic simulation in a cosmological volume to measure the correlation functions of the position angles and projected shapes of the star particles in simulated galaxies. As these statistics are sensitive to satellite alignments on small scales, the authors could confirm a preferentially radial alignment whose strength increases with redshift and the mass of the host halo. Similar trends were previously seen for the same type of measurement in pure N-body simulations (Lee et al., 2008).
A tool that has proven successful in describing the clustering of galaxies and that has recently been extended to also model galaxy alignment statistics (Schneider & Bridle 2010) is the halo model. A sketch of the halo model view of the intra-halo galaxy alignment is shown in Figure 6. Small red ellipsoids represent satellite galaxies whereas the large green ellipsoid represents the shape of the dark matter halo whose extension encompasses the whole figure. Note that satellites are depicted as being preferentially radially oriented, where the strength of this orientation can potentially depend on halo mass and galaxy position within the halo. The halo model postulates that each galaxy resides in a dark matter halo (usually assumed to be spherical, at least effectively after averaging over a large number of haloes) whose mass is the main physical driver behind observable galaxy properties. Exploiting the fact that properties of haloes can be read directly from numerical simulations and that they can be presented in compact form via analytical fitting functions, the halo model allows for the computation of alignment statistics by assuming simple analytical parametric functions for the number of galaxies residing in a halo and for the dependence of their position and shape on the host halo mass.
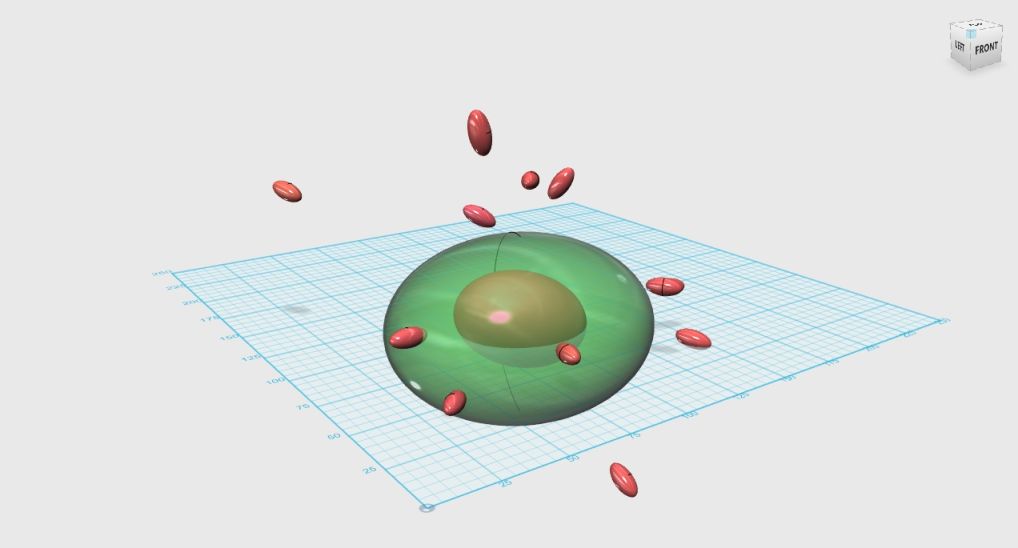 |
Figure 6. Sketch of galaxy alignments in galaxy groups and clusters. Satellite galaxies (small red ellipsoids) are depicted as preferentially pointing their major axes towards the centre of the cluster whose shape and orientation is indicated using a green ellipsoid. The large red ellipsoid represents the central galaxy of the cluster, which generally does not have the same ellipticity and orientation as its host halo. |
Schneider & Bridle (2010) proposed a single new parameter for the intra-halo alignment term which governs the strength of an assumed radial alignment of satellite galaxies, encoding a combination of average satellite ellipticity and stochastic misalignment. The simplicity of this model has led various observational studies to phrase their findings in terms of the same parameters (Schneider et al., 2013, Sifón et al., 2015, Singh et al., 2014). Arguably, the greatest advantage of using the halo model is the simplicity of the computation together with the fact that, if needed, most of its assumptions can be refined in view of new results, both observational and theoretical, which make it the current framework of choice for modelling the small-scale, highly non-linear parts of alignment signals. However, a halo model of alignments is likely to fail on mildly non-linear scales outside the largest haloes (see Kiessling et al., 2015) where alignment processes unrelated to haloes, e.g. with the filamentary structure of the cosmic web, are relevant. These effects will be discussed in the following section.
9 Constraints on potential misalignments could in principle also be obtained from halo shape measurements via galaxy-galaxy lensing, stacking galaxies and orienting them with respect to their major axes (Hoekstra et al. 2004, Mandelbaum et al. 2006a, van Uitert et al. 2012). Back.
10 In hindsight this nomenclature is unfortunate, since Sastrys observation took place before that of Holmberg. Back.