


While the previous section dealt with alignments of the objects within haloes hosting galaxies, groups or clusters, we now proceed to discuss alignments between clusters as a whole, as well as alignments of galaxies with the defining elements of the cosmic web, such as filaments and the surfaces of voids. The gravitational tidal field tensor is widely used to classify the large-scale matter distribution according to its environmental characteristics. It determines the local deformation of a group of test particles in the gravitational field generated by the matter distribution as can be shown by Taylor-expanding the equation of motion of the test particles; see Equation (12). The form of the tidal tensor at any given point in space describes in which directions gravitational forces contract (positive eigenvalues) or expand (negative eigenvalues) a distribution of objects. For eigenvalues λ1 < λ2 < λ3, one can thus define the four categories (e.g. Hahn et al., 2007a) given in Table 1. For filaments, the eigenvector corresponding to λ1 specifies the direction of expansion, i.e. it points along the direction of the filament (see also Figure 2). For sheet-like structures, the eigenvector corresponding to λ3 is the local normal vector to the plane of the sheet. Clusters, or knots of the cosmic web, can be assigned an ellipsoid via the eigenvalues and eigendirections of the tidal tensors, and these ellipsoids tend to be prolate (e.g. Bett et al., 2007), while voids are expected to be closer to spherical (see the argument in Sheth & van de Weygaert 2004). Figure 7 shows an example classification of the cosmic web in an N-body simulation.
| structure | λ1 | λ2 | λ3 |
| clusters/knots | + | + | + |
| filaments | - | + | + |
| sheets/walls | - | - | + |
| voids | - | - | - |
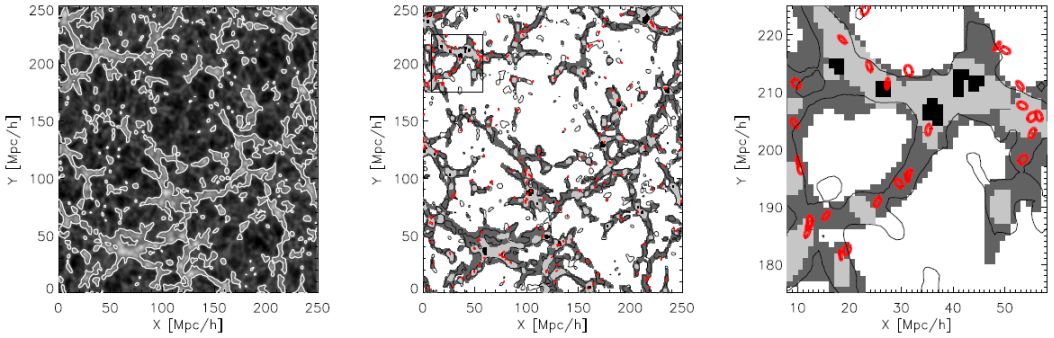 |
Figure 7. Slice of thickness ∼ 1 Mpc / h from the Bolshoi simulation. Left: Dark matter density, with brightness increasing from low to high density. Contours separate regions above and below the mean density. Centre: Cosmic web classification including clusters (black), filaments (dark grey), walls (light grey), and voids (white). Massive haloes are shown in red. Contour lines are the same as in the left panel. Right: Zoom into the region marked in the centre panel. Clusters are marked as red ellipses which indicate the eigendirection and -values of the inertia tensor. Note that the sizes of the ellipses are not representative of the halo sizes. Reproduced with permission from Libeskind et al., (2013). |
Observationally, these structures are difficult to identify. Candidates for galaxy clusters can be obtained from apparent overdensities in the galaxy distribution and then be confirmed if redshift information is available to place the cluster member galaxies at the same distance, or if the candidates cluster in a region of a colour-magnitude diagram known as the red sequence, where the typically early-type cluster member galaxies are expected to lie (e.g. Rykoff et al., 2014). Evans & Bridle (2009) provided observational evidence, using the stacked weak lensing signal of galaxy clusters compiled from SDSS data, that the distribution of cluster members is indeed a good tracer of both ellipticity and orientation of the underlying dark matter halo. Besides, the hot intra-cluster gas leaves clear signatures in X-ray maps and in observations of the cosmic microwave background whose photons are inverse Compton-scattered by the gas (the Sunyaev-Zeldovich effect; see Planck Collaboration et al., 2015b). While such observations are valuable for cluster detection, they have not been used widely for studies of cluster shapes and alignments (see eg. Chambers et al., 2000, 2002). Filaments and, to a lesser degree, sheets are traced by the galaxy distribution and can thus be identified from spectroscopic galaxy surveys, which have a dense sample of galaxies with accurate redshifts and cover a large volume (e.g. Alpaslan et al., 2014). Using the same datasets, voids have often been approximated as the largest spherical regions devoid of galaxies above a certain brightness threshold (e.g. Trujillo et al., 2006). More sophisticated methods for void identification and characterisation now exist (e.g. Sutter et al., 2014), but have not been used in the context of galaxy alignment studies yet.
5.1. Alignments between galaxy clusters
The relative ease with which massive galaxy clusters could be identified has led to a comparatively early advent of observational data on cluster alignments; see Section 3.4. Since then there has been general consensus that the shapes of galaxy clusters are aligned with each other, and even more strongly with the large-scale matter distribution as e.g. traced by neighbouring clusters. Hopkins et al., (2005) used N-body simulations with a box size of 1.5 Gpc / h to study the alignments between the position angles of pairs of haloes, and between the position angle of one halo and the line connecting to another halo, with haloes of mass 2 × 10¹³ M⊙ / h and above. They established that these alignments are stronger and extend to larger pair separations if the haloes have higher mass, and if they are at higher redshift. By also considering the alignment signals shortly after the formation of haloes, Hopkins et al., (2005) deduced the following picture: haloes are endowed with alignments at the time of their formation, with little dependence on formation time and initial mass. They grow via hierarchical structure formation, where major merger events lead to a period of rapid decrease in coherent long-range alignment over a redshift range suggested to be 0.5 to 1. Outside these periods the alignment strengths decrease only slightly. Since low-mass haloes tend to undergo this process earlier, they reached a level of weak alignments in the past, whereas rich galaxy clusters have acquired their mass only recently and thus still have stronger alignments. Kasun & Evrard (2005) obtained very similar results with another large N-body simulation and using the same statistics, while Lee et al., (2008) confirmed the scalings with redshift and mass also for correlations that involve the full halo ellipticity (as opposed to just orientation), using weak lensing-like statistics.
Ragone-Figueroa & Plionis (2007) additionally considered in their simulations the dependence of the alignment signal on the amount of substructure within haloes, which they interpreted as a sign of recent merging activity. Haloes without substructure displayed significantly stronger alignments than those with substructure, which may support the scenario drawn up by Hopkins et al., (2005) that structure growth tends to destroy alignments. However, since subhaloes preferentially fall into the cluster along the filaments, they are expected to introduce a memory of the surrounding large-scale matter distribution into the halo, so the loss of alignment could be a transient state shortly after a merger (Ragone-Figueroa & Plionis 2007). An important caveat is that the mass resolution of the simulation, the exact definition of a halo and the particles that are assigned to it, as well as the radius out to which particles are included (as the inner and outer part of haloes can be misaligned) all have a strong impact on the strength of alignment correlations (Bett et al., 2007, Schneider et al., 2012).
Recent observations, all using SDSS data but different compilations of galaxy clusters and groups, also found significant detections of alignments, in good qualitative agreement with the theory, as did the earlier works by West (1989) and Plionis (1994) albeit with large error bars; see Figure 8. The figure also demonstrates that the prediction by the linear alignment model for this statistic is in good agreement with observations and simulations, which suggests that the haloes of clusters are subject to the same alignment mechanism as elliptical galaxies and their lower-mass haloes. Alignments between clusters and surrounding cluster and galaxy positions were seen out to 20 Mpc / h by Paz et al., (2011) and out to 100 Mpc / h by Smargon et al., (2012), while the latter work also made a tentative detection of pairwise correlations between cluster orientations. Wang et al., (2009) measured various alignment statistics down to group scales with masses as low as 1011.5 M⊙ / h, including an alignment of the shape of the distribution of cluster members with nearest neighbour direction. They, and Paz et al., (2011), confirmed that the alignment signal increases with object mass, while none of the studies had a sufficient redshift baseline to test for a redshift dependence. Paz et al., (2011) even obtained excellent quantitative agreement with their own simulations that contained the angular and radial selection functions of the data and were processed in the same way as the observations. Smargon et al., (2012), in contrast, found that the simulations by Hopkins et al., (2005) over-predict their signals, although they also incorporated observational complications, for instance due to photometric redshift errors and scatter due to the fact that they could typically use only 5-6 galaxies per cluster for estimating the position angle.
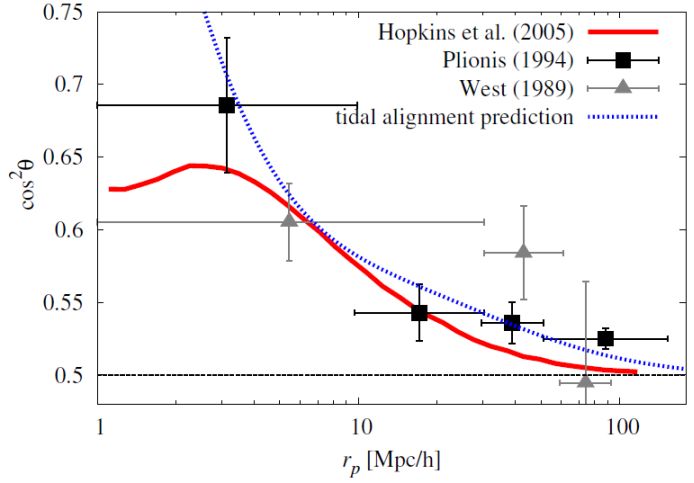 |
Figure 8. Mean of cos2 θ, where θ is the angle between the major axis of a galaxy cluster and the line connecting it to another cluster in projection onto the sky, as a function of transverse galaxy cluster pair separation rp. Data from West (1989) and Plionis (1994) are shown as grey triangles and black squares, respectively, while the simulation results from Hopkins et al., (2005) are given by the red solid line. The blue dotted curve corresponds to the tidal alignment prediction based on Equation (17), assuming a mean ellipticity of 0.22 (after conversion to the definition of ellipticity used in this work) read off from Fig. 3 of Hopkins et al., (2005) and a cluster bias of 2 (Mana et al., 2013). This prediction cannot be trusted below ∼ 5 Mpc / h as the assumption of linear biasing breaks down. Adapted from Hopkins et al., (2005). |
5.2. Alignments with filaments
The growing body of literature using N-body simulations to study the alignments of dark matter halo shapes and spins with the filamentary structures of the cosmic web points towards an at least qualitatively consistent picture, which is sketched in Figure 9, assuming that disc galaxy alignments are driven by spin, and that elliptical galaxy alignments are well described in terms of the major axis orientation. Galaxy-size haloes tend to have their angular momenta aligned parallel to filaments (e.g. Hahn et al., 2007b, Zhang et al., 2009, Libeskind et al., 2013). As we move to larger halo masses, an inversion occurs in the alignment signal with respect to filaments, whereby the halo angular momentum preferentially aligns perpendicular to the filament direction; see e.g. Libeskind et al., (2013). These authors also noted that the mass at which the angular momentum alignment flip happens with respect to filaments is dependent on the halo environment, suggesting that the origin of this transition is linked to the interaction of haloes with the cosmic web, while earlier works claimed a connection to the qualitatively different merger histories of the haloes above and below the transition mass (Codis et al., 2012).
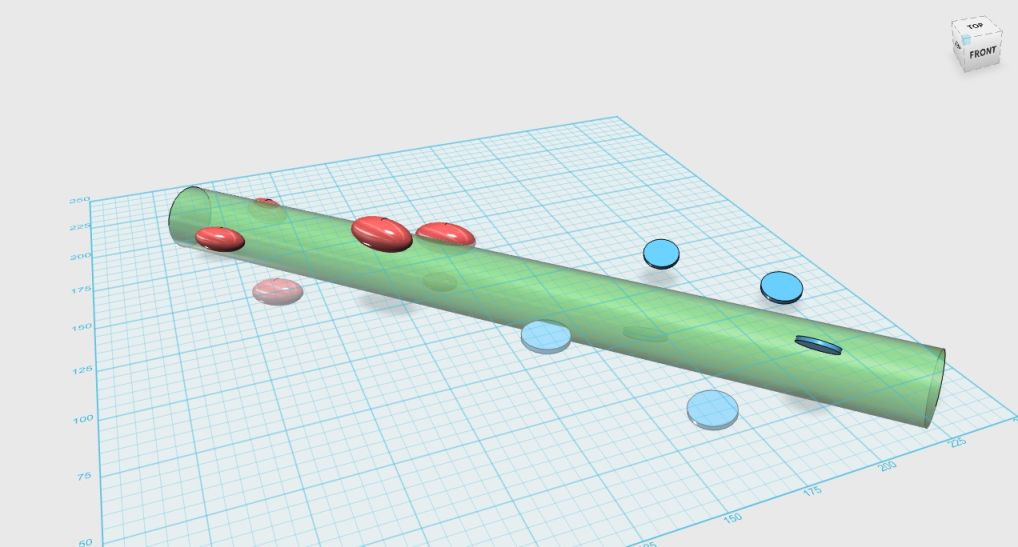 |
Figure 9. Sketch of galaxy alignments with a filament (shown in green). Elliptical galaxies (red ellipsoids) tend to align their major axes with the filament direction, while disc galaxies (blue discs) tend to align their spin perpendicular to the filament direction. Note that the latter alignment trend only holds for massive objects; see Section 5.2 for details. |
There appears to be less consensus in observations, however. Lee & Pen (2002) studied alignments in the IRAS Point Source Catalogue Redshift survey (PSCz), and found that the galaxy spin typically aligned perpendicular to filaments. On the other hand, Tempel et al., (2013) observed a parallel alignment between the spins of bright spiral galaxies and filaments, while early-type (mostly lenticular) galaxies had their spins aligned perpendicular to the filament direction. Tempel & Libeskind, (2013) supported the findings of Tempel et al., (2013) in relation to spiral galaxies, whereas Zhang et al., (2015) found a perpendicular alignment between the spin axes of spiral galaxies and the filament direction. All recent works used SDSS data but differed in the selection of the galaxy samples and in the definition and reconstruction of filaments. While this is a likely explanation for the apparently discrepant results, physical effects related to the differences in the alignments of low- and high-mass haloes and the dependence of the mass scale of the spin alignment transition on environment may also have an impact. In particular, the findings of Tempel et al., (2013) of a different alignment signal in spiral galaxies compared to early-type galaxies could reflect the fact that the latter tend to be more massive than their spiral counterparts. And while Zhang et al., (2015) find a perpendicular alignment signal with spiral galaxies, they note that this signal is stronger in cluster environments, perhaps pointing to a lower mass threshold for the spin alignment flip in higher density environments. However, such a scenario would be in conflict with the results of Libeskind et al., (2013), who found that the spin flip mass threshold was higher in clusters compared with voids.
Considering the shapes of dark matter haloes in N-body simulations, the halo major axis preferentially lies along the direction of filaments on all mass scales (Bailin & Steinmetz, 2005, Altay et al., 2006, Lee et al., 2008, Zhang et al., 2009, Libeskind et al., 2013). Using observations, Zhang et al., (2013) confirmed the prediction from simulations, finding a strong alignment signal for red galaxies and a weaker signal for blue galaxies. This could reflect the mass dependence of the strength of the alignment signal seen in N-body simulations, as red galaxies tend to be older and more massive than blue galaxies.
5.3. Alignments with sheets and void surfaces
As voids by definition lack sufficiently bright galaxies suitable for shape measurement, observational analyses deal with the alignments of galaxies in loosely defined regions at the surfaces of voids. These environments should in principle be equivalent to the sheet category defined above, but the practical algorithms to identify them are substantially different. There have been three recent works (Trujillo et al., 2006, Slosar & White, 2009, Varela et al., 2012) in this area which all employed the same void finder (by Patiri et al., 2006), searching for the largest non-overlapping spheres within the survey volume that is devoid of galaxies above a certain brightness threshold. They all worked with SDSS data (from data releases 3, 6, and 7, respectively; Trujillo et al., 2006 additionally considered data from the 2dF Galaxy Redshift Survey) and defined similar rest-frame magnitude thresholds just below Mr = −20. Substantial differences prevailed in the selection of the galaxy samples used for the estimation of the spin direction, and the measurement process for the latter, with Trujillo et al., (2006) limiting themselves to edge-on and face-on disc galaxies only, while Varela et al., (2012) fitted a thick-disc model to all galaxies classified as spirals by GalaxyZoo (Lintott et al., 2008).
Results for the distribution of the angle between the galaxy spin vector and the vector connecting the void centre with the position of the galaxy from these three papers are compared in Figure 10 for the choice of minimum void radius of 10 Mpc / h and a shell 4 Mpc / h thick at the void boundary in which the alignments are measured. The data were fitted to Equation (23) with the free parameter aT which encodes a combination of the effects of the primordial coupling between tidal shear tensor and inertia tensor of the forming galaxy, as well as the degree of non-linear and stochastic effects acting on the galaxy spin after galaxy formation. A value of aT = 0.6 is expected for the tidal torque theory prediction with independent tidal and inertia tensors, while aT = 0 corresponds to random spin vectors, and the distribution reduces to be proportional to sinθ. Trujillo et al., (2006) claimed a strong detection conformal with tidal torque theory, but the significance was reduced to less than 2σ in a re-analysis by Varela et al., (2012) as the original measurements were selected a posteriori to yield a maximum signal-to-noise. With a more homogeneous dataset and a somewhat more sophisticated analysis, Slosar & White (2009) and Varela et al., (2012) agreed on a null detection.
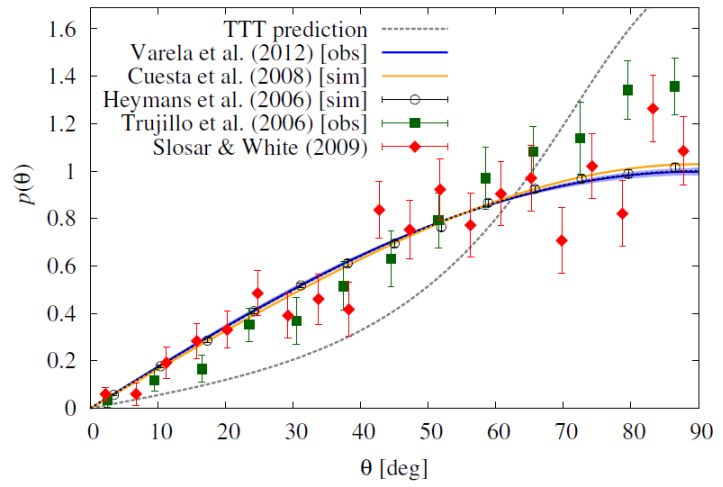 |
Figure 10. Probability density of the angle, θ, between the galaxy spin vector and the vector connecting the void centre with the position of the galaxy. For random galaxy orientations one expects a sin(θ) dependence, as marked by the black dotted line (which almost completely overlaps with the blue line). Note that all distributions integrate to unity over the angular range shown in the figure. Signals and 1σ constraints are shown for the case of void radii larger than 10 Mpc / h, and a shell width at the surface of 4 Mpc / h thickness, from the observations by Trujillo et al., (2006) (green squares), Slosar & White, (2009) (red diamonds), and Varela et al., (2012) (blue line and error band), and the simulations by Heymans et al., (2006a) (black circles) and Cuesta et al., 2008 (yellow line and error band). The grey dashed line corresponds to the prediction by tidal torque theory (TTT) with aT = 0.6. |
However, Varela et al., (2012) considered a range of void radii and found a significant signal for minimum void radii around 15 Mpc / h which corresponds to negative values of aT ≈ −0.5. This result is in disagreement with the standard picture of tidal torque theory (Lee & Pen 2000, 2001; Lee & Erdogdu 2007) which posits a preferential alignment of the spin vector with the intermediate principal axis of the tidal shear tensor which lies tangentially to the void surface, whereas Varela et al., (2012) found an alignment of the spin with the radius vector. Simulations which explicitly attempted to reproduce the void alignment signals found either no signal or a very small signal (Figure 10). While Heymans et al., (2006a) employed a thick-disc galaxy model oriented with some random misalignment around the halo angular momentum vector, Brunino et al., (2007) and Cuesta et al., (2008) did not use any galaxy model but studied angular momentum alignments directly, so that the link to observations is less clear in these cases. In this respect it is interesting to note that the significant detection by Cuesta et al., (2008) was lost when limiting the angular momentum measurement to the central part of a halo.
The observational picture for the case of alignments of galaxy spins with sheets as defined in Table 1 remains unclear. Lee & Pen (2002) and Lee & Erdogdu (2007) concluded from observations still based on photographic plate data that galaxy spin axes tend to lie within the sheets, while with SDSS, Tempel & Libeskind (2013) and Zhang et al., (2015) found galaxy angular momenta to point perpendicular to the plane of the sheet on average, although in both cases the alignment signal was weak. This appears to be consistent with the void result of Varela et al., (2012), whereas simulations generally agree that angular momenta are preferentially parallel to planar structures (e.g. Libeskind et al., 2013), i.e. (aT > 0), and this tendency becomes stronger for more massive haloes (e.g. Forero-Romero et al., 2014).
We lack observations for the alignments of halo shapes (as opposed to spins) with void structures because the objects we consider as faithful tracers of halo shape, elliptical galaxies and galaxy groups or clusters, are rare in the under-dense regions close to voids. Zhang et al., (2013) found that galaxy major axes tend to lie within the sheets. This is in agreement with N-body simulations for which there is clear consensus that the major axes of haloes lie parallel to the sheet or the surface of the void, with a clear trend towards stronger alignments for more massive haloes (Brunino et al., 2007, Zhang et al., 2009, Cuesta et al., 2008, Forero-Romero et al., 2014). All in all, while observational evidence is inconclusive and possibly still affected by selection effects and systematic measurement errors, at least numerical studies agree on a general picture for alignment tendencies of halo spins and shapes with respect to planar structures of the cosmic web that is illustrated in Figure 11, neglecting any misalignments between the observable galaxies and their dark matter counterparts.
 |
Figure 11. Sketch of galaxy alignments at the surface of a void (shown in green). Elliptical galaxies (red ellipsoids) tend to align their major axes perpendicular to the radius vector from the centre of the void, while disc galaxies (blue discs) tend to align their spin along this direction. |