


Since the launch of Chandra, many cold fronts have been discovered in galaxies, galaxy groups, and galaxy clusters. In this section we provide an overview of recent X-ray observations of nearby cold fronts that are most relevant to the question of constraining the properties of the cluster plasma. We will first discuss examples of remnant core cold fronts, followed by sloshing cold fronts.
An excellent example of a remmant-core cold front is found in the elliptical galaxy NGC 1404 (Figure 1), which is falling toward the galaxy NGC 1399 at the center of the Fornax cluster. Its gas tail, seen already in ROSAT data (Jones et al. 1997, Paolillo et al. 2002) shows that the galaxy is undergoing ram-pressure stripping. Early Chandra observations revealed a sharp leading edge (Dosaj et al. 2002, Scharf et al. 2005, Machacek et al. 2005), and recent deep Chandra observations will allow the width of the remnant core cold front to be measured in several wedges from the stagnation point towards the sides (Su et al., in prep.).
Using stripped galaxies or groups as probes for ICM plasma properties can be complicated by a variety of additional processes superimposed on the infall and stripping, such as central AGN activity as in e.g., M89 (Machacek et al. 2006), a strongly elliptical potential and interactions with other galaxies as in M86 (Randall et al. 2008), or an early stage of infall as for the stripped groups observed in A2142 (Eckert et al. 2014) and A85 (Ichinohe et al. 2015). None of these complications apply to NGC 1404, making it a particularly clean probe of ICM plasma properties.
Another nearby example of a remnant core cold front is in the merging cluster A3667 (Figure 3). Line-of-sight velocity measurements of the cluster galaxies show no evidence for multiple components in redshift space, indicating that A3667 is a merger occurin in the plane of the sky (Johnston-Hollitt et al. 2008, Owers et al. 2009). A surface brightness edge in the ICM was identified already in ROSAT and ASCA observations (Knopp et al. 1996, Markevitch et al. 1998, Markevitch et al. 1999), but only Chandra data had the sufficient resolution to allow the edge to be identified as a cold front (Vikhlinin et al. 2001b).
 |
Figure 3. Chandra observation of the cold front in A3667 (from a longer exposure than Vikhlinin et al. 2001b, ∼ 500 ks). Left: X-ray surface brightness image. The cold front is the sharp edge feature to the SE. Right: X-ray surface brightness profile of the cold front. The blue line shows the best-fit projected spherical density discontinuity, with an infinitely small width. The red line shows the same model smoothed with a Gaussian of width σ = 13 kpc, corresponding to the collisional mean free path λin−out, which is inconsistent with the data (Reproduced from MV07). |
Due to the high spatial resolution of the Chandra data, Vikhlinin et al. (2001b) were able to show that the surface brightness profiles across the edge were well fit by a projected density discontinuity. They measured an upper limit on the width of the front interface of ∼ 4 kpc, which is comparable to or smaller than the particle mean free paths on both sides of the cold front, and of those particles moving across the interface (Vikhlinin et al. 2001b). Particle diffusion across the interface proceeds mostly from the inside of the front (i.e., the denser side) to the outside, since the particle flux through the unit area is proportional to nT1/2. Therefore, the most relevant mean free path to consider is λin→out (Spitzer 1962, Vikhlinin et al. 2001b):
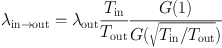 |
(1) |
where G(x) = [Φ(x) − xΦ′(x)] / 2x2 and Φ(x) is the error function. For the cold front in A3667, λin→out ≈ 10 − 13 kpc (MV07). If Coloumb diffusion is not suppressed across the interface, the front width should be at least several times λin→out, yet this is not the case (Figure 3), implying that there is a mechanism for such suppression. More recently, Datta et al. (2014) estimated a larger width for the cold front of ΔR = 24 ± 12 kpc, but their estimate appears to neglect the fact that the projected X-ray emissivity a zero-width density jump superficially appears as a surface brightness jump with a finite width. Nevertheless, even with this larger estimate for the width, they were still able to conclude that particle diffusion and thermal conductivity must be strongly suppressed across the interface.
The front surface itself appears very smooth, lacking evidence of pertubations within an angular sector of φ ≈ 30∘ from the direction of the front motion. Outside of this sector, the front becomes less sharp and eventually blends in with the surrounding emission. However, such an interface should be susceptible to the effects of KHI even closer to the axis defined by the direction of motion than this. Vikhlinin & Markevitch (2002) determined that perturbations with wavelengths of ≈ 20-30 kpc would be unstable across the front surface even if the stabilizing effect of the cluster’s gravity is taken into account. However, Churazov & Inogamov (2004) argued that the upstream part of a remnant core cold front could be stable to the KHI if the front has a small initial intrinsic width. Mazotta et al. (2002) pointed out that the sides of the remnant core in A3667 show a ragged appearance which may indeed be due to the KHIs expected at this location.
Assuming that the front is stabilized against KHI by a magnetic field layer, Vikhlinin et al. (2001a), Vikhlinin & Markevitch (2002) estimated the minimum magnetic field strength that would be required to suppress KHI at small angles from the direction of the front’s motion. They determined that the tangential magnetic field strength at the front surface must be within 6 µG < B < 14 µG, which though likely stronger than in most regions of the cluster is still only a small fraction of the thermal pressure, with pm / pth ∼ 0.1 − 0.2. Together with the observed sharpness of the front, this is powerful indirect evidence for a magnetic field draping layer at the cold front in A3667.
Cold fronts were first discovered by Markevitch et al. (2000) in A2142. They identified two arc-shaped fronts on opposite sides of the cluster core (Figure 4). They first proposed that the edges arose from dense subcluster cores which were ram-pressure stripped during a cluster merger–in other words, remnant-core cold fronts. As more cold fronts wrapped around the cores of other clusters were found, it became clear that the cold fronts in A2142 are of the sloshing type (MV07). Rossetti et al. (2013) reported another cold front ∼1 Mpc to the SE, suggesting that sloshing extends to large scales beyond the core region. The hypothesis of sloshing triggered by a minor merger is supported by the observations of Owers et al. (2011), who identified substructures in the galaxy distribution and their kinematics in A2142 which are candidates for the perturbing subclusters which initiate the sloshing motions.
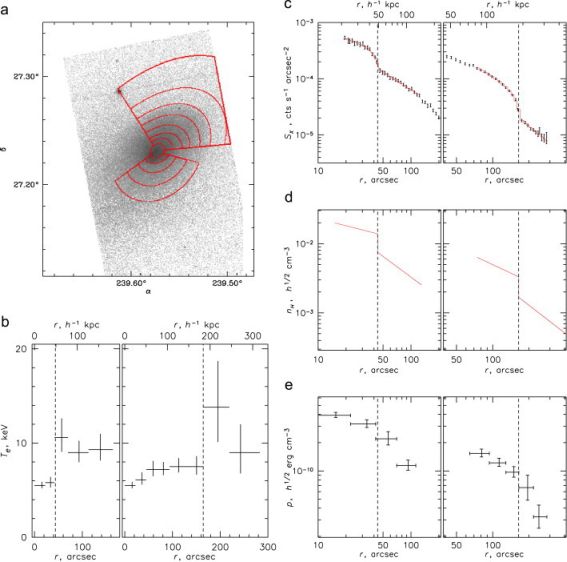 |
Figure 4. Analysis of cold fronts discoverd in A2142 by Markevitch et al. (2000). Panel (a): X-ray image with red regions overlaid showing the regions used for derivation of the temperature profiles shown in panel (b). Panels (b-e) show the profiles of temperature, surface brightness, density, and pressure across the southern (left) and northwestern (right) edges. Vertical dashed lines show the positions of density jumps. Reproduced from MV07. |
Ettori & Fabian (2000) noted that the existence of the sharp temperature discontinuities in the A2142 cold fronts indicated that heat flux across the interface must be suppressed by a factor of ∼ 250-2500, since otherwise they would have been smeared out by thermal conduction on a very short timescale. This was the first indication that cold fronts may be used to constrain transport processes in the ICM.
The very nearby Virgo cluster of galaxies (with its central galaxy M87) possesses a pair of sloshing cold fronts (Figure 5, Simionescu et al. 2007, Simionescu et al. 2010). At a distance of only 16.1 Mpc (Tonry et al. 2001), the arcsecond resolution of Chandra corresponds to a projected spatial resolution of 78 pc, making the Virgo cold fronts an ideal target to study cold fronts at the highest resolution. In a recent 500 ks Chandra observation focused on the northern Virgo cold front, Werner et al. (2016) measured the width of the interface at a number of locations along the front surface. In the northwestern part of the front, which appears to be the sharpest, they found an upper limit on the width of the interface to be ∼ 2.5 kpc at 99% confidence level, which is approximately 1.5 times the local Coulomb mean free path λin→out for particles diffusing across the interface. In the northern part of the front, the upper limit on the width is found to be somewhat wider, ∼ 4.3 kpc. They argued that at this location the front may be smeared by the effects of KHI, as had been suggested by the Virgo cluster simulations of Roediger et al. (2013a, hereafter R13; see Section 3.4). In several locations, narrow-wedge surface brightness profiles across the Virgo cold front display a multi-step structure, a signature for the presence of KHIs, predicted by R13 from mock observations of their simulations. In either case, the Virgo cold front width is much narrower than would be expected if particle diffusion across the front were unsuppressed, which would smooth the front by several λin→out. They also argued from these estimates that thermal conduction is also highly suppressed across the cold front surface.
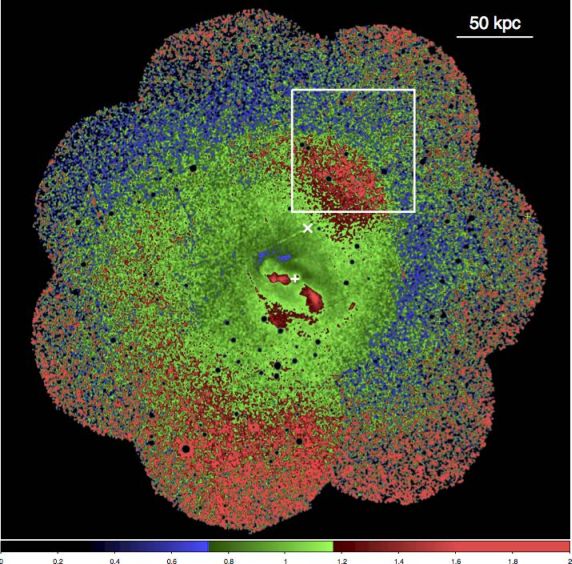 |
Figure 5. XMM-Newton EPIC/MOS mosaic image of the central r ∼ 150 kpc region of the Virgo cluster (Simionescu et al. 2010). The white square indicates the Chandra ACIS-I pointing of Werner et al. (2016) shown in Figure 6. Reproduced from Werner et al. (2016). |
These observations also revealed a somewhat unexpected feature associated with the cold front. The residual image in the right panel of Figure 6 shows the presence of three X-ray bright quasi-linear features, extending away from the front surface at an angle which roughly aligns them with the direction of the curvature of the front to the southwest. The features are separated from each other by ∼15 kpc in projection, and are not associated with any instrumental artifacts (e.g., chip gaps or readout streaks). Therefore, these features correspond to density enhancements underneath the cold front seen in projection. Werner et al. (2016) argued for an origin of these features that was related to magnetic fields, a possibility we discuss in Section 3.3.
 |
Figure 6. Left panel: Chandra image of the Virgo cold front in the 0.8–4.0 keV energy band from Werner et al. (2016). The image was smoothed with a Gaussian function with a 1.5 arcsec window. Right panel: The residual image, which reveals three X-ray bright quasi-linear features separated from each other by ∼15 kpc in projection. The dark band outside the cold front is an image processing artifact due to the sharp surface brightness discontinuity. |
The galaxy groups around the elliptical galaxies NGC 7618 and UGC 12491 show classic spiral-shaped sloshing cold fronts, arising from their recent mutual encounter (Kraft et al. 2006). However, the cold fronts in these groups are not as smooth as in, e.g., A2142, but display distortions in the form of noses and wings (Figure 7, Roediger et al. (2012a)), that resemble the appearance of KHIs as seen in simulations. Cold fronts with similar features exist also in A496 (Dupke et al. 2007, R12).
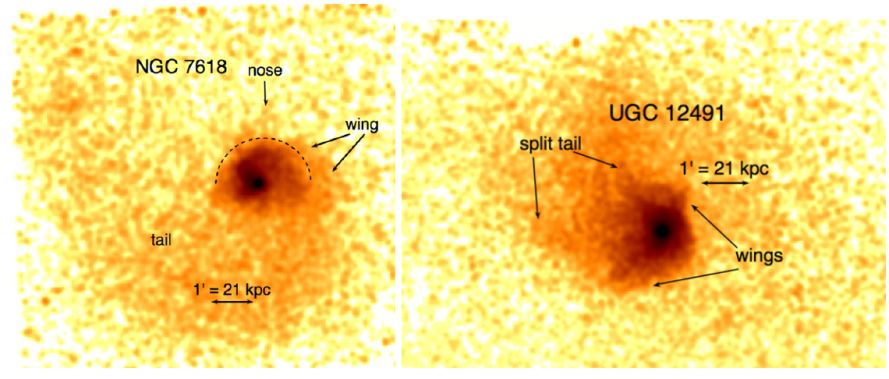 |
Figure 7. The two galaxy groups around NGC 7618 (left) and UGC 12491 (right) passed each other a few 100 Myr ago, and caused sloshing in each other's ICM atmospheres. The spiral-shaped cold fronts wrapped around each group center show distortions in the form of wings and noses, resembling KHIs. Reproduced from Roediger et al. 2012a. |