


A main channel to obtain the DM properties in galaxies is through their kinematics (rotation curves and dispersion velocities). The analysis could regard individual objects or stacked data of a sample of objects.
7.1. The Tully–Fisher and the Baryonic Tully–Fisher
Tully and Fisher (1977) discovered that, in spirals, the neutral hydrogen 21-cm FHWM linewidths w50, related, in a disk system, to the maximal rotational velocities Vmax by: logVmax ≃ −0.3 + logw50 −log sini, with i the inclination of the galaxy with respect to the l.o.s., correlate with the galaxy magnitudes M
 |
(37) |
where a is the slope of the relationship and b the zero-point.
With the availability of a large number of extended RCs, the relation evolved: a radius proportional to the disk length-scale RD (e.g. Ropt or Rmax = 2.2 RD) emerged as the reference radius; moreover, the circular velocity at this reference radius substituted the linewidth w.
It is easy to realize that Eq. 37 just reflects the equilibrium configuration of rotating disks embedded in dark halos (Strauss and Willick 1995) and that the magnitude M in the relation is the prior for the stellar disk mass. However, it is worth going deeper: in fact, despite that in each spiral the disk and the dark components contribute in different proportions to the value of V(Ropt) = (Vd(Ropt)2 + Vh(Ropt)2)1/2, one finds that Vd(Ropt) correlates better with magnitudes than V(Ropt) (Salucci et al. 1993). This finding can be understood in that the latter relationship couples two attributes that pertain exclusively to the stellar disk: its mass, measured kinematically and its luminosity.
The physical meaning of the TF relation as a link between circular velocities and stellar masses has been shown by means of 729 kinematically and morphologically different galaxies belonging to the SAMI Galaxy Survey sample (Bloom et al. 2017). It has been found:
 |
(38) |
with V2.2 ≡ V(2.2 RD). Such relationship results in very good agreement with the correspondent one we can derive from the URC (Salucci et al. 2007): logV2.2 = (0.263 ± 0.005) log(M⋆ / M⊙) − (0.57 ± 0.05).
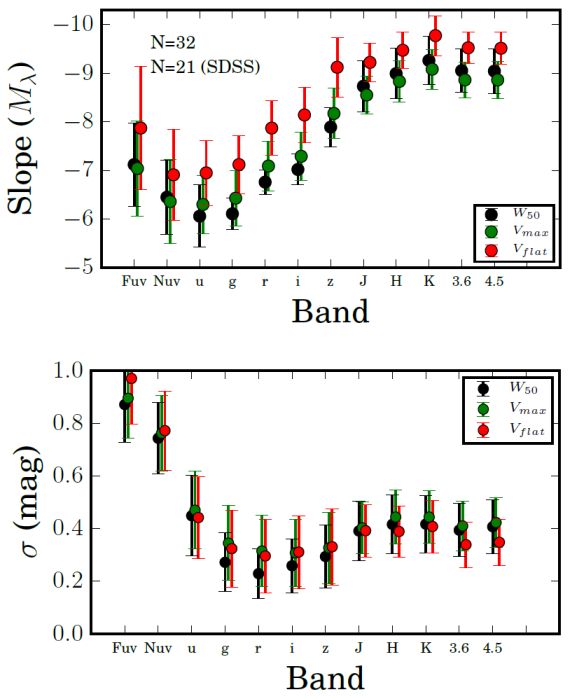 |
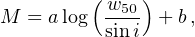
Figure 8. The slope and the scatter of the TF relation by adopting different reference velocities and different systems of magnitude. |
A recent work (Ponomareva et al. 2018) has investigated the statistical properties of the Tully–Fisher relation for a sample of 32 galaxies with accurately measured distances and with 1) panchromatic photometry in 12 bands: from far ultra-violet to 4.5 µm, and 2) spatially resolved HI kinematics. For this sample they adopted, in turn, the following reference velocities: the linewidth W50, the maximum velocity Vmax and Vflat the average value of the RC in the range (2–5) RD. With these quantities they constructed 36 correlations, each of them involving one magnitude and one kinematical parameter. They found that the slope of the relationships strongly depends on the band considered and that the tightest correlation occurs between the 3.6 µm photometric band magnitude M3.6 µm and Vflat (see Fig. 8):
 |
(39) |
in good agreement with the value of 8.6 ± 0.1 found by Yegorova and Salucci (2007) for the slope of the I magnitude of the radial Tully–Fisher relationship at R = 1.2 Ropt that becomes 9.6 ± 0.3 when translated in the 3.6 µm band.
7.2. The Baryonic Tully–Fisher
McGaugh et al. (2000) found a fundamental relationship by correlating the baryonic mass (i.e., the sum of the stellar and the (HI + He) gas mass) with the reference rotation velocity Vflat. This Baryonic Tully–Fisher (BTF) relation has been thorough fully studied and confirmed by several works: (e.g., Bell and de Jong 2001, Verheijen 2001, Gurovich et al. 2004). A decisive step forward in understanding it came from McGaugh (2005), who investigated a sample of galaxies with extended 21-cm rotation curves spanning the range 20 km s−1 < Vflat < 300 km s−1. By using a grid of stellar population models they estimated the values of the stellar disks masses to which they added those of the HI disks derived by the observed 21-cm HI fluxes. They found:
 |
(40) |
(see Fig. 9). Notice that, by including the HI mass in the galaxy baryonic mass, the BTF becomes log-log linear and has less intrinsic scatter.
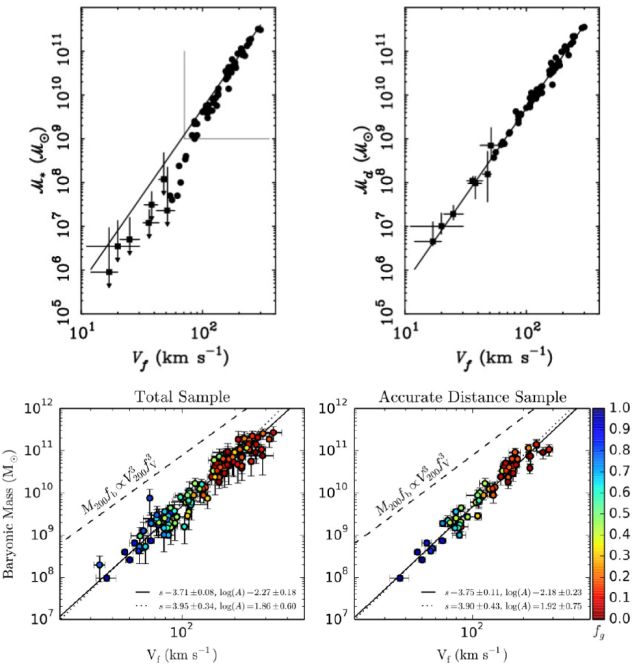 |
Figure 9. (top) The stellar mass (left) and baryonic (right) Tully–Fisher relations. (bottom) The determination of the BTF. Images reproduced with permission from [top] McGaugh (2005), and [bottom] from Lelli et al. (2016a), copyright by AAS. |
Lelli et al. (2016a) investigated the BTF relationship with a sample of 118 disc galaxies (spirals and irregulars) with data of the highest quality: extended HI high quality rotation curves tracing the total mass distribution and Spitzer photometry at 3.6 µm tracing the stellar mass distribution. They assumed the stellar mass-to-light ratio (M⋆ / L3.6 µm) to be constant among spirals and found that the scatter, slope, and normalization of the relation vary with the adopted M⋆ / L3.6 µm value, though the intrinsic scatter is always modest: ≤ 0.1 dex. The BTF relationship gets minimized for M⋆ / L3.6 µm > 0.5. This result, in conjunction with the RC profiles of the galaxies in the sample, implies maximal discs in the high-surface-brightness. 5
The BTF relationship slope comes close to 4.0, see Fig. 9 (bottom) and the residuals show no correlation with the galaxy structural parameters (radius or surface brightness). The above relationship seems to play an important cosmological role, however, the value of its slope strongly depends on the vagueness in the definition of the reference velocity Vflat (Brook et al. 2016). The DM enters in this relation principally through the value of the dark/ total matter fraction at Rflat: this indicates that the BTF is related more to the disk formation process than to the DM nature.
7.3. The universal rotation curve and the radial Tully–Fisher
We can represent all the rotation curves of spirals by means of the universal rotation curve (URC), pioneered in Rubin et al. (1980), expressed in Persic and Salucci (1991) and set in Persic, Salucci and Stel (1996) and in Salucci et al. (2007). By adopting the normalized radial coordinate x ≡ r / Ropt, the RCs of spirals are very well described by a universal profile, function of x and of λ, where λ is one, at choice, among MI, the I magnitude, MD, the disk mass and Mvir, the halo virial mass (Salucci et al. 2007).
The universal magnitude-dependent profile is evident in the 11 coadded rotation curves Vcoadd(x, MI) (Fig. 6 of Persic, Salucci and Stel 1996 and top of Fig. 11), built from the individual RCs of a sample of 967 spirals with luminosities spanning their whole I-band range: −16.3 < MI < −23.4. I-band surface photometry measurements provided these objects with their stellar disk length scales RD (Persic and Salucci 1995). 6
The coadded RCs are built in a three-step way: 1) We start with a large sample of galaxies with RC and suitable photometry (in the case of Persic, Salucci and Stel 1996: 967 objects and suitable I-band measurements). The whole (I) magnitude range is divided in 11 successive bins centred at MI, as listed in Table 1 of Persic, Salucci and Stel (1996). 2) The RC of each galaxy of the sample is assigned to its corresponding I magnitude bin, normalized by its V(Ropt) value and then expressed in terms of its normalized radial coordinate x . 3) The double-normalized RCs V(x) / Vopt curves are coadded in 11 magnitude bins and in 20 radial bins of length 0.1 and then averaged to get: Vcoadd(x, MI) / Vcoadd(1, MI), the points with errorbars in Fig. 11. The 11 values of Vcoadd(1, MI) are given in Table 1 of Persic, Salucci and Stel (1996). The RCs are usually increasing or decreasing. Simplifying, they increase when they are dark matter dominated or always for r < RD and decrease for r > 2 RD when they are disk dominated. 7 The recent finding of RCs of six massive star-forming galaxies that, outside Ropt, decrease with radius (Genzel et al. 2017) has been considered very surprising. Rightly, it has been proposed that this trend arises because this high-redshift galaxy population was strongly baryon dominated. However, while the importance of such objects in the cosmological context is obvious, there is a presence, also in the local Universe, of many baryon dominated decreasing RCs. This was first drawn to the attention by Persic and Salucci (1991) and, moreover, it is inbuilt in the URC.
The URC is the analytical function devised to fit the stacked/coadded RCs Vcoadd(x, MI). In principle, it could be any suitable empirical function of (x, MI), the idea of Persic, Salucci and Stel (1996) was to choose, as fitting function, the sum in quadrature of the velocity components to the circular velocity. Namely, the Freeman stellar disk with one free parameter, its mass MD and the dark halo with an assumed profile and two free parameters, the central density ρ0 and the core radius r0. Then, the data Vcoadd(x, MI) are fitted by the VURC universal function:
 |
(41) |
The first component of the RHS is the standard Freeman disk of Eq. (8), the second is the B-URC halo of Eq. (34). In dwarf galaxies, a HI term must be included (Karukes and Salucci 2017).
The excellent fit (see Fig. 11) has led us to the validation of the URC idea: there exists a universal function of (normalized) radius and luminosity that well fits the RC of any spiral galaxy (see Salucci et al. 2007). 8
The radial Tully–Fisher is a relationship on the URC surface, orthogonal to the various RCs (Yegorova and Salucci 2007; see Fig. 10 top). At different galactocentric distances, measured in units of the optical size, ri ≡ i Ropt (i = 0.2, 0.3, …, 1), a family of independent Tully–Fisher-like relationships emerges:
 |
(42) |
with Mband the magnitude in a specific band, often the (R, I)-bands. The RTF has a very small r.m.s. scatter, at any radius smaller than that of the classical TF. It also shows a large systematic variation of the slopes ai with ri that range, across the disk, between −4 and −8. This variation, in cooperation with the smallness of the scatter, indicates that the fractional amount of dark matter inside the optical radius is luminosity-dependent (Yegorova and Salucci 2007).
 |
Figure 10. The radial TF. The variation of the slopes ai with ri is very evident. Image reproduced with permission from Yegorova and Salucci (2007), copyright by the authors. |
It is important to stress that, given a sample of RCs, the RTF relationship provides us with an independent method of deriving (if it exists) the underlying coadded RCs and, in turn, the relative URC. Yegorova and Salucci (2007), in fact, have shown that samples with a similar ai vs ri relationship have also similar Vcoadd(x, magnitude). This has been applied to the large samples of Courteau (1997) and Vogt et al. (Vogt et al. 2004a, Vogt et al. b) with the result of finding the same RTF discovered in the Persic, Salucci and Stel (1996) sample (see Fig. 8 of Yegorova and Salucci 2007) and, then, finding very similar coadded RCs.
 |
Figure 11. (top) The URC best-fit models of the coadded RCs (points with errorbars) (Persic, Salucci and Stel 1996). It is shown: the bin magnitude MI, the disk/halo contributions (dotted/dashed lines) and the resulting URC (solid line). (bottom left). The 4-D relationship among the central DM density, its core radius in units of Ropt, the DM fraction at Ropt and the galaxy I-luminosity (proportional to the area of the circles). (bottom right). The URCs from Persic, Salucci and Stel (1996), (yellow) and from Catinella et al. (2006) (blue). Legenda: x ≡ R / RD, y ≡ log(Mvir / (1011 M⊙)), z ≡ V(x) / V(3.2). The differences between the two URCs are also indicated. |
5 Notice that maximal disks are incompatible with cuspy DM halos (van Albada et al. 1985). Back.
6 See also Lapi et al. (2018) for the analysis of 24 coadded RCs obtained from 3500 individual RCs. Back.
7 We stress that only the RCs with 190 km/s < Vopt < 230 km/s and in the radial range 1 RD <R < 4 RD can be considered flattish. Back.
8 In short: the variance of V(x, L) is negligible, i.e., the r.m.s. of the values of the RCs in galaxies of same luminosity L and at the same radius x is negligible. Back.