


The general pattern is the following: spirals show a reference radius RT(LI) whose size ranges from 1 to 3 RD according to the galaxy luminosity (see Fig. 8 of Persic, Salucci and Stel 1996 and Palunas and Williams 2000); inside RT(LI) the ordinary baryonic matter fully accounts for the RC, while, for R > RT(LI), is instead unable to justify the profile and the amplitude of the RC.
8.1. Dark matter from stacked RCs
Very extended individual RCs and virial velocities Vvir ≡ (G Mvir / Rvir)1/2 obtained in Shankar et al. (2006), further support the URC paradigm and help determining the universal velocity function out to the virial radius (Salucci et al. 2007). It is important to stress that the VURC function (and the relative mass model) has, in principle, three free parameters: the disk mass and two quantities related to the DM distribution (the halo central density ρ0 and the core radius r0). These are obtained by best fitting the Vcoadd(x, MI) and found to be correlated among themselves and with the luminosity. So, the RCs and the related gravitational potential of spirals belong to a family ruled by 1-parameter that we can choose among many possibilities, e.g., the halo mass, which is a combination of ρ0 and r0 and it ranges in spirals as: 3 × 10¹⁰ M⊙ ≤ Mvir ≤ 3 × 10¹³ M⊙ .
8.2. Dark matter from individual RCs
The study of individual RCs is very similar to that of the stacked ones as regard to their mass modelling, but it is complementary to it with respect to the data analysis. Moreover, in the core-cusp issue, the individual RCs have a special role: stacked RCs of spirals, as seen in the previous section, points unambiguously to a cored distribution, but cannot indicate to us whether this is a sort of average property of the entire population of spirals or a property of any single object. Only the analysis of fair number of individual RCs of systems of different luminosity and Hubble types can answer to this.
It is worth pointing out that, in the first 15 years since the DM discovery from the profiles of the RCs, the latter have always been reproduced by models including a Freeman disk, a bulge and a dark halo with the cored Pseudo Isothermal distribution (e.g., Carignan and Freeman 1985, van Albada et al. 1985). It is well-known that in the current ΛCDM cosmological scenario the dark matter halos have a very specific and universal cusped density distribution (Navarro et al. 1997]). A debate has arisen on the level of the observational support for such profile (de Blok et al. 2001, Salucci 2001, Gentile et al. 2004, Simon 2005, Spekkens et al. 2005, Kuzio de Naray et al. 2008, de Blok et al. 2008, Oh et al. 2011, Adams et al. 2014 to name a few, reviews on this issue: Bullock and Boylan-Kolchin 2017, de Blok 2010). 9
It is important to remark that the DM cores could come ab initio from the structural properties of the (exotic?) DM particles or been created, over all the Hubble time, by dynamical processes occurring inside the galaxies.
Martinsson et al. (2013) devised and applied to a sample of 30 spirals, a method to decompose the rotation curves in its dark and luminous components. The method exploits the vertical velocity dispersions of the disk stars σz (see Sect. 6.3). By reminding that Rmax ≡ 2.2 RD is the radius where the disk velocity component has its maximum, they found: (Vd(Rmax) / V(Rmax))2 = 0.57 ± 0.07, with a dependence on galaxy luminosity: in their velocity models, at Rmax, the disk component prevails over the dark component in the biggest spirals, while, it is very sub-dominant in the smallest ones.
They also modeled the dark matter halos with either a PI or a NFW profile and found the former distribution performing something better and showing a tight ρ0 vs. r0 relationship, very similar to that found in spirals by means of a different analysis (see Fig. 12).
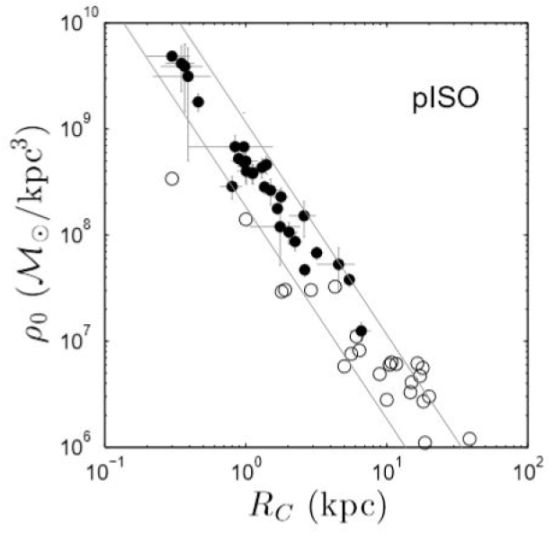 |
Figure 12. The relationship between the size of the DM core radius Rc and the value of the central dark matter density ρ0. Image reproduced with permission from Martinsson et al. (2013), copyright by ESO. |
A recent study of NGC 5005 (Richards et al. 2015) can be considered as a test case investigation of the mass distribution in spirals obtained by means of multi-messenger observations. These included images taken at 3.6 µm from the Spitzer Space Telescope, B and R broadband and Hα narrowband observations. Very Large Array (VLA) radio synthesis observations of neutral hydrogen provided the HI surface density and the kinematics. Spectroscopic integral field unit observations at WIYN 3.5-m telescope provided the ionized gas kinematics in the inner region. The surface brightness has been carefully decomposed in its disk and bulge component. The modelling of the composite high resolution rotation curve clearly favors a PI DM halo, with core radius of 2.5 ± 0.1 kpc, over the corresponding NFW configuration.
Bottema and Pestaña (2015) obtained high resolution kinematics for sample of 12 galaxies, whose luminosities are distributed regularly over a range spanning several orders of magnitude. They found that models with maximum disks, cored DM halos and a unique value of the mass-to-light ratio, i.e. MD / Lr = 1.0, fit very well all the RCs, see Fig. 13. NFW DM halos, independently of the baryonic distribution, cannot fit the RCs of the least massive galaxies of the sample, while, for the most massive ones, the best fitting values of the structural parameters of the NFW +stellar/HI disks models, namely the halo concentration and mass and the mass-to-light ratio of the stellar disk, take often non-physical values.
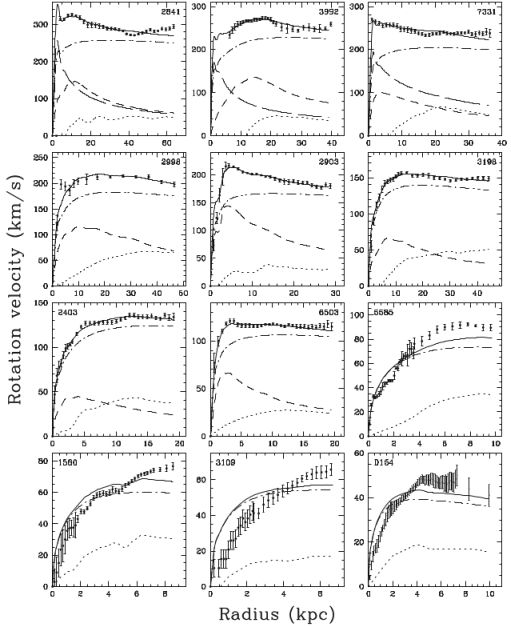 |
Figure 13. Maximum disc best-fits (solid lines) to the RCs (dots with errorbars). Also shown the contribution of gas, disc, bulge, and PI dark halo (dotted, short dashed, long dashed, dash-dot lines). Image reproduced with permission from Bottema and Pestaña (2015), copyright by the authors. |
The Spitzer Photometry & Accurate Rotation Curves sample includes 175 nearby galaxies with surface photometry at 3.6 µm and high-quality rotation curves. This sample spans a broad range of morphologies (S0 to Irr), luminosities ( ∼ 5 dex), and surface brightness ( ∼ 4 dex). These data have been used by Lelli et al. (2016b) in order to build the mass models of the galaxies. They adopted the specific value of 0.5 for the stellar mass-to light ratio in the 3.6 µm-band as suggested by stellar population models and found that Vbary / V varies with luminosity and surface brightness: the stellar disks in high-mass, high-surface-brightness galaxies are nearly maximal, while in low-mass, low-surface-brightness galaxies they are very submaximal. Moreover, in these galaxies, the cored DM halo + (high mass) stellar disk model, generally, reproduces the sample RCs very well, differently from the cuspy halo + (low-mass) stellar disk model that often shows a bad fit and/or non-physical values for the parameters of the mass model.
The mass distribution of 121 nearby objects with high quality optical rotation curves has been recently derived from the Fabry–Pérot kinematical GHASP survey of spirals and irregular galaxies (Korsaga et al. 2018). These galaxies cover all morphological types of spirals and have infra-red 3.6 µm emission measurements, good tracers the old stellar population. Combining the kinematical and the surface brightness data they obtained the mass models once they assumed a specific DM halo density profile. They considered the PI cored profile and the Navarro–Frenk–White cuspy profile. The value of the MD / L3.6 for the stellar disc was obtained for each objects in two different ways: 1) from the stellar evolutionary models and the WISE W1-W2 colours, 2) from fitting the RC. Both approaches found that: (i) the rotation curves of most galaxies are better fitted with a cored rather than with a cuspy profile, (ii) there are luminosity/Hubble type dependent relationships between the parameters of the DM and those of the luminous matter. In detail, in the PI halos framework they found that core radius ∝ (central DM halo density)−1, in very good agreement with Kormendy and Freeman (2004), Donato et al. (2009). In the NFW framework they found a very strong dependence of the concentration on the halo virial mass, in disagreement with the outcome of N-body simulations (e.g., Klypin et al. 2010).
The investigation of DM distribution in our Galaxy is clearly important under many aspects, although it is made difficult by our location inside it. The stellar component can be modeled as a Freeman exponential thin disk of length scale RD = (2.5 ± 0.2) kpc (e.g., Juric et al. 2008).
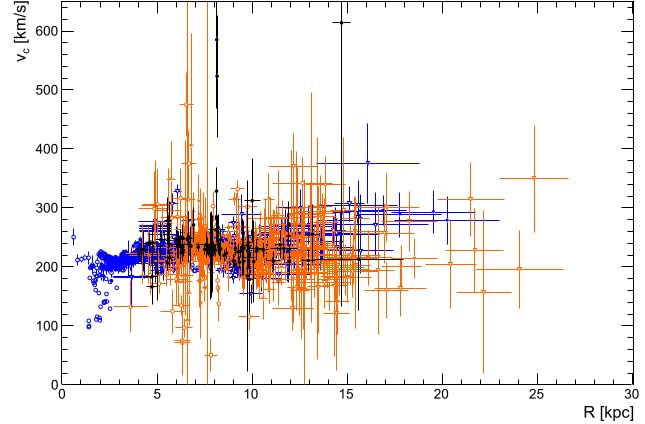 |
Figure 14. Rotational velocities in the Milky Way derived from gas and stellar kinematics (blue, orange) and masers measurements (black)). Notice measurements with huge uncertainty. Image reproduced with permission from Pato and Iocco (2017), copyright by the authors. |
Very precise measurements of position and proper motion of maser sources (Honma et al. 2012) provide us with a reliable solar galactocentric distance of R⊙ = 8.29 ± 0.16 kpc and a circular speed, at R⊙, of V(R⊙) = (239 ± 5) km/s. Adopting these values, for R < R⊙, we can transform the available HI disk terminal velocities VT into circular velocities V(R): V(R / R⊙) = VT (R / R⊙) + (R / R⊙) V⊙ (see McMillan 2011, Nesti and Salucci 2013 and references inside). For R > R⊙ out to ∼ 100 kpc, the MW circular motions are inferred from the kinematics of tracer stars in combination with the Jeans equation (Xue et al. 2008, Brown et al. 2009). 10 In Sofue (2017) the issue of the RC of the MW compared with those of spirals of similar luminosity is discussed.
The mass model of the MW is that of any other spiral: it includes a central bulge, a stellar disk, an extended gaseous disk and all these components are embedded in a spherical dark halo (see Caldwell and Ostriker 1981, Catena and Ullio 2010, Nesti and Salucci 2013, Sofue 2013). As regard to the latter, in a number of studies, the available kinematics is not able to discriminate between the cored and a cusped DM halo profiles (e.g., Catena and Ullio 2010, Catena and Ullio 2012).
Nesti and Salucci (2013) have alternatively assumed a B-URC and a NFW DM halo profile. They fitted the resulting velocity models to the available kinematical data: HI terminal velocities, circular velocities as recently estimated from maser star forming regions and velocity dispersions of stellar halo tracers in the outermost Galactic regions. They found, for the first model, the following best fit values: ρ0 = 4 × 10⁷ M⊙ / kpc3, r0 = 10 kpc and MD = 6 × 10¹⁰ M⊙, Mvir = 1.2 × 10¹² M⊙ that coincide with those of the URC with the same virial mass and optical radius. The mass model with NFW halo profile fits quite well the dynamical data, however, the resulting best fit value for the concentration parameter c is: c = 20 ± 2, higher than the predicted value from only dark matter Λ CDM simulations. Similar findings were obtained also by Catena and Ullio (2010), Catena and Ullio (2012), Deason et al. (2012).
8.3. Low surface brightness galaxies
There is a limited number of recent studies on the RCs of LSB galaxies, although some of these objects appear in well studied samples of disk systems discussed in the previous sections. In LSB the 21-cm HI line provides us with the main observational channel probing the gravitational field: radio telescopes only now reach sufficient spatial resolution and sensitivity to map small and faint objects like LSB. 11
Di Paolo and Salucci (2018) applied to LSBs the concept of the stacked analysis of RCs that in spirals has led us to the URC. They investigated, in a sample of 72 objects with available rotation curves and infrared photometry, the distribution of the baryonic and the dark matter components. The galaxies were divided in five velocity bins according to their increasing values of Vopt. Noticeably, when we plot them in physical units: logV(logr), they show a great diversity: objects with a same maximum velocity possesses very different RC profiles, see Fig. 15. Instead, when we adopt the specifically normalized units: x ≡ r / Ropt and v(x) = V(x) / V(1), the rotation curves log v(logx) of each velocity bin are all alike, see Fig. 15, probing, as in spirals, the idea that by stacking and by coadding diverse RCs, we get a 3D universal profile, i.e., a surface function of x and of one galaxy structural quantity, e.g., logVopt. The diversity in the RCs is caused by the presence of another structural parameter in the mass distribution that the stacking processes and the double-normalization neutralize. From the double-normalized velocities, five coadded RCs have been built: Vcoadd(x, Vopt). They are very well fit by the spirals URC velocity profile VURC(x; ρ0, r0, MD) (see 41) see Figs. 5–6 of Di Paolo and Salucci (2018).
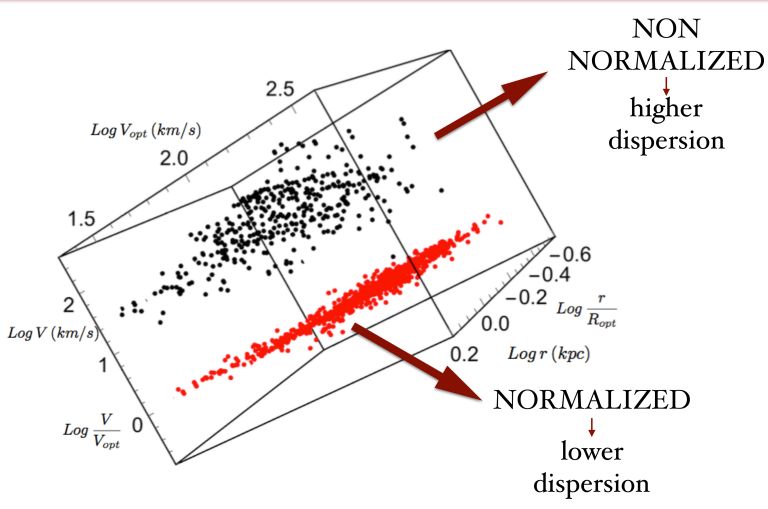 |
Figure 15. The rotation curves of the LSBs sample of Di Paolo and Salucci (2018) in physical (black) and normalized units (red). |
The resulting URC of LSB galaxies (Fig. 18 of Di Paolo and Salucci 2018) implies that the B-URC halo parameters ρ0 and r0 connect with RD and MD in a way similar to that found in spirals (Di Paolo and Salucci 2018). Moreover, also in these objects we find: ρ0 r0 ∼ 100 M⊙ pc−2
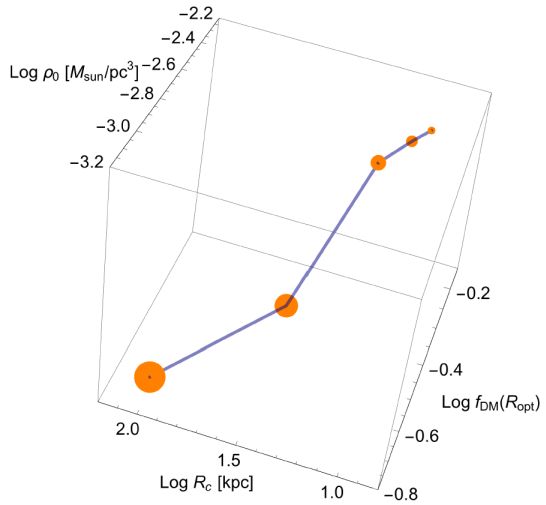 |
Figure 16. The 4D relationship in Fig. 11 (bottom, left) for low-surface-brightness galaxies (Di Paolo and Salucci 2018). Legenda: Rc ≡ r0. |
Remarkably, in LSBs, the URC, expressed in normalized radial units, has two independent parameters: one, as in spirals, is the stellar disk or the halo mass, the second is the compactness, either of the dark halo or of the luminous disk; in fact, a tight correlation between these two quantities emerges (without a plausible physical explanation) (see Fig. 28).
Oh et al. (2015) have investigated 26 high-resolution rotation curves of dwarf (irregular) disk (dd) galaxies from LITTLE THINGS sample, a high-resolution VLA HI survey of nearby dwarf galaxies. The rotation curves were decomposed into their baryonic and DM contributions in a very accurate way: in these objects, the first component is much less important than the second. Generally, the RCs of dds are found to increase with radius out to several disk length scales. Furthermore, the logarithmic inner slopes α of their DM halo densities are very high: ⟨ α ⟩ = −0.32 ± 0.24, in disagreement with the prediction of cusp-like NFW halos ⟨ α ⟩NFW < −1 (see Fig. 17). This result is confirmed also by the full mass modelling when it is possible to accurately perform it.
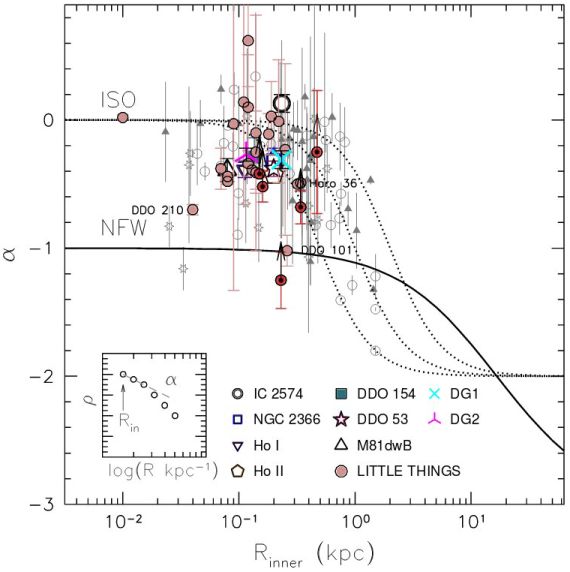 |
Figure 17. The slope α of the DM density: ρDM∝ (r / Rinner)α with Rinner the innermost radius with velocity measurement. Also shown the predictions for halos of mass 1010 M⊙ and a pseudo-isothermal (ISO) or NFW halo profile. Image reproduced with permission from Oh et al. (2015), copyright by AAS. |
Karukes and Salucci (2017) investigated a sample of 36 objects with good quality rotation curve drawn from the Local Volume Sample. They found that, although several objects have a RC suitable for individual mass modelling, on the whole, the stacked analysis yields very important results. They found that, despite variations in luminosities of ∼ 2 dex and, above all, despite a great diversity in their rotation curves profiles V(R), when radii and velocities are normalized by (Ropt, Vopt) the RCs look all alike (see Fig. 18) and lead to what can be considered as the low-mass continuation of Vcoadd(x, MI), the coadded RCs of spiral galaxies. This finding addresses the “diversity problem” (Oman et al. 2015); it confirms that dwarf disk galaxies, with the same maximum circular velocity, exhibit large differences in their inner RC profiles and then, in their inferred DM densities. However, this pattern disappears when the relevant quantities are expressed in normalized units (see Fig. 18). The reason is that these galaxies have a large scatter in the luminosity vs. size relationship (see Karukes and Salucci 2017) which, exactly as in LSB, gets neutralised by the normalization procedure performed while building the Vcoadd. Of course the issue itself does not disappear, but it actually thickens and manifests itself as arisen from the strong correlation between the distribution of dark and luminous dark matter and from the presence in these objects of an additional structural quantity: the compactness C⋆ (see later) belonging to the luminous world, but independent, by construction, of the galaxy luminosity (see Karukes and Salucci (2017)).
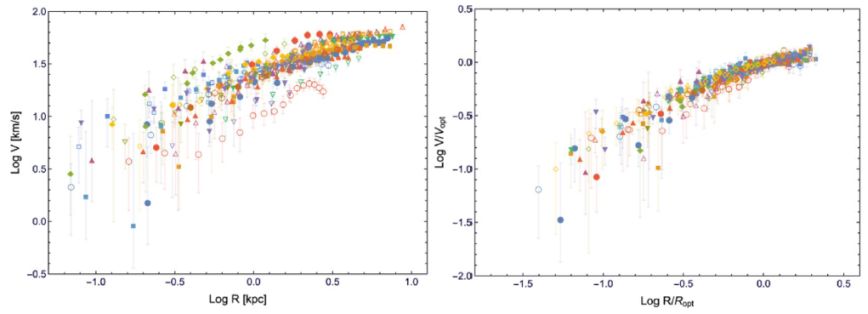 |
Figure 18. dds. The 36 RCs in physical units (left) and in two-normalized units (right). In Karukes and Salucci (2017) one finds the Ropt vs. LK relationship whose scatter is responsible for the evident diversity of the various RC profiles when they are expressed in physical units. Image reproduced with permission from Karukes and Salucci (2017), copyright by the authors. |
Let us stress that, differently from spirals and LSBs, we need just one Vopt to represent all dds double-normalized RC’s, laying in the range 10 km/s < Vopt < 80 km/s: in fact, all their (double normalized) velocity profiles are almost identical. The velocity modelling starts from the coadded RC: Vcoadd(R / Ropt, ⟨ Vopt ⟩), with ⟨ Vopt ⟩ = 40 km/s. As in spirals and LSBs, these data are fitted by the dd URC model that includes an exponential Freeman disc, a B-URC DM halo and a gaseous disks. The fit is very successful, unlike that relative to the NFW halo+stellar and gaseous disks velocity model (Karukes and Salucci 2017).
These systems are strongly dominated by dark matter halos with cored density profile. The core sizes are proportional to the corresponding disk length scales: r0 = 3 RD, continuing the relationship found in spirals and extending it 2 dex down in galaxy luminosity (Karukes and Salucci 2017). Also, all the other dark and luminous structural properties of the dark and luminous matter, including the stellar/DM compactness C⋆ and CDM, result amazingly correlated (Karukes and Salucci 2017).
All structural relationships established in normal spirals extend down to “dd” galaxies, the relevant aspect being that also those that connect the dark and the luminous world continue, unchanged, in objects where the dark matter is, by far, the dominant component.
9 Let us stress that, in this issue, non circular motions in the RCs play a minor role (Oh et al. 2008, Gentile et al. 2005). Back.
10 The raw kinematical data needed to build the Galaxy RC can be found in Pato and Iocco (2017), see Fig. 14. Back.
11 SKA will exponentially increase the amount of available kinematics. Back.