


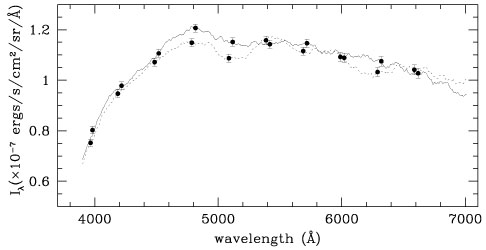
The combined averages of the six spectra taken during the November and December visits, respectively, are shown in Figure 16. With roughly 80 counts per diode, and twelve diodes per resolution element, the statistical error per resolution element for one spectrum is roughly 4%. Statistical errors in the averaged spectra are roughly 1.5-2%, indicated by the error bars which are placed one per resolution element (300Å). The dark subtraction contributes an error of less than 0.5%. We do not show systematic uncertainties, as they will affect both November and December data in the same way and are irrelevant for this comparison. We find that the integrated background flux was brighter in November than in December by 2± 0.5%, in good agreement with the expected change based on the increase in the path-length through the zodiacal plane between visits and empirical estimates from ground-based observations (Levasseur-Regourd & Dumont 1980).
|
Figure 16. Surface brightness of the total
background
detected in the FOS spectra. The solid and dashed lines show the
average of all six spectra taken during the November and December 1995
visits, respectively. The error bars indicate
1 |
Employing the usual definition of the ZL color relative to the solar
spectrum (see Section 2.2), we find
C(7000, 4000) = 1.044 for
the November visit, and 1.075 in the December data, as shown in
Figure 17 with
1 statistical
uncertainty of 0.05%.
The reddening of the ZL relative to the solar spectrum is a function
of the scattering angle and, thus, also of time of year. Again, the
trend we observe is in good agreement with the Helios Space Probe
observations and others (see
Leinert et al. 1981,
and Leinert et al.
1998
for a review). We stress, however, that the FOS spectrum
includes both the EBL and the ZL, and therefore we cannot measure the
color of the ZL explicitly from these observations. It is only
possible to determine the ZL color separately from the EBL by explicit
measurement of ZL absorption features over a wide range in wavelength.
All published colors of the ZL to date rely on broad-band
observations. Separation of the ZL from other the EBL and DGL is
discussed further in Section 11 and in detail
in Paper II.
statistical
uncertainty of 0.05%.
The reddening of the ZL relative to the solar spectrum is a function
of the scattering angle and, thus, also of time of year. Again, the
trend we observe is in good agreement with the Helios Space Probe
observations and others (see
Leinert et al. 1981,
and Leinert et al.
1998
for a review). We stress, however, that the FOS spectrum
includes both the EBL and the ZL, and therefore we cannot measure the
color of the ZL explicitly from these observations. It is only
possible to determine the ZL color separately from the EBL by explicit
measurement of ZL absorption features over a wide range in wavelength.
All published colors of the ZL to date rely on broad-band
observations. Separation of the ZL from other the EBL and DGL is
discussed further in Section 11 and in detail
in Paper II.

|
Figure 17. Color of the detected background with respect to solar. Solid and dashed lines show the detected background in the November and December 1995 data sets, respectively, divided by the Neckel & Labs (1984) solar spectrum at matched resolution. Straight lines show the linear fits. The error bars show the statistical error per resolution element in the FOS spectra. The adopted solar spectrum is simply the fiducial spectrum from which the ZL color is defined, and so it contributes no error here. For further discussion, see Paper II. |
An error budget for the absolute flux calibration of these data is
shown in Table 5 as the error per resolution
element. The random error in the mean flux over the entire spectrum
goes down as the square root of the number of resolution elements
( 10). As discussed in
Section 11, random and
systematic errors have been combined assuming Gaussian and flat
distributions, respectively. For comparison with the WFPC2
observations, we have integrated the FOS spectrum through the F555W
bandpass (see Figure 14) and find the two
results in good agreement. This comparison is subject to the
systematic uncertainties in both data sets.
10). As discussed in
Section 11, random and
systematic errors have been combined assuming Gaussian and flat
distributions, respectively. For comparison with the WFPC2
observations, we have integrated the FOS spectrum through the F555W
bandpass (see Figure 14) and find the two
results in good agreement. This comparison is subject to the
systematic uncertainties in both data sets.