


5.1. Morphological Types and Masses of Double Galaxies
In the preceding chapters we have viewed galaxies in pairs as elementary units, ignoring any differences of morphological type. By taking these differences into account we can find new laws concerning the origin and coupled evolution of double galaxies. The first version of the catalogue of pairs (Karachentsev, 1972) incorporated only broad divisions of double galaxies into ellipticals and spirals. In the present version of the catalogue (Appendix 1), we extend this to a more detailed structural classification of galaxies by Hubble type: E, S0, Sa, Sb, Sc, Sm (see section 2.4). The morphological types are based largely on high contrast prints. For a small fraction of the cases, about 20%, we also had large scale plates taken by the author. In determining types, we further considered estimates of their colours from comparison of the blue and red Palomar charts.
Morphological classification of faint galaxies on the Palomar charts is
often rather uncertain because of the high contrast and overexposure of
the central regions of galaxies,
which applies particularly to objects of low surface brightness.
A further difficulty arises for tight pairs,
where the classical indicators of morphological type are
strongly disturbed by the effects of interaction.
To estimate the errors in classification we turn to the data by
Eichendorf and Reinhart
(1981),
who compiled a sample of double galaxies which satisfy any of the
criteria of
Holmberg (1937),
Karachentsev (1972)
or Turner (1976a).
For their sample they collected data on the apparent axial ratio, position
angles and morphological type (E, S0, Sa, Sb, Sc, Irr) for 1105
pairs of galaxies.
The distribution by Hubble type of 323 galaxies in common between
our catalogue (K) and the sample of Eichendorf and Reinhart (ER)
is presented in Table 11, from which we can draw
some conclusions.
The fractional number with identical classification (the sum
of the diagonal elements of the matrix) is 41%.
The number of cases with errors of one and two classes are
respectively 41% and 13%.
The number of galaxies for which the difference in type
 Ty
Ty
 3 does not exceed 5%.
The mean quadratic error in determining the Hubble type is
<
Ty2>1/2 = 1.18, with a mean value
<TyK - TyER> = - 0.8 ±
0.07, showing that any classification errors are not large
(4).
Know, however, that this comparison was performed on a selection of bright
objects, for which the structural types may be determined with more
certainty than for galaxies closer to the catalogue limit.
3 does not exceed 5%.
The mean quadratic error in determining the Hubble type is
<
Ty2>1/2 = 1.18, with a mean value
<TyK - TyER> = - 0.8 ±
0.07, showing that any classification errors are not large
(4).
Know, however, that this comparison was performed on a selection of bright
objects, for which the structural types may be determined with more
certainty than for galaxies closer to the catalogue limit.
Table 12 shows how the pairs in the catalogue
are distributed by
morphological types of the brighter and fainter components.
Here and in what follows we will discuss only those pairs for which the
orbital mass-to-luminosity ratio does not exceed 100
f .
It follows from these data that there is no large difference between the
structural types of the bright and faint components.
The galaxies of a given Hubble class (excluding Sm) have an excellent chance
of being either the brighter or the fainter member of a double system.
The main property of this matrix of morphological types is the excess
number of pairs along its diagonal.
The tendency of galaxies located in pairs to share morphological types
was remarked by
Karachentsev and
Karachentseva (1974)
and confirmed by
Noerdlinger (1979).
To estimate the magnitude of this effect, if
.
It follows from these data that there is no large difference between the
structural types of the bright and faint components.
The galaxies of a given Hubble class (excluding Sm) have an excellent chance
of being either the brighter or the fainter member of a double system.
The main property of this matrix of morphological types is the excess
number of pairs along its diagonal.
The tendency of galaxies located in pairs to share morphological types
was remarked by
Karachentsev and
Karachentseva (1974)
and confirmed by
Noerdlinger (1979).
To estimate the magnitude of this effect, if
 i is the relative
number of Hubble type i, (i = 1, 2, ..., 6)
in a sub-sample of double
galaxies, then the probability of encountering two galaxies in a double
system with types i and j is given by the relative fraction
ij =
2i
j (i
i is the relative
number of Hubble type i, (i = 1, 2, ..., 6)
in a sub-sample of double
galaxies, then the probability of encountering two galaxies in a double
system with types i and j is given by the relative fraction
ij =
2i
j (i
 j) and
ii =
i2.
The observed and expected number of pairs are presented in matrix form
in Table 13.
As we see, double galaxies with the same structural type are encountered
in the catalogue significantly more often than expected by chance.
This excess even occurs for pairs with mixed Hubble types.
Comparison of these two distributions using a
j) and
ii =
i2.
The observed and expected number of pairs are presented in matrix form
in Table 13.
As we see, double galaxies with the same structural type are encountered
in the catalogue significantly more often than expected by chance.
This excess even occurs for pairs with mixed Hubble types.
Comparison of these two distributions using a
 2 criterion shows
that the assumption of random distributions of morphological types may be
ruled out at the level p << 10-4.
The largest effect is seen for galaxies at the extremes of the Hubble
sequence, Sm and E.
2 criterion shows
that the assumption of random distributions of morphological types may be
ruled out at the level p << 10-4.
The largest effect is seen for galaxies at the extremes of the Hubble
sequence, Sm and E.
It is well known that the distributions of elliptical and spiral
galaxies are coupled strongly to the local concentration of galaxies.
Objects of early type, E and S0, concentrate in the central regions of
rich clusters, while spirals and irregular galaxies are distributed on the
edges of clusters, in smaller groups and throughout extra-galactic space.
This universal law is just as visible in the simplest systems,
the double galaxies.
Table 14 presents the number
ni and relative fraction
i of various Hubble
types among catalogue double galaxies
and single (isolated) galaxies from the
Karachentseva (1973)
catalogue. Also shown is a sub-sample of wide pairs in which the components
have a projected mutual separation exceeding 50 kpc.
It is apparent that the late types (Sb, Sc, Sm) are
encountered less often among double galaxies than among isolated systems.
This conclusion is supported by the statistics for the axial ratios
of spiral galaxies in both catalogues
(Karachentsev and
Karachentseva, 1974),
as well as by radio data on the abundance of neutral hydrogen
(Balkowski and Chamaraux,
1981).
Note that the photometric limits in the region of the sky covered by the
catalogues of pairs and of isolated galaxies are identical, and so,
therefore, differences in the occurrence of early and late types cannot be
artefacts of any sort of selection effects.
The morphological type segregation is also present among double systems as a function of separation. Wide pairs with X > 50 kpc contain a smaller number of elliptical and lenticular galaxies, approaching the values found among isolated systems, and objects of irregular types are almost absent among these wide pairs. These properties are apparently due to differences in the formation conditions for wide and close double systems.
In the literature one may encounter additional discussions about the
dependence of the structural type of a galaxy on that of its nearest
neighbour.
One source of such an effect might be the heating of the disk of a spiral
galaxy due to the passage of massive satellites.
Numerical experiments by
Gerhard and Fall (1983)
show, however, that `blowing up' a galaxy (increasing the stellar
velocities in the z coordinate)
is effective only when the velocity of relative motion of the two
galaxies is more than three times the mean rotation velocity of the disk.
This condition is satisfied in rich clusters, but in pairs and small
groups this method is not sufficient to change the thin disk of a
spiral into a thick one.
Dressler (1980)
examined a further mechanism for morphological segregations,
according to which the formation of gaseous disks in spiral galaxies, and
stellar sub-systems within the disks, takes place over a time
t
2 × 10⁹ years.
If galaxies have close neighbours during this period, then their
presence may block or delay the formation of flat sub-systems.
We now return to the question of the correlation of structural types
between galaxies in pairs. Let
n0(
Ty) indicate the total observed number of double systems
in the catalogue with Hubble type difference
Ty = 0, 1, ...5,
and let
np(
Ty) be the analogous expected number of
systems for a random distribution of galaxies in pairs.
These numbers are easily derived from the diagonal elements of the matrix
in table 13.
We introduce the correlation function by morphological type,
 |
(5.1) |
The values of this function for the sample of 487 pairs are presented in figure 33 as diamonds, the height of which indicates the statistical standard deviation in the mean. The data for 118 wide pairs are indicated by the points, with their associated standard deviation. NOTE: We will have to include the more recent Japanese work on nearest neighbours, incorporating radial velocities, at this point.
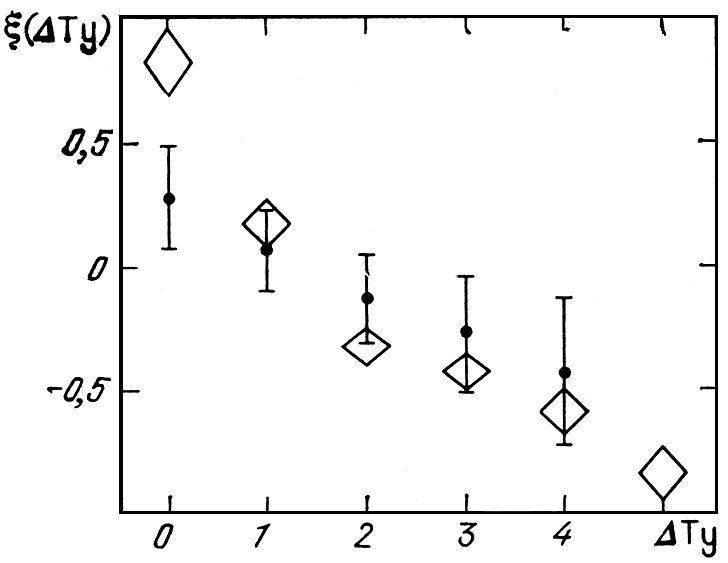 |
Figure 33. |
As is apparent, the correlation function has significant
values only for identical and neighbouring Hubble types.
For wide pairs, the amplitude
 (0) is
significantly smaller than for the entire sample.
The excess relative number of `twins' among tight pairs may follow from
various processes which would tend to synchronize the evolution of double
galaxies, such as the exchange of gas, a change in stellar orbits due
to resonance effects, or bursts of star formation.
On the other hand, the apparent match in structural types
and their further dependence on separation may have
their origin in simultaneous epochs of formation of the members of pairs
in identical environments.
Is there a morphological effect due to relict causes, or does it
indicate evolutionary processes ?
The answer to this crucial question can still not be given.
(0) is
significantly smaller than for the entire sample.
The excess relative number of `twins' among tight pairs may follow from
various processes which would tend to synchronize the evolution of double
galaxies, such as the exchange of gas, a change in stellar orbits due
to resonance effects, or bursts of star formation.
On the other hand, the apparent match in structural types
and their further dependence on separation may have
their origin in simultaneous epochs of formation of the members of pairs
in identical environments.
Is there a morphological effect due to relict causes, or does it
indicate evolutionary processes ?
The answer to this crucial question can still not be given.
We note here two circumstances.
According to the data in figure 33 the
correlation function
( Ty) is significant only
for Ty
 1.
For a mean error in the type
1.
For a mean error in the type
 (Ty)
(Ty)
 1,
the error in classification should contribute significantly to
the correlation function.
Detailed estimates show that this will increase the amplitude of
(0) by 1.5 to 2
times.
1,
the error in classification should contribute significantly to
the correlation function.
Detailed estimates show that this will increase the amplitude of
(0) by 1.5 to 2
times.
These estimates of the probability of encountering galaxies of various morphological types in double systems characterize their catalogue, and not their spatial, distribution. This caution applies as well to the correlation function for Hubble types. The difference between the partial distributions of objects of two types, per unit volume and in the catalogue, depends on the difference in their luminosity functions. An attempt to go from the catalogue to the true distribution of galaxies by morphological type was made by Arakelian (1983b).
Table 15 illustrates the variation along the
Hubble sequence of the mean
absolute magnitude and mean linear diameter of double galaxies, along
with the standard deviations of these quantities,
(M) and
(A).
Excluding the irregular galaxies, the luminosity function and diameter
function for pair members does not depend strongly on morphological type,
in agreement with the results of
Sandage et al. (1985).
Because the luminosity of Sm galaxies is an order of magnitude lower than
for other types, the true density of such objects per unit volume will be
considerably higher than in the catalogue (magnitude limited) sample.
Thus Sm galaxies comprise 45% of the 12 closest pairs
(table 10),
instead of the 6% characteristic of the entire catalogue.
We have already remarked that pairs of galaxies exhibit a morphological segregation which depends on separation. In Table 16 we present the mean values of the projected separation and radial velocity difference for double galaxies of various types. On passing from early to late Hubble types we note a tendency for increasing separation and decreasing radial velocity difference. However, double systems containing dwarf components of type Sm deviate from this property, due to selection effects (the criteria discriminate against wide pairs containing galaxies of low luminosity).
In the previous chapter we concluded that the orbital masses
of double galaxies agreed very well with their individual masses measured
from rotation curves.
Do we observe such agreement for selected morphological types of galaxies ?
The data on this question have a somewhat contradictory history.
Page (1952,
1960,
1961),
who first measured radial velocities
for double galaxies, gave estimates for orbital mass-to-luminosity ratios
for elliptical galaxies two orders of magnitude greater than for spirals.
Page considered that this result indicated the large virial values of
f
in clusters, in which elliptical and lenticular systems are concentrated.
On the other hand, a strong difference between EE and SS galaxies by
mass-to-luminosity ratio is not supported by measures of the stellar
velocity dispersion in the central parts of elliptical galaxies.
These results may be satisfied by the simple proposition that ellipticals
concentrated in rich clusters and compact groups should include a
significant number of false pairs where the galaxies are projected nearly
in contact with one another and have radial velocity differences of order
the virial velocity of the cluster.
Further, excluding the false pairs by means of the isolation criterion,
we may consider the ratio fE/fS.
Using the sub-samples of
Turner (1976b),
Karachentsev (1977),
and Peterson (1979b)
this ratio is reduced to fE / fS
2.
We now examine the dependence of f (Ty) on the properties of
pairs for the entire sample catalogue.
The estimates in the literature on the mass-to-luminosity ratio for systems
of various types are collected in table 17.
The first column indicates the Hubble type of the galaxies,
the second, the mean mass-to-luminosity ratio
<f> and the standard deviation in the mean,
the third indicates the number of observed objects n, and the
final one the source for the data.
The data as presented by various authors have been reduced to a standard
system of apparent magnitude BT0 and
standard radius R25 for a Hubble
constant H = 75 km/s/Mpc and an absolute solar magnitude
M = 5.40.
Within the bounds of each morphological type, the mass-to-luminosity
ratios as obtained by various methods (stellar velocity
dispersion, rotation curve, or 21-cm HI line width)
showed satisfactory agreement.
For galaxies of type Sm estimates of the mass from the 21-cm profile may
be affected by systematic errors in measuring the width of weak lines and
by neglect of turbulent velocities in the objects seen almost face-on
(Lewis, 1983).
The compilation of these data supports the general trend remarked by
Faber and Gallagher (1979):
with decreasing importance of the spheroidal component to the integrated
luminosity of the galaxy, the mass-to-luminosity ratio
decreases from values f (E)
10 to
f (Sm) 4.
An analogous trend can be demonstrated for the mean ratio of orbital
mass to luminosity for double galaxies.
Of the 487 pairs having f < 100 we have selected the systems with
identical structural types of the components.
To reduce the role of radial velocity errors we excluded 15 pairs
for which the error
fu
(see section 4.2) exceeds 5.
Averaging the orbital mass-to-luminosity ratios gives the results shown in
the last column of table 15.
Because of an unsatisfactorily small sample size, there was only one
S0+S0 pair, so the mean for this type was calculated by including the
14 E+S0 pairs.
The reduced data are presented together in figure 34. The mean orbital mass-to-luminosity ratio for 107 pairs is shown as diamonds, the height of which indicates the standard deviation of the mean. The points show the mean for various types of galaxies according to the data in table 17. The mean individual mass-to-luminosity ratios for 209 individual components (Karachentsev, 1985) are shown as the crosses.
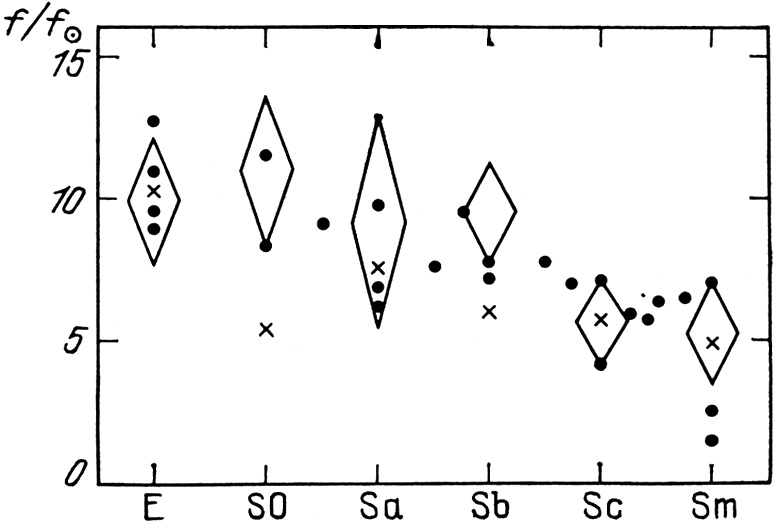 |
Figure 34. |
In agreement with the conclusions of the previous chapter, we may
confidently assert that the orbital mass-to-luminosity ratio for double
galaxies agrees with the individual f values not only in general
but also for each individual morphological type.
The contention often found in the literature that the masses of pairs of
elliptical
(Rood, 1976)
and of dwarf
(Lake and Schommer, 1984)
galaxies are unusually high (f
100) are contradicted
by the results in figure 34.
The excessive estimates of pair masses by these authors are apparently
due to the inclusion of a large number of false double systems.
It must be stressed that the excellent agreement between orbital and
individual masses for galaxies of every Hubble type would be very difficult
to understand if the majority of the mass of double galaxies were located
in invisible extensive haloes around the individual components of double
systems.
4 For 76 galaxies in common with the
catalogue of
de Vaucouleurs et al. (1976)
(V) we find <TyK - TyV> =
-0.16 ± 0.10 and
< Ty2
>1/2 = 0.87.
Back.