


In this section we shall attempt to interpret the color-color and color-aperture results presented above in terms of simple stellar population and/or metallicity considerations.
The bifurcation seen in Figure 22 between the elliptical and morphological galaxy sequences indicates that a fundamental difference exists between the two distributions. That the former is probably a metallicity sequence was shown in Paper I, where it was found that 1) the V - K color depended on luminosity to as comparable a degree as the U - V color, and 2) the elliptical galaxy distribution in a UVK color-color plot was continuous with a globular cluster sequence that was ordered by metallicity (cf. Figure 22). Previous studies of optical line indices by McClure and van den Bergh (1968) and by Faber (1973) also indicated that the UBV color-luminosity relation in ellipticals (e.g., de Vaucouleurs 1961; de Vaucouleurs and de Vaucouleurs 1972; Sandage 1972) is most likely explained by an increase of mean metallicity with luminosity. (Further discussion of the relation between UVK colors and metallicity is given in Appendix C.)
On the other hand, the spectroscopic work of Morgan (Section IIIb) clearly demonstrates that the UBV color-morphological distribution of galaxies is primarily a stellar population sequence. We shall show that simple populations changes can also account for the nature of the morphological sequence apparent in Figure 22.
In Figure 23a we have plotted the mean U - V and V - K colors from Table 9, using values for the restricted sample only far types Sa - Sd. The heavy line connecting these points is labelled log A / D0 = - 0.6. Also shown is a second sequence labelled log A / D0 = - 0.2, which at a projected aperture size corresponding approximately to Palomar Observatory Sky Survey spiral galaxy diameters, is more representative of the total integrated galaxian light. This latter sequence was determined as follows: For V - K, an extrapolation was made using values at log A / D0 = - 0.6 and the mean color gradients from Table 7. For U - V, integrated colors from a compilation by Huchra (1977a), were used. These values, based on a sample of data from de Vaucouleurs (1961) about three times larger than the present one, and requiring little aperture extrapolation, are corrected for reddening and redshift (but not for inclination effects) using essentially the same relationships as in this paper. If we instead extrapolate the mean U - V colors from Table 9 to log A / D0 = - 0.2 using the color gradients in Table 7, the difference (U - V)extrapolated - (U - V)Huchra is 0.00, 0.03, 0.14, 0.12, 0.10, 0.13, 0.07, and -0.11 for galaxy types E, S0, S0/a - Sab, Sb, Sbc, Sc, Scd - Sd, and Im, respectively. While the agreement is encouraging, the U - V colors of our spiral sample do appear to be systematically 10% redder than in Huchra's larger sample, a result we believe is compatible with the allowable sampling error.
Figure 23a shows that the mean integrated V - K
color remains essentially constant from types E to Sbc,
changing by only 0.08 mag; whereas the U - V color changes
by 0.66 mag over this same range. However, from types Sbc
to Im, the V - K color changes by 0.85 mag, while the U - V
color now changes by only 0.56 mag. This behavior can be
well understood in terms of the composite effect of mixing
red and blue stars. This point is illustrated in
Figure 23b
where we have plotted a "mixture line" obtained by combining
together various proportions of an A0 dwarf (U - V = V - K
= 0.) and an MO giant (U - V = 3.43, V - K = 3.74). At the
tick mark labelled 0.2, 200 of the V light is contributed
by the dwarf; at 0.3, 30% is from the dwarf, etc. Also
shown in the figure are the mean integrated colors from
Figure 23a at
log A / D0 = - 0.2. Our simple two component
model reproduces the morphological sequence quite well: As
we add blue colors to a red object, the blue color of the
composite mixture is primarily affected - from 0.2 to 0.5
along the mixture line,
 U - V
= 0.7 and
V - K
= 0.3. Similarly, as red colors are added to a blue object, the
red color of the composite mixture is primarily affected -
from 0.8 to 0.5 along the mixture line,
U - V
= 0.5 and
V - K
= 1.0. We de not consider the systematic difference
between the mixture line and the early-type galaxies significant in view
of the simple nature of the model.
U - V
= 0.7 and
V - K
= 0.3. Similarly, as red colors are added to a blue object, the
red color of the composite mixture is primarily affected -
from 0.8 to 0.5 along the mixture line,
U - V
= 0.5 and
V - K
= 1.0. We de not consider the systematic difference
between the mixture line and the early-type galaxies significant in view
of the simple nature of the model.
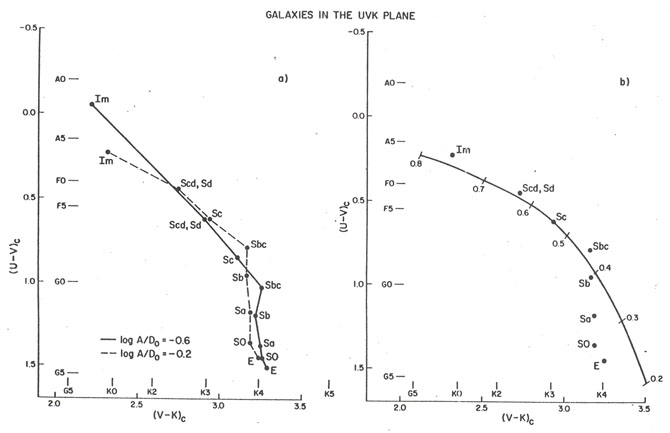 |
Figure 23. a) The mean U - V and V - K colors as a function of morphological type are shown for the restricted sample of galaxies from Table 8 in this paper, and for the galaxies in Table 4 of Paper I, for two values of log A / DO. The horizontal and vertical spectral type scales are for giant stars and are adopted from Johnson (1966a). See text for further details. b) The heavy line shows the locus of various mixtures of an A0 V and an MO III star. At the tick mark labelled 0.2, 20% of the light at V is contributed by the dwarf star; at 0.3, 30% of the V light is from the dwarf star, etc. Also shown are mean integrated colors at log A / D0 = - 0.2, grouped by morphological type as in Figure 23 a). |
Our two-component model is also generally consistent with the relation of purely infrared colors with morphological type, as the following table shows:
| V flux | J - H | H - K | CO |
| 100% M0 III | 0.79 | 0.16 | 0.17 |
| 50% M0 III, 50% A0 V | 0.75 | 0.15 | 0.16 |
| 20% M0 III, 80% A0 V | 0.65 | 0.14 | 0.15 |
The model predicts that only in the latest-type galaxy will the J - H color become blue, while the H - K color, still dominated by the M giant, will not change significantly, in agreement with the results in Tables 9 and 10. However, the model does not appear to adequately account for the apparent decrease in the CO index seen in the latest-type galaxies (Tables 9 and 10).
There are two ways a decrease in the CO index can occur: either the giant branch luminosity function becomes dominated by hotter stars, or the giant-to-dwarf ratio changes. The first effect will lower both the CO and H2O indices and result in bluer J - H and H - K colors; while the second effect will lower just the CO index, actually raise the H2O index, give a bluer J - H color, and leave the H - K color-relatively unchanged - as the mean stellar relations in Figures 18 - 21 indicate. If both effects are operating, the CO index and J - H color will decrease significantly more than the H2O index or H - K color, which is just what is observed. In particular, the two (non 2.2 µm excess) galaxies in Table 8 with the smallest CO indices, NGC 4449 and 4490, are also the two latest galaxies morphologically for which the narrow-band indices were measured. The mean CO index of these two galaxies, 0.095, is ~ 6% less than in earlier-type galaxies; while the mean H2O index, also 0.095, is only ~ 2% lower than in earlier-type galaxies.
Now recent evolutionary studies of galaxies based on theoretical stellar tracks (e.g., Tinsley 1972; Searle, Sargent and Bagnuolo 1973; Huchra 1976; Larson and Tinsley 1977) suggest that all galaxies are approximately the same age, but differ in the time dependence of their star formation rates. In elliptical galaxies, the bulk of star formation is thought to have occurred within a short period (~ 109 years), some 1010 years ago; while in the latest-type spirals, the star formation is believed to be roughly uniform over the galaxian lifetime. In the latter case, both effects discussed above for lowering the CO index will be operating: First, the high mass objects from newborn generations that are dominating the light spend a proportionately smaller part of their lifetimes as evolved M stars; while second, many successive generations of M dwarfs will have piled up along the main sequence. On the other hand, the high mass stars will lead to a larger proportion of supergiants among the evolved M stars that are present, which will act to raise the narrow-band indices (Appendix A). The ultimate effect on the narrow-band indices is thus uncertain. Clearly, both detailed evolutionary models, and a significant increase in the observational material for late-type galaxies, would be of interest.
Published evolutionary star formation models (cf. Huchra 1977; Larson and Tinsley 1977) are largely based on UBV colors alone, and so, for instance, cannot well distinguish between truly young galaxies, and older galaxies with a recent star formation burst. Such models also have difficulty in disentangling metallicity and/or reddening effects, since these tend to parallel the UBV color-morphology sequence. The appearance of Figure 22 suggests that studies of star formation in the UVK plane, or in UBVK space, should prove very fruitful.
Radial UVK color gradients found in Paper I for
ellipticals and in this paper for early-type spirals,
coupled with observations of radial CN gradients
(Welch and Forrester,
1972;
McClure, 1969;
Spinrad et al., 1971;
Spinrad, Smith, and
Taylor, 1972)
suggest the presence of
metallicity gradients in galaxies dominated by an amorphous
population. Now both the mean U - V and V - K color
gradients in galaxies of type Sa are similar to those in
E and S0 galaxies (Table 7).
However, the large increases
in the U - V gradient for types Sb and Sbc probably reflects
the color transition from the red bulge component to the
blue disk component, rather than metallicity effects.
That the mean V - K gradients in these types (and in
the bin labelled "blue" in the last line of
Table 7) are
smaller than the population-driven U - V gradients can again
be understood as the composite result of mixing red and blue
objects. In this case, as emission from blue disc stars
(and perhaps gas) is introduced to the red bulge component,
blue colors (i.e., U - V) are primarily affected. In fact,
the mean V - K gradient in the Sb sample is similar to that
in earlier-type galaxies, and may thus be indicative of a
comparable metallicity change in the bulge component.
Tifft's (1963)
suggestion that color gradients in early
type spirals result from a radial increase in dust absorption'
does not seem tenable, since from the reddening law we would expect
V - K
/ U -
V > 1, which is in fact seen for only
20% of the total S0/a - Sbc sample.
Unfortunately, straightforward interpretation of the UVK gradients in the latest-type galaxies is difficult in view of the large dispersion of color gradient means.
The lack of radial gradients in the JHK colors
for the spiral galaxy sample
(Table 7) suggests that radial
population and/or metallicity changes are most evident at
wavelengths shortward of 1.2 µm. The large J - K gradient
found in Paper I implied just the opposite to be true for
E and S0 galaxies. However, the latter result seems
difficult to understand in light of recent globular cluster
measurements (Appendix C) which indicate
that a metallicity driven color gradient should lead to
J - K
/ V -
K  0.3,
whereas in Paper I we found
J - K
/ V -
K 1.1. As
discussed in Section II, serious
systematic errors may be present
in the J measurements. On the other hand, the possibility
exists that linearly extrapolated calibrations based on
metal-pool galactic globular clusters are simply inadequate
for describing metal-rich systems.
0.3,
whereas in Paper I we found
J - K
/ V -
K 1.1. As
discussed in Section II, serious
systematic errors may be present
in the J measurements. On the other hand, the possibility
exists that linearly extrapolated calibrations based on
metal-pool galactic globular clusters are simply inadequate
for describing metal-rich systems.